| Tissue | Expression Dynamics | Abbreviation |
| Colorectum (GSE201348) |  | FAP: Familial adenomatous polyposis |
| CRC: Colorectal cancer |
| Colorectum (HTA11) | 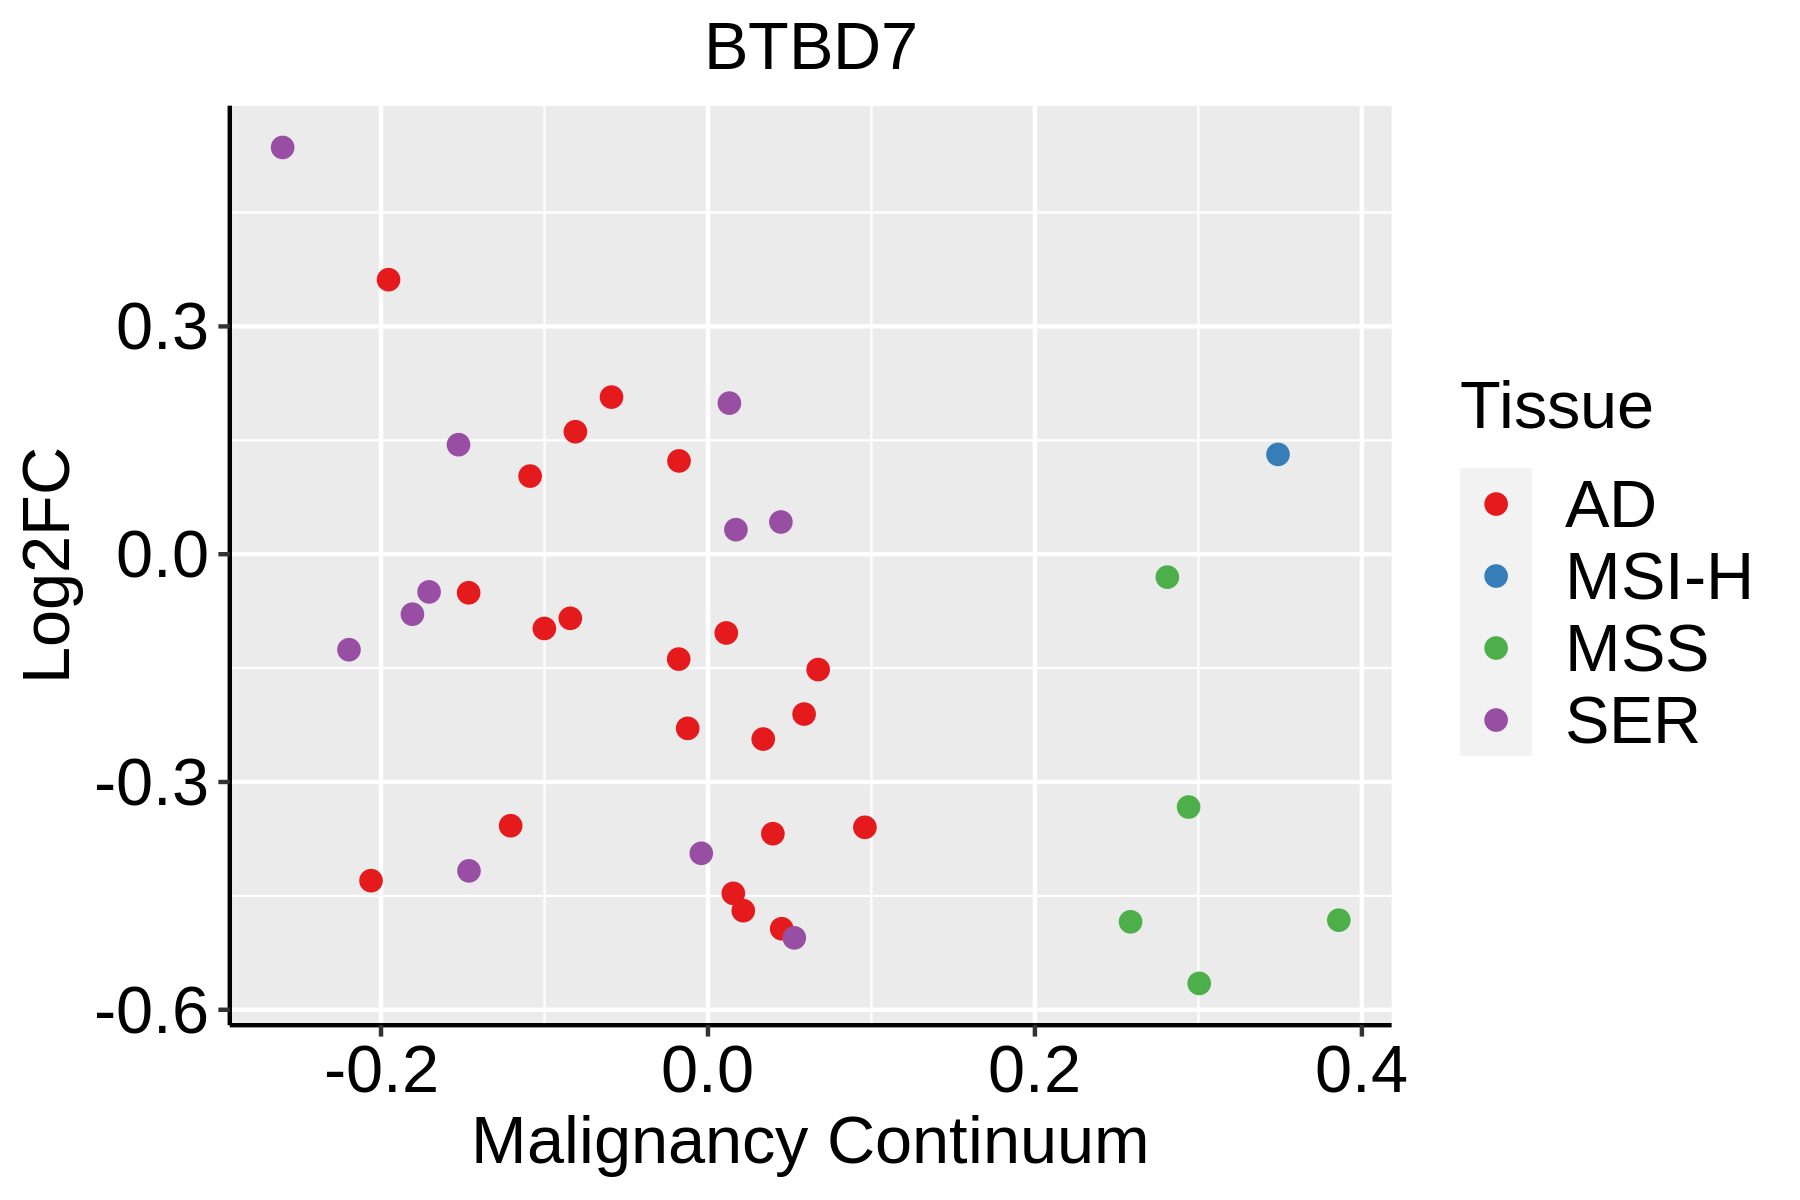 | AD: Adenomas |
| SER: Sessile serrated lesions |
| MSI-H: Microsatellite-high colorectal cancer |
| MSS: Microsatellite stable colorectal cancer |
| Esophagus | 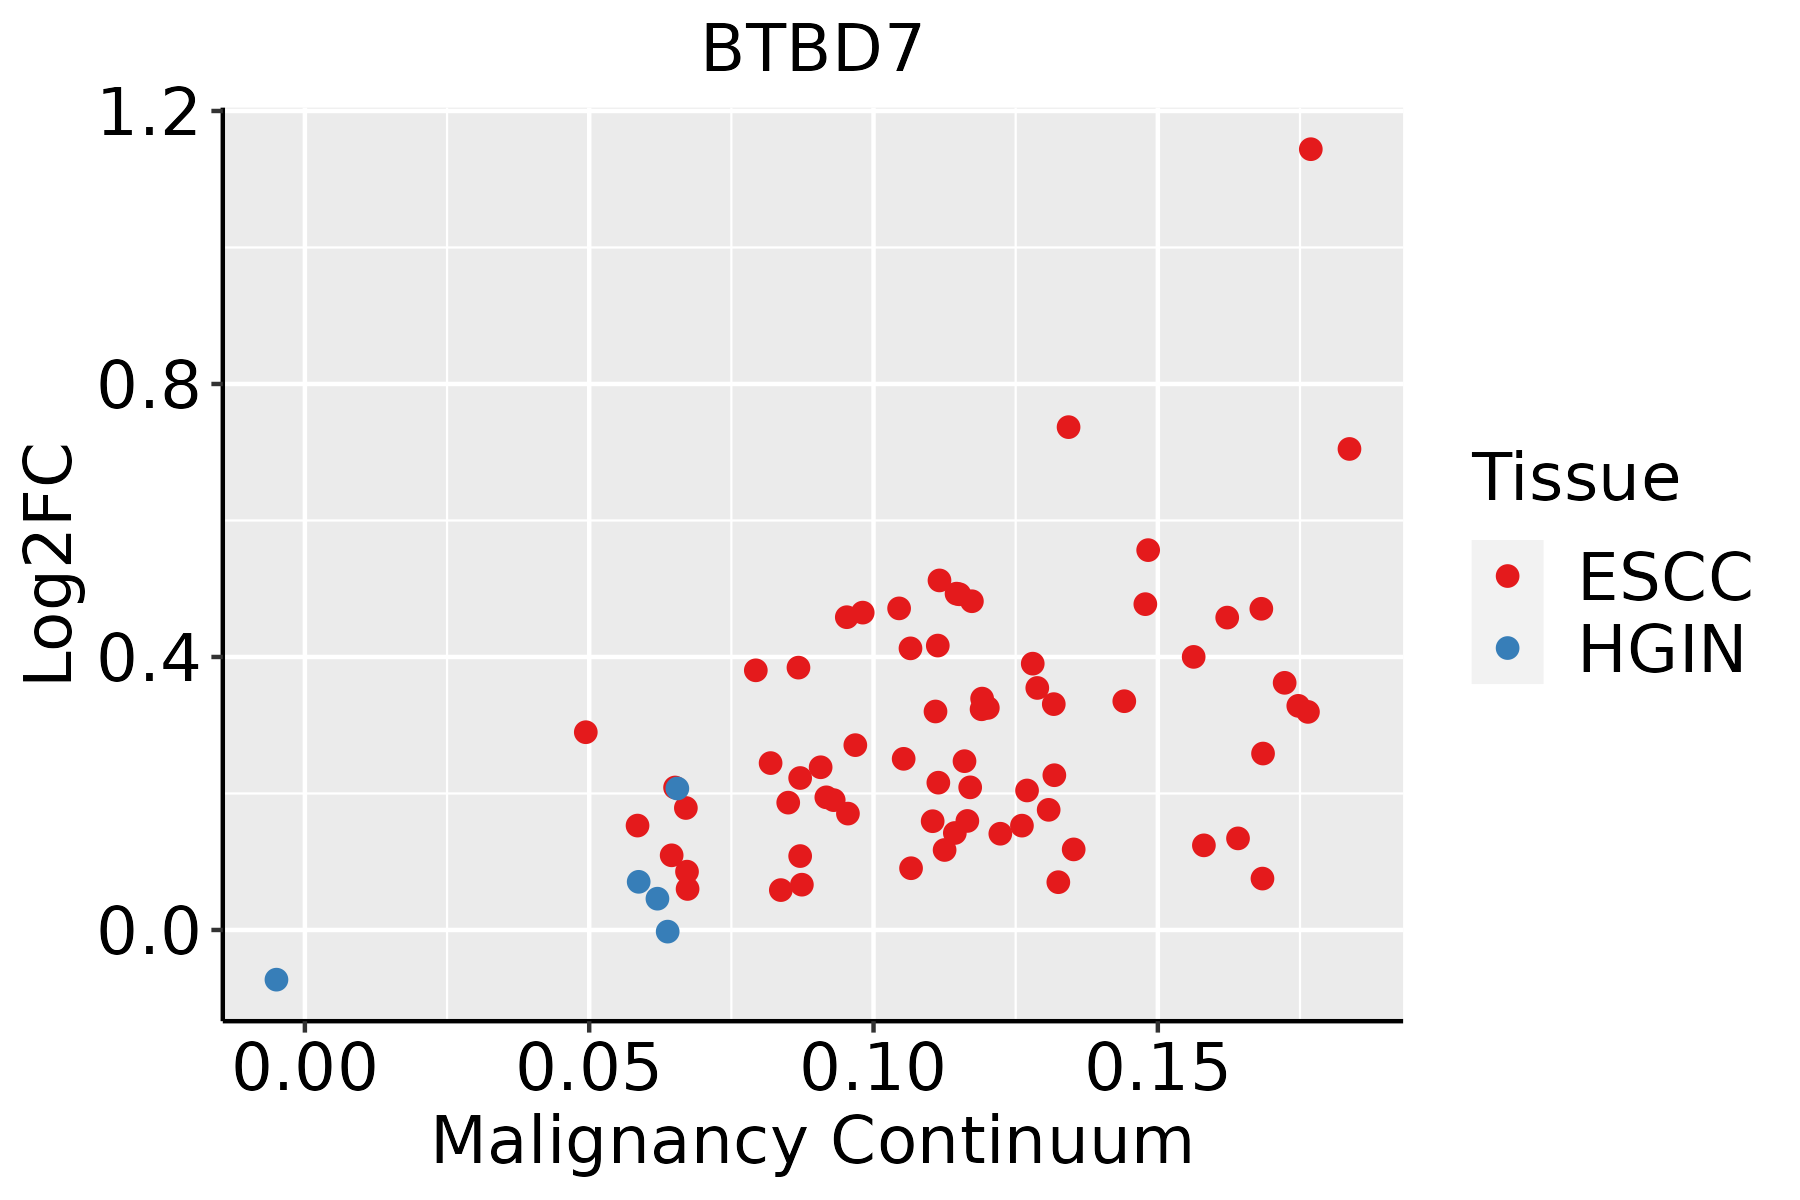 | ESCC: Esophageal squamous cell carcinoma |
| HGIN: High-grade intraepithelial neoplasias |
| LGIN: Low-grade intraepithelial neoplasias |
| Liver |  | HCC: Hepatocellular carcinoma |
| NAFLD: Non-alcoholic fatty liver disease |
| Lung | 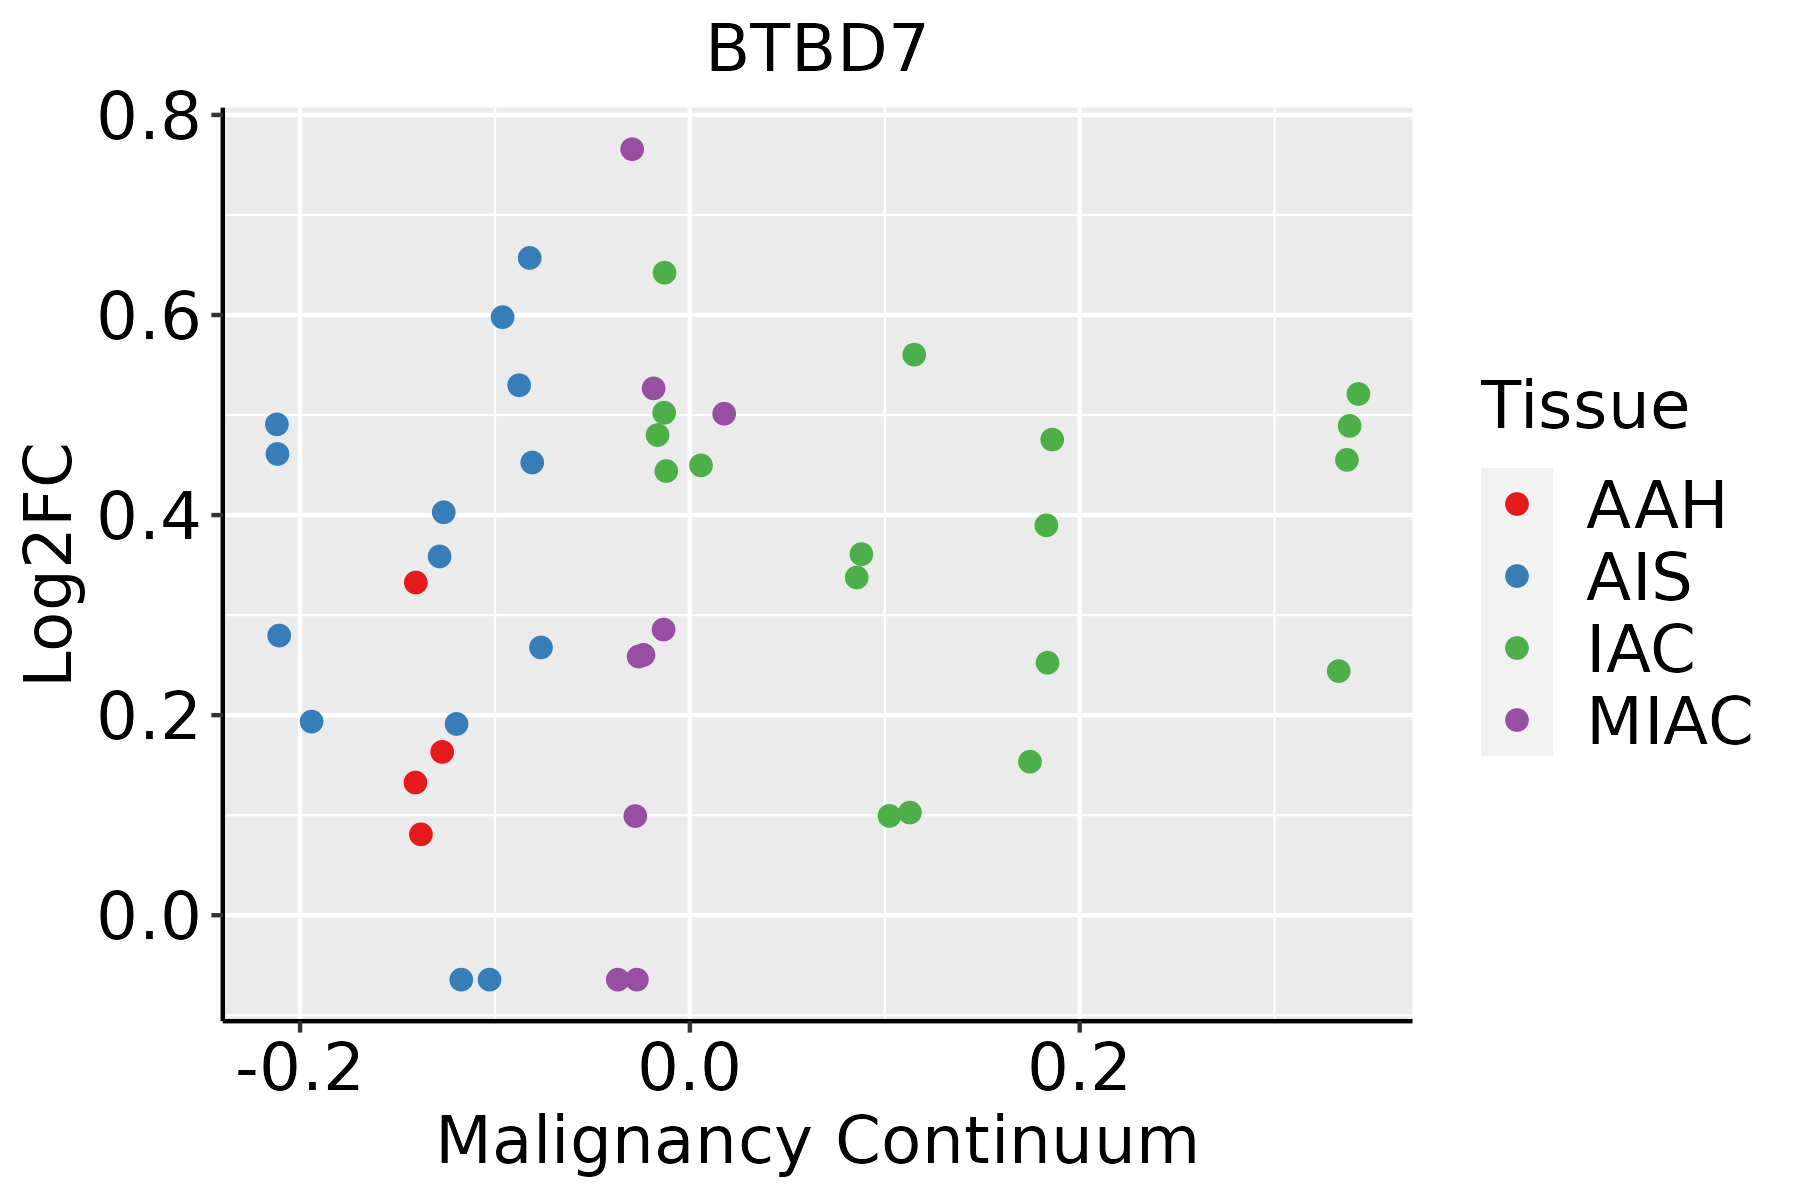 | AAH: Atypical adenomatous hyperplasia |
| AIS: Adenocarcinoma in situ |
| IAC: Invasive lung adenocarcinoma |
| MIA: Minimally invasive adenocarcinoma |
| Oral Cavity | 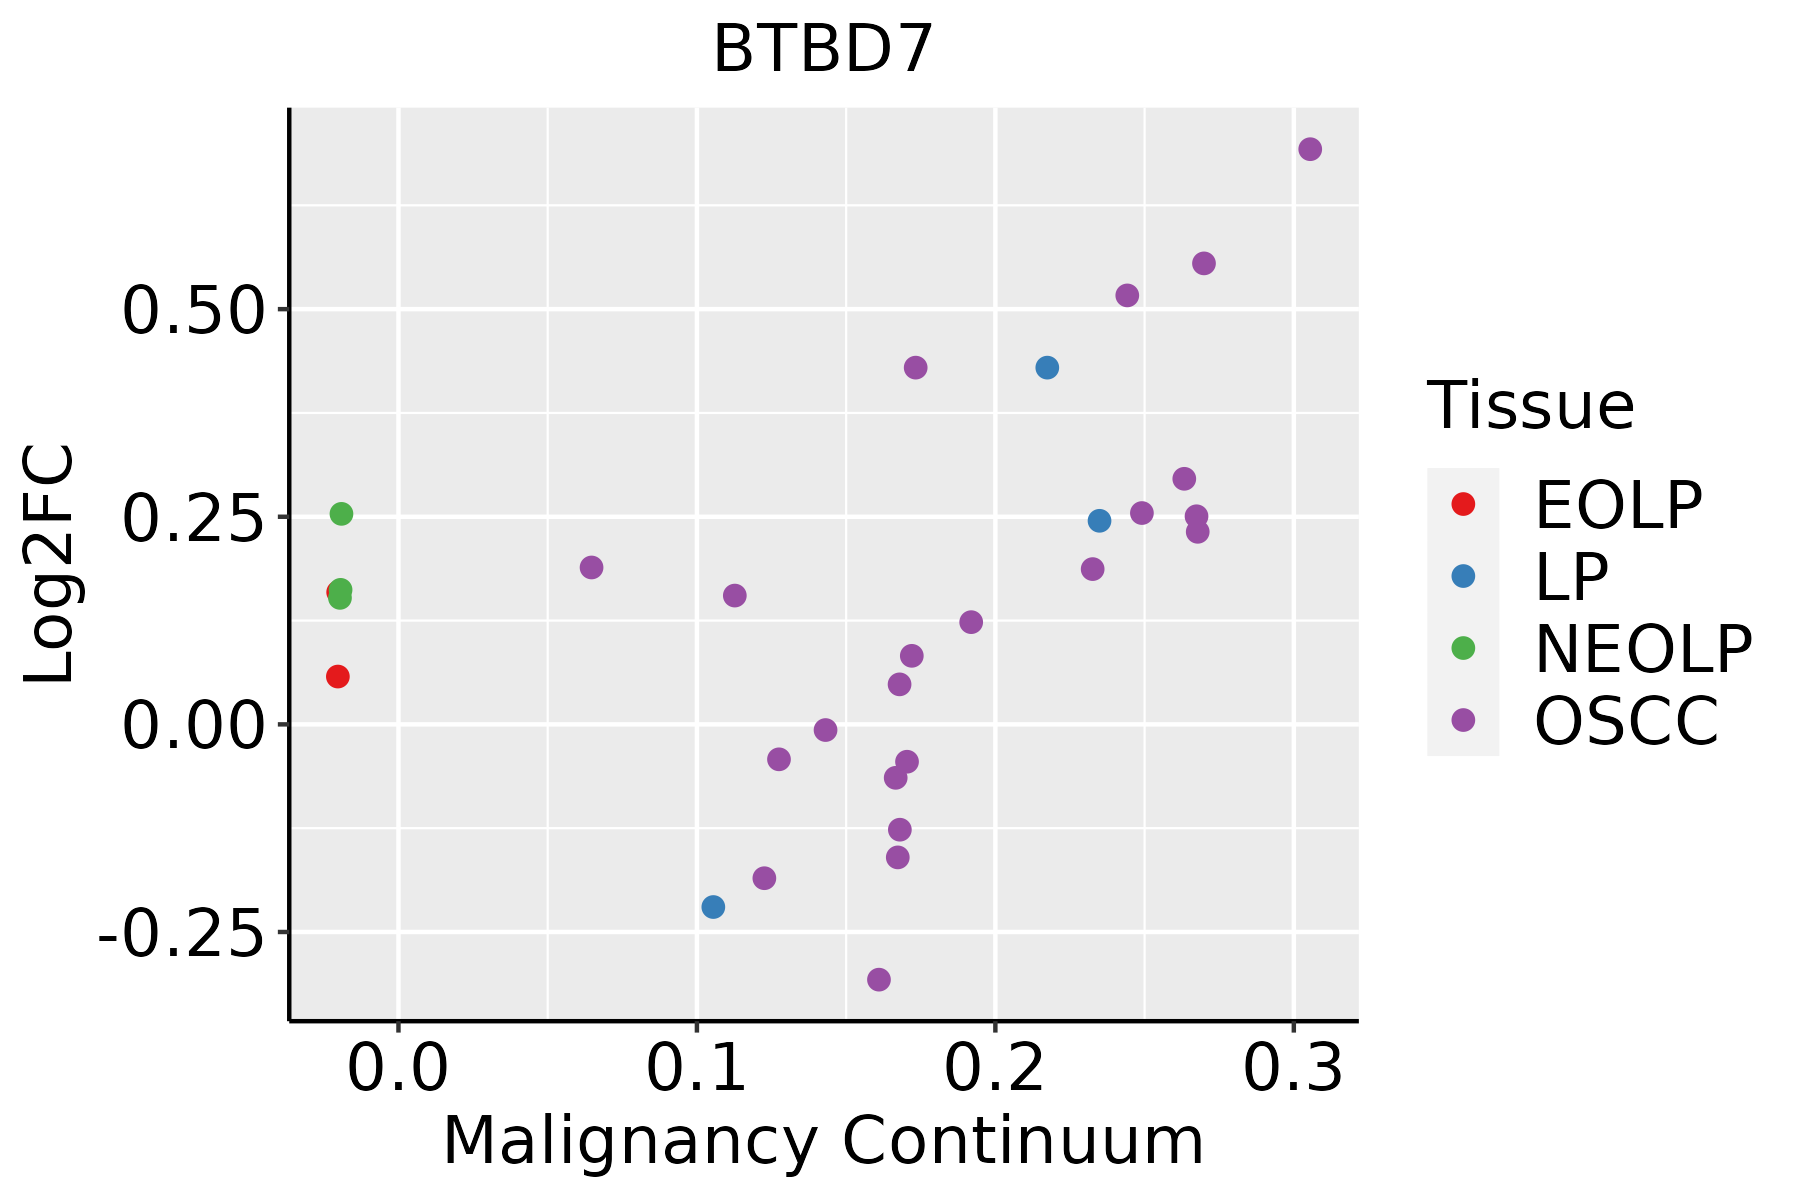 | EOLP: Erosive Oral lichen planus |
| LP: leukoplakia |
| NEOLP: Non-erosive oral lichen planus |
| OSCC: Oral squamous cell carcinoma |
| Prostate | 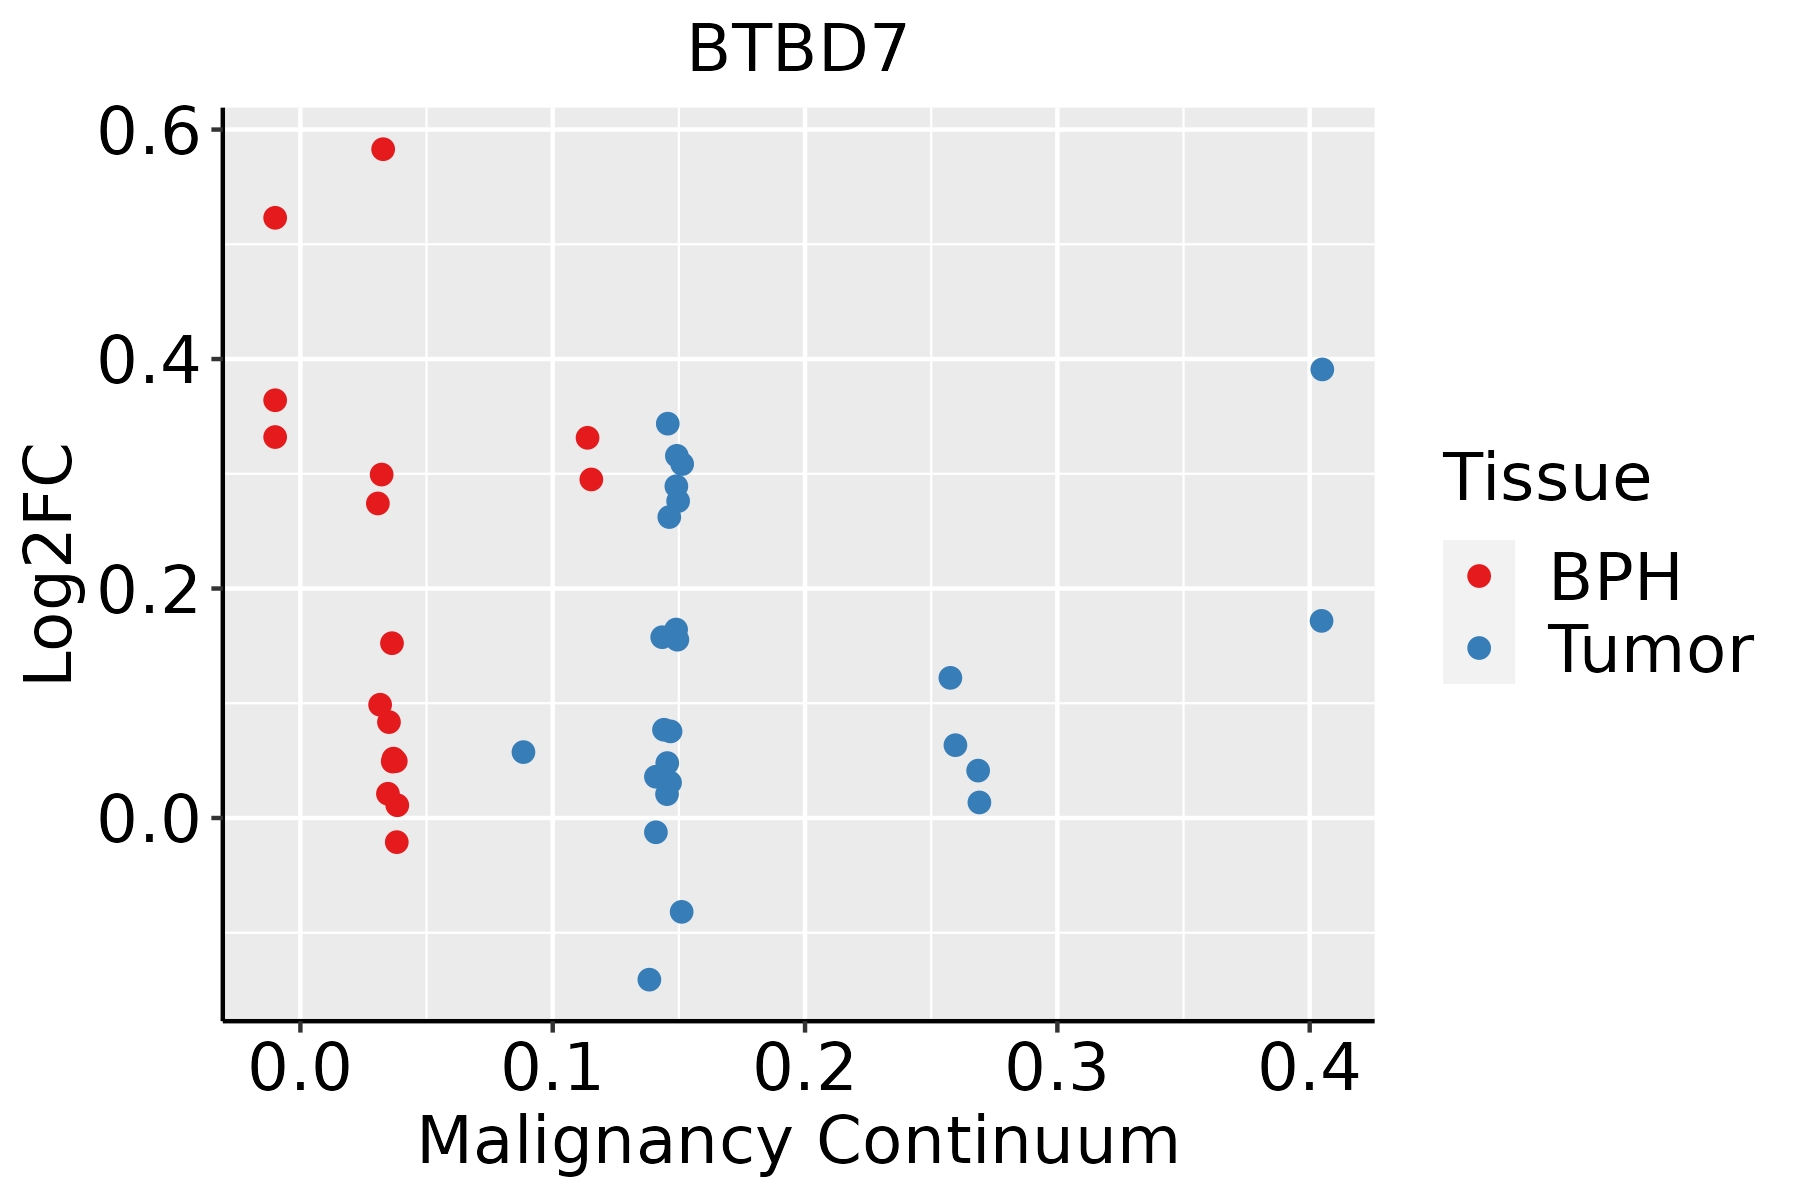 | BPH: Benign Prostatic Hyperplasia |
| Skin |  | AK: Actinic keratosis |
| cSCC: Cutaneous squamous cell carcinoma |
| SCCIS:squamous cell carcinoma in situ |
| Thyroid |  | ATC: Anaplastic thyroid cancer |
| HT: Hashimoto's thyroiditis |
| PTC: Papillary thyroid cancer |
| GO ID | Tissue | Disease Stage | Description | Gene Ratio | Bg Ratio | pvalue | p.adjust | Count |
| GO:0048732 | Colorectum | AD | gland development | 149/3918 | 436/18723 | 6.07e-11 | 6.33e-09 | 149 |
| GO:0022612 | Colorectum | AD | gland morphogenesis | 42/3918 | 118/18723 | 1.62e-04 | 2.23e-03 | 42 |
| GO:0001763 | Colorectum | AD | morphogenesis of a branching structure | 56/3918 | 196/18723 | 6.60e-03 | 4.09e-02 | 56 |
| GO:00487322 | Colorectum | MSS | gland development | 143/3467 | 436/18723 | 3.85e-13 | 8.01e-11 | 143 |
| GO:00226122 | Colorectum | MSS | gland morphogenesis | 41/3467 | 118/18723 | 2.02e-05 | 4.30e-04 | 41 |
| GO:00017631 | Colorectum | MSS | morphogenesis of a branching structure | 55/3467 | 196/18723 | 6.70e-04 | 7.25e-03 | 55 |
| GO:0061138 | Colorectum | MSS | morphogenesis of a branching epithelium | 51/3467 | 182/18723 | 1.06e-03 | 1.05e-02 | 51 |
| GO:00487324 | Colorectum | FAP | gland development | 103/2622 | 436/18723 | 3.61e-08 | 3.12e-06 | 103 |
| GO:00226123 | Colorectum | FAP | gland morphogenesis | 34/2622 | 118/18723 | 2.13e-05 | 5.12e-04 | 34 |
| GO:00017632 | Colorectum | FAP | morphogenesis of a branching structure | 44/2622 | 196/18723 | 8.79e-04 | 9.01e-03 | 44 |
| GO:0060688 | Colorectum | FAP | regulation of morphogenesis of a branching structure | 15/2622 | 50/18723 | 2.68e-03 | 2.08e-02 | 15 |
| GO:00611381 | Colorectum | FAP | morphogenesis of a branching epithelium | 39/2622 | 182/18723 | 3.98e-03 | 2.76e-02 | 39 |
| GO:00487325 | Colorectum | CRC | gland development | 88/2078 | 436/18723 | 1.62e-08 | 2.79e-06 | 88 |
| GO:00226124 | Colorectum | CRC | gland morphogenesis | 29/2078 | 118/18723 | 2.74e-05 | 7.49e-04 | 29 |
| GO:00606881 | Colorectum | CRC | regulation of morphogenesis of a branching structure | 14/2078 | 50/18723 | 8.08e-04 | 1.02e-02 | 14 |
| GO:00017633 | Colorectum | CRC | morphogenesis of a branching structure | 36/2078 | 196/18723 | 1.64e-03 | 1.70e-02 | 36 |
| GO:2000027 | Colorectum | CRC | regulation of animal organ morphogenesis | 24/2078 | 125/18723 | 5.12e-03 | 3.92e-02 | 24 |
| GO:0010498111 | Esophagus | ESCC | proteasomal protein catabolic process | 369/8552 | 490/18723 | 1.13e-41 | 1.80e-38 | 369 |
| GO:0043161111 | Esophagus | ESCC | proteasome-mediated ubiquitin-dependent protein catabolic process | 312/8552 | 412/18723 | 3.53e-36 | 4.48e-33 | 312 |
| GO:000020917 | Esophagus | ESCC | protein polyubiquitination | 170/8552 | 236/18723 | 1.40e-16 | 1.09e-14 | 170 |
| Hugo Symbol | Variant Class | Variant Classification | dbSNP RS | HGVSc | HGVSp | HGVSp Short | SWISSPROT | BIOTYPE | SIFT | PolyPhen | Tumor Sample Barcode | Tissue | Histology | Sex | Age | Stage | Therapy Types | Drugs | Outcome |
| BTBD7 | SNV | Missense_Mutation | novel | c.2414N>A | p.Arg805Lys | p.R805K | Q9P203 | protein_coding | tolerated_low_confidence(0.24) | benign(0) | TCGA-3C-AALI-01 | Breast | breast invasive carcinoma | Female | <65 | I/II | Unspecific | Poly E | Complete Response |
| BTBD7 | SNV | Missense_Mutation | | c.3331G>A | p.Asp1111Asn | p.D1111N | Q9P203 | protein_coding | tolerated_low_confidence(0.08) | benign(0.18) | TCGA-A8-A09Z-01 | Breast | breast invasive carcinoma | Female | >=65 | I/II | Unknown | Unknown | SD |
| BTBD7 | SNV | Missense_Mutation | rs146101449 | c.2072N>A | p.Arg691Gln | p.R691Q | Q9P203 | protein_coding | deleterious(0) | probably_damaging(0.978) | TCGA-AC-A23H-01 | Breast | breast invasive carcinoma | Female | >=65 | I/II | Unknown | Unknown | PD |
| BTBD7 | SNV | Missense_Mutation | | c.1853N>G | p.Ala618Gly | p.A618G | Q9P203 | protein_coding | tolerated(0.08) | probably_damaging(0.978) | TCGA-AN-A0FX-01 | Breast | breast invasive carcinoma | Female | <65 | I/II | Unknown | Unknown | SD |
| BTBD7 | SNV | Missense_Mutation | | c.1462N>C | p.Ser488Arg | p.S488R | Q9P203 | protein_coding | deleterious(0) | probably_damaging(0.999) | TCGA-C8-A12P-01 | Breast | breast invasive carcinoma | Female | <65 | I/II | Unknown | Unknown | SD |
| BTBD7 | SNV | Missense_Mutation | | c.2995N>T | p.Pro999Ser | p.P999S | Q9P203 | protein_coding | tolerated_low_confidence(0.12) | benign(0.033) | TCGA-D8-A147-01 | Breast | breast invasive carcinoma | Female | <65 | I/II | Chemotherapy | doxorubicine | SD |
| BTBD7 | insertion | In_Frame_Ins | novel | c.815_816insCTCCCACAAGAATTATATTAG | p.Glu272delinsAspSerHisLysAsnTyrIleArg | p.E272delinsDSHKNYIR | Q9P203 | protein_coding | | | TCGA-A8-A09M-01 | Breast | breast invasive carcinoma | Female | >=65 | III/IV | Chemotherapy | paclitaxel | CR |
| BTBD7 | SNV | Missense_Mutation | rs61747488 | c.1075N>A | p.Ala359Thr | p.A359T | Q9P203 | protein_coding | tolerated(0.43) | benign(0.014) | TCGA-2W-A8YY-01 | Cervix | cervical & endocervical cancer | Female | <65 | I/II | Chemotherapy | cisplatin | CR |
| BTBD7 | SNV | Missense_Mutation | | c.2828N>T | p.Pro943Leu | p.P943L | Q9P203 | protein_coding | deleterious_low_confidence(0) | probably_damaging(0.998) | TCGA-EK-A2R7-01 | Cervix | cervical & endocervical cancer | Female | <65 | I/II | Unknown | Unknown | SD |
| BTBD7 | SNV | Missense_Mutation | | c.1765G>C | p.Glu589Gln | p.E589Q | Q9P203 | protein_coding | deleterious(0.02) | probably_damaging(0.979) | TCGA-IR-A3LK-01 | Cervix | cervical & endocervical cancer | Female | >=65 | I/II | Chemotherapy | cisplatin | PD |


