
|
|||||
|
 | |
| |
| |
| |
| |
| |
|
Gene: BTBD6 |
Gene summary for BTBD6 |
| Gene information | Species | Human | Gene symbol | BTBD6 | Gene ID | 90135 |
| Gene name | BTB domain containing 6 | |
| Gene Alias | BDPL | |
| Cytomap | 14q32.33 | |
| Gene Type | protein-coding | GO ID | GO:0007275 | UniProtAcc | Q96KE9 |
Top |
Malignant transformation analysis |
| Identification of the aberrant gene expression in precancerous and cancerous lesions by comparing the gene expression of stem-like cells in diseased tissues with normal stem cells |
| Entrez ID | Symbol | Replicates | Species | Organ | Tissue | Adj P-value | Log2FC | Malignancy |
| 90135 | BTBD6 | HTA11_3410_2000001011 | Human | Colorectum | AD | 5.59e-06 | 2.74e-01 | 0.0155 |
| 90135 | BTBD6 | HTA11_2487_2000001011 | Human | Colorectum | SER | 1.63e-09 | 4.65e-01 | -0.1808 |
| 90135 | BTBD6 | HTA11_2951_2000001011 | Human | Colorectum | AD | 7.99e-03 | 3.74e-01 | 0.0216 |
| 90135 | BTBD6 | HTA11_1938_2000001011 | Human | Colorectum | AD | 1.16e-09 | 4.58e-01 | -0.0811 |
| 90135 | BTBD6 | HTA11_78_2000001011 | Human | Colorectum | AD | 3.95e-12 | 5.27e-01 | -0.1088 |
| 90135 | BTBD6 | HTA11_347_2000001011 | Human | Colorectum | AD | 5.48e-20 | 5.06e-01 | -0.1954 |
| 90135 | BTBD6 | HTA11_2112_2000001011 | Human | Colorectum | SER | 8.64e-04 | 5.44e-01 | -0.2196 |
| 90135 | BTBD6 | HTA11_3361_2000001011 | Human | Colorectum | AD | 2.19e-07 | 5.23e-01 | -0.1207 |
| 90135 | BTBD6 | HTA11_83_2000001011 | Human | Colorectum | SER | 1.11e-05 | 3.90e-01 | -0.1526 |
| 90135 | BTBD6 | HTA11_696_2000001011 | Human | Colorectum | AD | 1.91e-14 | 3.58e-01 | -0.1464 |
| 90135 | BTBD6 | HTA11_866_2000001011 | Human | Colorectum | AD | 1.33e-15 | 3.67e-01 | -0.1001 |
| 90135 | BTBD6 | HTA11_1391_2000001011 | Human | Colorectum | AD | 1.27e-16 | 5.80e-01 | -0.059 |
| 90135 | BTBD6 | HTA11_2992_2000001011 | Human | Colorectum | SER | 1.49e-05 | 4.65e-01 | -0.1706 |
| 90135 | BTBD6 | HTA11_5212_2000001011 | Human | Colorectum | AD | 2.81e-02 | 3.81e-01 | -0.2061 |
| 90135 | BTBD6 | HTA11_5216_2000001011 | Human | Colorectum | SER | 4.16e-04 | 4.74e-01 | -0.1462 |
| 90135 | BTBD6 | HTA11_546_2000001011 | Human | Colorectum | AD | 3.47e-04 | 4.14e-01 | -0.0842 |
| 90135 | BTBD6 | HTA11_7862_2000001011 | Human | Colorectum | AD | 5.66e-03 | 4.11e-01 | -0.0179 |
| 90135 | BTBD6 | HTA11_866_3004761011 | Human | Colorectum | AD | 7.36e-13 | 4.45e-01 | 0.096 |
| 90135 | BTBD6 | HTA11_8622_2000001021 | Human | Colorectum | SER | 8.31e-03 | 3.62e-01 | 0.0528 |
| 90135 | BTBD6 | HTA11_10711_2000001011 | Human | Colorectum | AD | 2.31e-05 | 3.22e-01 | 0.0338 |
| Page: 1 2 3 |
| Tissue | Expression Dynamics | Abbreviation |
| Colorectum (GSE201348) |  | FAP: Familial adenomatous polyposis |
| CRC: Colorectal cancer | ||
| Colorectum (HTA11) |  | AD: Adenomas |
| SER: Sessile serrated lesions | ||
| MSI-H: Microsatellite-high colorectal cancer | ||
| MSS: Microsatellite stable colorectal cancer | ||
| Oral Cavity | 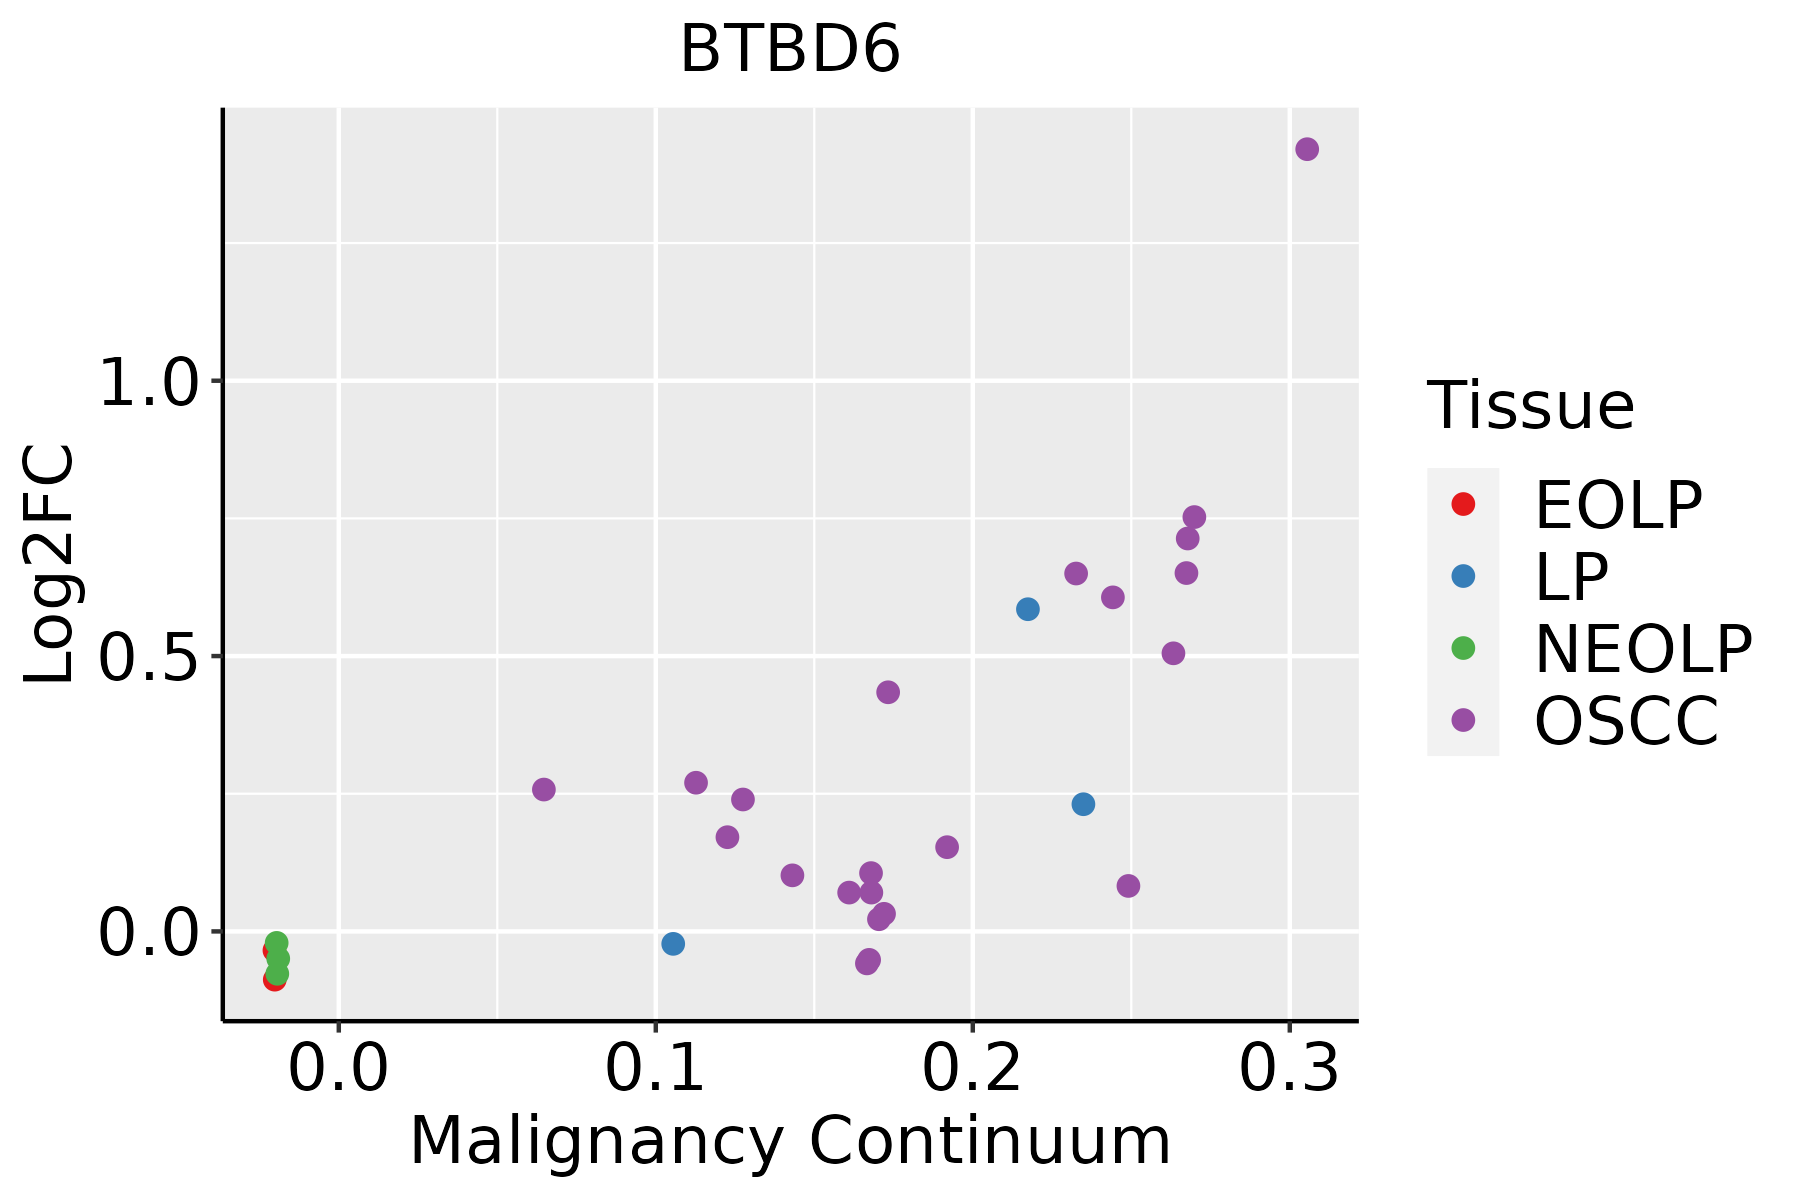 | EOLP: Erosive Oral lichen planus |
| LP: leukoplakia | ||
| NEOLP: Non-erosive oral lichen planus | ||
| OSCC: Oral squamous cell carcinoma | ||
| Thyroid | 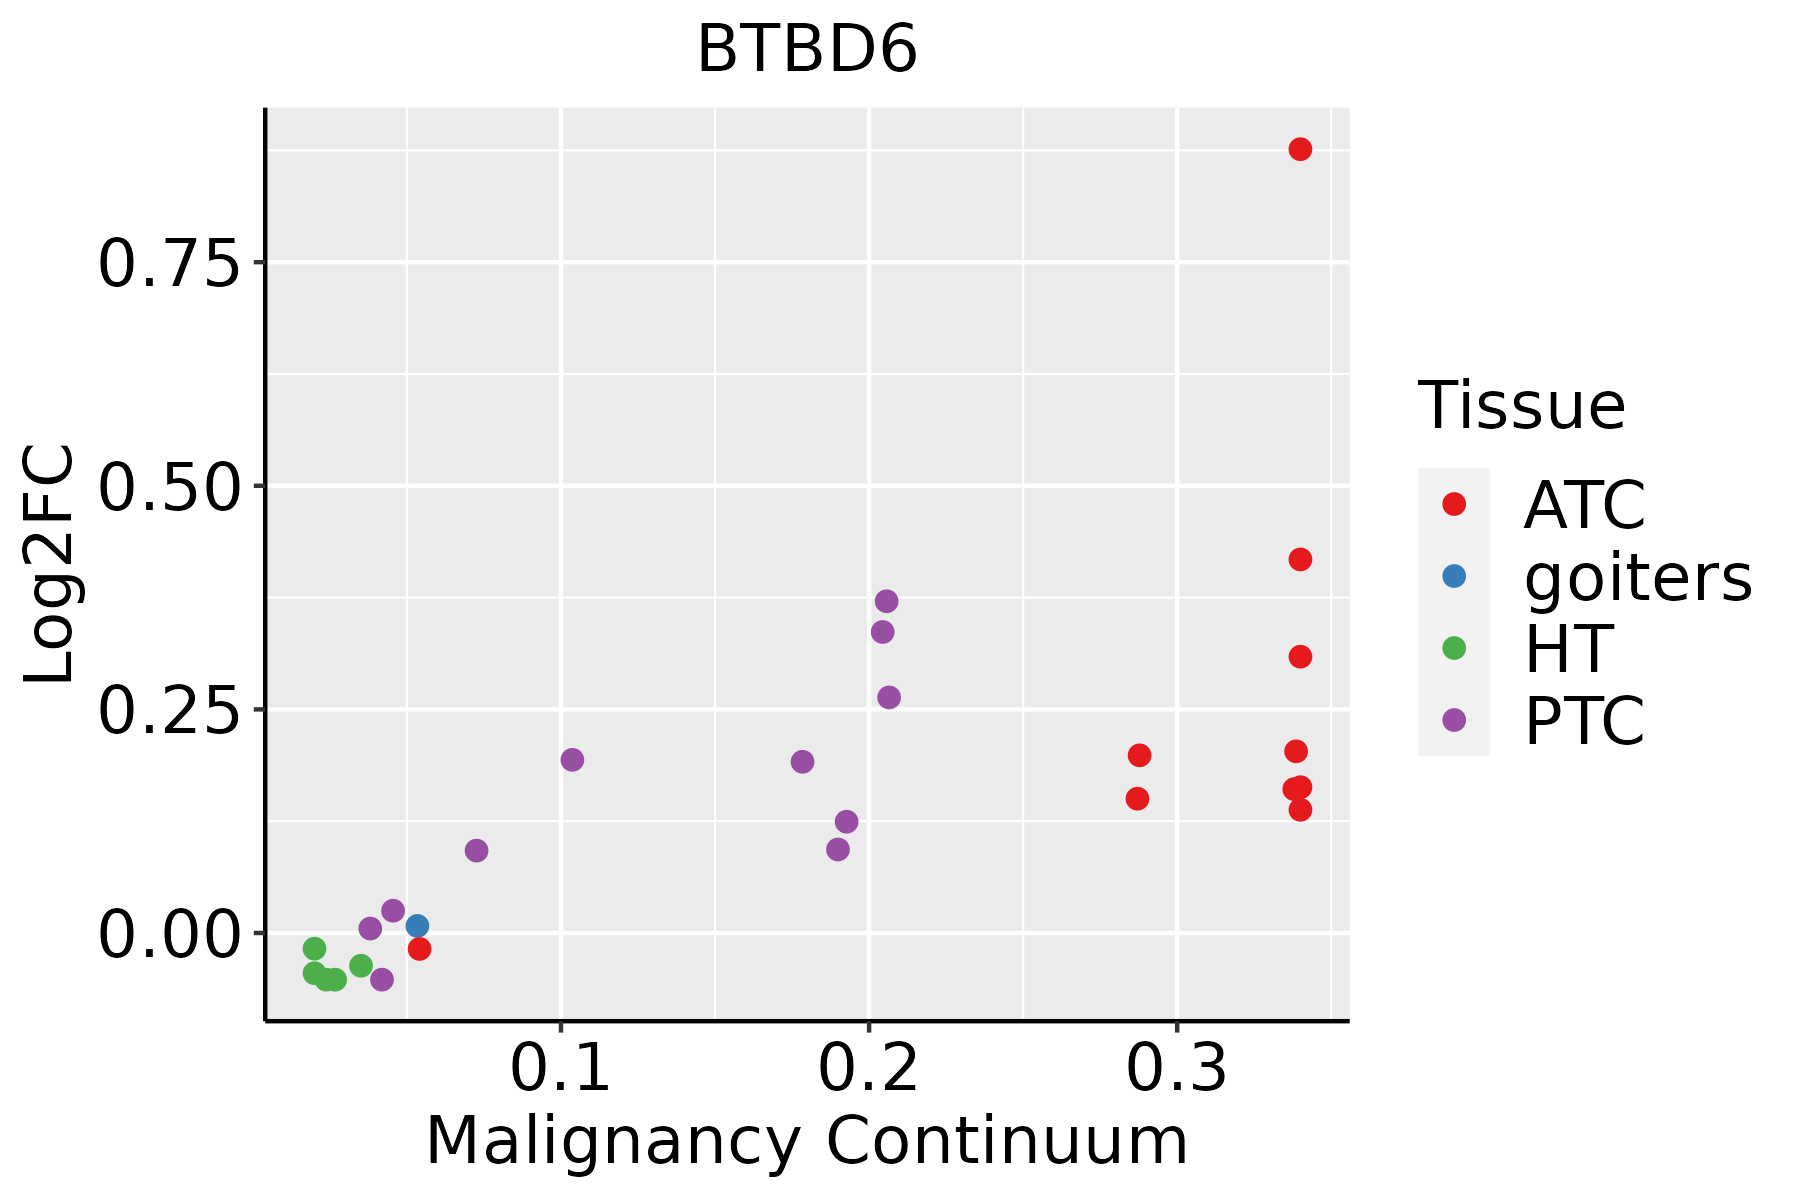 | ATC: Anaplastic thyroid cancer |
| HT: Hashimoto's thyroiditis | ||
| PTC: Papillary thyroid cancer |
| ∗log2FC in expression of this searched gene in stem-like cells from each diseased tissue sample relative to stem-like cells in normal samples in each tissue plotted against the malignancy continuum. Samples are colored based on if they are from different disease stage. |
Top |
Malignant transformation related pathway analysis |
| Find out the enriched GO biological processes and KEGG pathways involved in transition from healthy to precancer to cancer |
| Tissue | Disease Stage | Enriched GO biological Processes |
| Colorectum | AD |  |
| Colorectum | SER |  |
| Colorectum | MSS |  |
| Colorectum | MSI-H |  |
| Colorectum | FAP |  |
| ∗Top 15 enriched GO BP terms are showed in the bar plot of each disease state in each tissue. Each row represents a significant GO biological process which is colored according to the -log10(p.adjust). |
| Page: 1 2 3 4 5 6 7 8 9 |
| GO ID | Tissue | Disease Stage | Description | Gene Ratio | Bg Ratio | pvalue | p.adjust | Count |
| GO:0010498111 | Esophagus | ESCC | proteasomal protein catabolic process | 369/8552 | 490/18723 | 1.13e-41 | 1.80e-38 | 369 |
| GO:0043161111 | Esophagus | ESCC | proteasome-mediated ubiquitin-dependent protein catabolic process | 312/8552 | 412/18723 | 3.53e-36 | 4.48e-33 | 312 |
| GO:0035966111 | Esophagus | ESCC | response to topologically incorrect protein | 125/8552 | 159/18723 | 1.44e-17 | 1.27e-15 | 125 |
| GO:000020917 | Esophagus | ESCC | protein polyubiquitination | 170/8552 | 236/18723 | 1.40e-16 | 1.09e-14 | 170 |
| GO:0006986111 | Esophagus | ESCC | response to unfolded protein | 107/8552 | 137/18723 | 7.01e-15 | 3.87e-13 | 107 |
| GO:007093617 | Esophagus | ESCC | protein K48-linked ubiquitination | 55/8552 | 65/18723 | 8.42e-11 | 2.58e-09 | 55 |
| GO:000726510 | Esophagus | ESCC | Ras protein signal transduction | 201/8552 | 337/18723 | 1.44e-07 | 2.30e-06 | 201 |
| GO:00166019 | Esophagus | ESCC | Rac protein signal transduction | 33/8552 | 42/18723 | 1.35e-05 | 1.23e-04 | 33 |
| GO:0035020 | Esophagus | ESCC | regulation of Rac protein signal transduction | 17/8552 | 21/18723 | 1.03e-03 | 5.19e-03 | 17 |
| GO:00465789 | Esophagus | ESCC | regulation of Ras protein signal transduction | 106/8552 | 189/18723 | 2.49e-03 | 1.08e-02 | 106 |
| GO:005105610 | Esophagus | ESCC | regulation of small GTPase mediated signal transduction | 157/8552 | 302/18723 | 1.55e-02 | 4.98e-02 | 157 |
| GO:001049822 | Liver | HCC | proteasomal protein catabolic process | 351/7958 | 490/18723 | 6.92e-40 | 1.46e-36 | 351 |
| GO:004316122 | Liver | HCC | proteasome-mediated ubiquitin-dependent protein catabolic process | 299/7958 | 412/18723 | 7.82e-36 | 8.27e-33 | 299 |
| GO:003596612 | Liver | HCC | response to topologically incorrect protein | 123/7958 | 159/18723 | 2.60e-19 | 3.44e-17 | 123 |
| GO:000698612 | Liver | HCC | response to unfolded protein | 103/7958 | 137/18723 | 6.50e-15 | 4.48e-13 | 103 |
| GO:000020921 | Liver | HCC | protein polyubiquitination | 151/7958 | 236/18723 | 1.90e-11 | 7.59e-10 | 151 |
| GO:007093621 | Liver | HCC | protein K48-linked ubiquitination | 52/7958 | 65/18723 | 6.70e-10 | 2.11e-08 | 52 |
| GO:000726521 | Liver | HCC | Ras protein signal transduction | 187/7958 | 337/18723 | 8.89e-07 | 1.35e-05 | 187 |
| GO:001660121 | Liver | HCC | Rac protein signal transduction | 28/7958 | 42/18723 | 1.35e-03 | 7.26e-03 | 28 |
| GO:004657811 | Liver | HCC | regulation of Ras protein signal transduction | 100/7958 | 189/18723 | 2.42e-03 | 1.18e-02 | 100 |
| Page: 1 |
| Pathway ID | Tissue | Disease Stage | Description | Gene Ratio | Bg Ratio | pvalue | p.adjust | qvalue | Count |
| Page: 1 |
Top |
Cell-cell communication analysis |
| Identification of potential cell-cell interactions between two cell types and their ligand-receptor pairs for different disease states |
| Ligand | Receptor | LRpair | Pathway | Tissue | Disease Stage |
| Page: 1 |
Top |
Single-cell gene regulatory network inference analysis |
| Find out the significant the regulons (TFs) and the target genes of each regulon across cell types for different disease states |
| TF | Cell Type | Tissue | Disease Stage | Target Gene | RSS | Regulon Activity |
| ∗The dot plots of a searched regulon are shown for all cell subpopulations in each disease state of each tissue based on the regulon specific score inferred using pySCENIC and by calculating the average expression. |
| Page: 1 |
Top |
Somatic mutation of malignant transformation related genes |
| Annotation of somatic variants for genes involved in malignant transformation |
| Hugo Symbol | Variant Class | Variant Classification | dbSNP RS | HGVSc | HGVSp | HGVSp Short | SWISSPROT | BIOTYPE | SIFT | PolyPhen | Tumor Sample Barcode | Tissue | Histology | Sex | Age | Stage | Therapy Types | Drugs | Outcome |
| BTBD6 | SNV | Missense_Mutation | c.1031C>T | p.Ser344Phe | p.S344F | Q96KE9 | protein_coding | tolerated(0.19) | probably_damaging(0.934) | TCGA-GM-A2D9-01 | Breast | breast invasive carcinoma | Female | >=65 | I/II | Hormone Therapy | arimidex | SD | |
| BTBD6 | SNV | Missense_Mutation | rs775849620 | c.1055N>A | p.Arg352Gln | p.R352Q | Q96KE9 | protein_coding | tolerated(0.08) | benign(0.248) | TCGA-2W-A8YY-01 | Cervix | cervical & endocervical cancer | Female | <65 | I/II | Chemotherapy | cisplatin | CR |
| BTBD6 | SNV | Missense_Mutation | rs747308975 | c.1312N>A | p.Gly438Ser | p.G438S | Q96KE9 | protein_coding | deleterious(0.03) | probably_damaging(1) | TCGA-AD-6889-01 | Colorectum | colon adenocarcinoma | Male | >=65 | I/II | Chemotherapy | xeloda | PD |
| BTBD6 | SNV | Missense_Mutation | c.583A>T | p.Ser195Cys | p.S195C | Q96KE9 | protein_coding | deleterious(0) | probably_damaging(0.999) | TCGA-QG-A5Z2-01 | Colorectum | colon adenocarcinoma | Male | <65 | I/II | Unknown | Unknown | SD | |
| BTBD6 | SNV | Missense_Mutation | novel | c.1072G>A | p.Asp358Asn | p.D358N | Q96KE9 | protein_coding | deleterious(0.01) | possibly_damaging(0.858) | TCGA-A5-A0G2-01 | Endometrium | uterine corpus endometrioid carcinoma | Female | <65 | III/IV | Unknown | Unknown | SD |
| BTBD6 | SNV | Missense_Mutation | c.1262C>T | p.Pro421Leu | p.P421L | Q96KE9 | protein_coding | tolerated(0.06) | probably_damaging(0.995) | TCGA-A5-A0VP-01 | Endometrium | uterine corpus endometrioid carcinoma | Female | >=65 | I/II | Unknown | Unknown | SD | |
| BTBD6 | SNV | Missense_Mutation | novel | c.707T>C | p.Val236Ala | p.V236A | Q96KE9 | protein_coding | deleterious(0) | benign(0.393) | TCGA-A5-A1OF-01 | Endometrium | uterine corpus endometrioid carcinoma | Female | <65 | I/II | Unknown | Unknown | SD |
| BTBD6 | SNV | Missense_Mutation | novel | c.637N>A | p.Ala213Thr | p.A213T | Q96KE9 | protein_coding | tolerated(0.07) | possibly_damaging(0.552) | TCGA-AJ-A3EK-01 | Endometrium | uterine corpus endometrioid carcinoma | Female | <65 | I/II | Chemotherapy | carboplatin | CR |
| BTBD6 | SNV | Missense_Mutation | c.1083G>T | p.Gln361His | p.Q361H | Q96KE9 | protein_coding | deleterious(0) | probably_damaging(0.992) | TCGA-AP-A051-01 | Endometrium | uterine corpus endometrioid carcinoma | Female | >=65 | I/II | Unknown | Unknown | SD | |
| BTBD6 | SNV | Missense_Mutation | c.737N>T | p.Ala246Val | p.A246V | Q96KE9 | protein_coding | tolerated(1) | benign(0.009) | TCGA-AP-A054-01 | Endometrium | uterine corpus endometrioid carcinoma | Female | <65 | III/IV | Chemotherapy | carboplatin | PD |
| Page: 1 2 3 4 |
Top |
Related drugs of malignant transformation related genes |
| Identification of chemicals and drugs interact with genes involved in malignant transfromation |
| (DGIdb 4.0) |
| Entrez ID | Symbol | Category | Interaction Types | Drug Claim Name | Drug Name | PMIDs |
| Page: 1 |

Copyright 2023-Present -The University of Texas Health Science Center at Houston |