
|
|||||
|
 | |
| |
| |
| |
| |
| |
|
Gene: BTBD10 |
Gene summary for BTBD10 |
| Gene information | Species | Human | Gene symbol | BTBD10 | Gene ID | 84280 |
| Gene name | BTB domain containing 10 | |
| Gene Alias | GMRP-1 | |
| Cytomap | 11p15.3 | |
| Gene Type | protein-coding | GO ID | GO:0006793 | UniProtAcc | B7Z503 |
Top |
Malignant transformation analysis |
| Identification of the aberrant gene expression in precancerous and cancerous lesions by comparing the gene expression of stem-like cells in diseased tissues with normal stem cells |
| Entrez ID | Symbol | Replicates | Species | Organ | Tissue | Adj P-value | Log2FC | Malignancy |
| 84280 | BTBD10 | HTA11_3410_2000001011 | Human | Colorectum | AD | 1.90e-06 | -4.43e-01 | 0.0155 |
| 84280 | BTBD10 | HTA11_3361_2000001011 | Human | Colorectum | AD | 2.16e-03 | -4.99e-01 | -0.1207 |
| 84280 | BTBD10 | HTA11_696_2000001011 | Human | Colorectum | AD | 3.83e-03 | -3.39e-01 | -0.1464 |
| 84280 | BTBD10 | HTA11_866_3004761011 | Human | Colorectum | AD | 3.76e-05 | -4.38e-01 | 0.096 |
| 84280 | BTBD10 | HTA11_7696_3000711011 | Human | Colorectum | AD | 1.87e-07 | -4.24e-01 | 0.0674 |
| 84280 | BTBD10 | HTA11_99999970781_79442 | Human | Colorectum | MSS | 1.30e-05 | -3.47e-01 | 0.294 |
| 84280 | BTBD10 | HTA11_99999971662_82457 | Human | Colorectum | MSS | 1.00e-06 | -3.91e-01 | 0.3859 |
| 84280 | BTBD10 | HTA11_99999974143_84620 | Human | Colorectum | MSS | 1.00e-15 | -5.11e-01 | 0.3005 |
| 84280 | BTBD10 | A002-C-010 | Human | Colorectum | FAP | 2.22e-04 | -2.28e-01 | 0.242 |
| 84280 | BTBD10 | A001-C-207 | Human | Colorectum | FAP | 5.87e-03 | -2.27e-01 | 0.1278 |
| 84280 | BTBD10 | A015-C-203 | Human | Colorectum | FAP | 6.39e-20 | -3.10e-01 | -0.1294 |
| 84280 | BTBD10 | A015-C-204 | Human | Colorectum | FAP | 3.38e-03 | -1.38e-01 | -0.0228 |
| 84280 | BTBD10 | A002-C-201 | Human | Colorectum | FAP | 5.64e-08 | -2.53e-01 | 0.0324 |
| 84280 | BTBD10 | A002-C-203 | Human | Colorectum | FAP | 2.02e-02 | -1.82e-01 | 0.2786 |
| 84280 | BTBD10 | A001-C-119 | Human | Colorectum | FAP | 1.77e-03 | -3.80e-01 | -0.1557 |
| 84280 | BTBD10 | A001-C-108 | Human | Colorectum | FAP | 1.62e-10 | -2.61e-01 | -0.0272 |
| 84280 | BTBD10 | A002-C-205 | Human | Colorectum | FAP | 5.03e-13 | -3.68e-01 | -0.1236 |
| 84280 | BTBD10 | A001-C-104 | Human | Colorectum | FAP | 5.01e-04 | -2.89e-01 | 0.0184 |
| 84280 | BTBD10 | A015-C-005 | Human | Colorectum | FAP | 7.12e-04 | -3.33e-01 | -0.0336 |
| 84280 | BTBD10 | A015-C-006 | Human | Colorectum | FAP | 9.15e-09 | -4.09e-01 | -0.0994 |
| Page: 1 2 3 4 5 6 |
| Tissue | Expression Dynamics | Abbreviation |
| Colorectum (GSE201348) |  | FAP: Familial adenomatous polyposis |
| CRC: Colorectal cancer | ||
| Colorectum (HTA11) |  | AD: Adenomas |
| SER: Sessile serrated lesions | ||
| MSI-H: Microsatellite-high colorectal cancer | ||
| MSS: Microsatellite stable colorectal cancer | ||
| Esophagus |  | ESCC: Esophageal squamous cell carcinoma |
| HGIN: High-grade intraepithelial neoplasias | ||
| LGIN: Low-grade intraepithelial neoplasias | ||
| Oral Cavity | 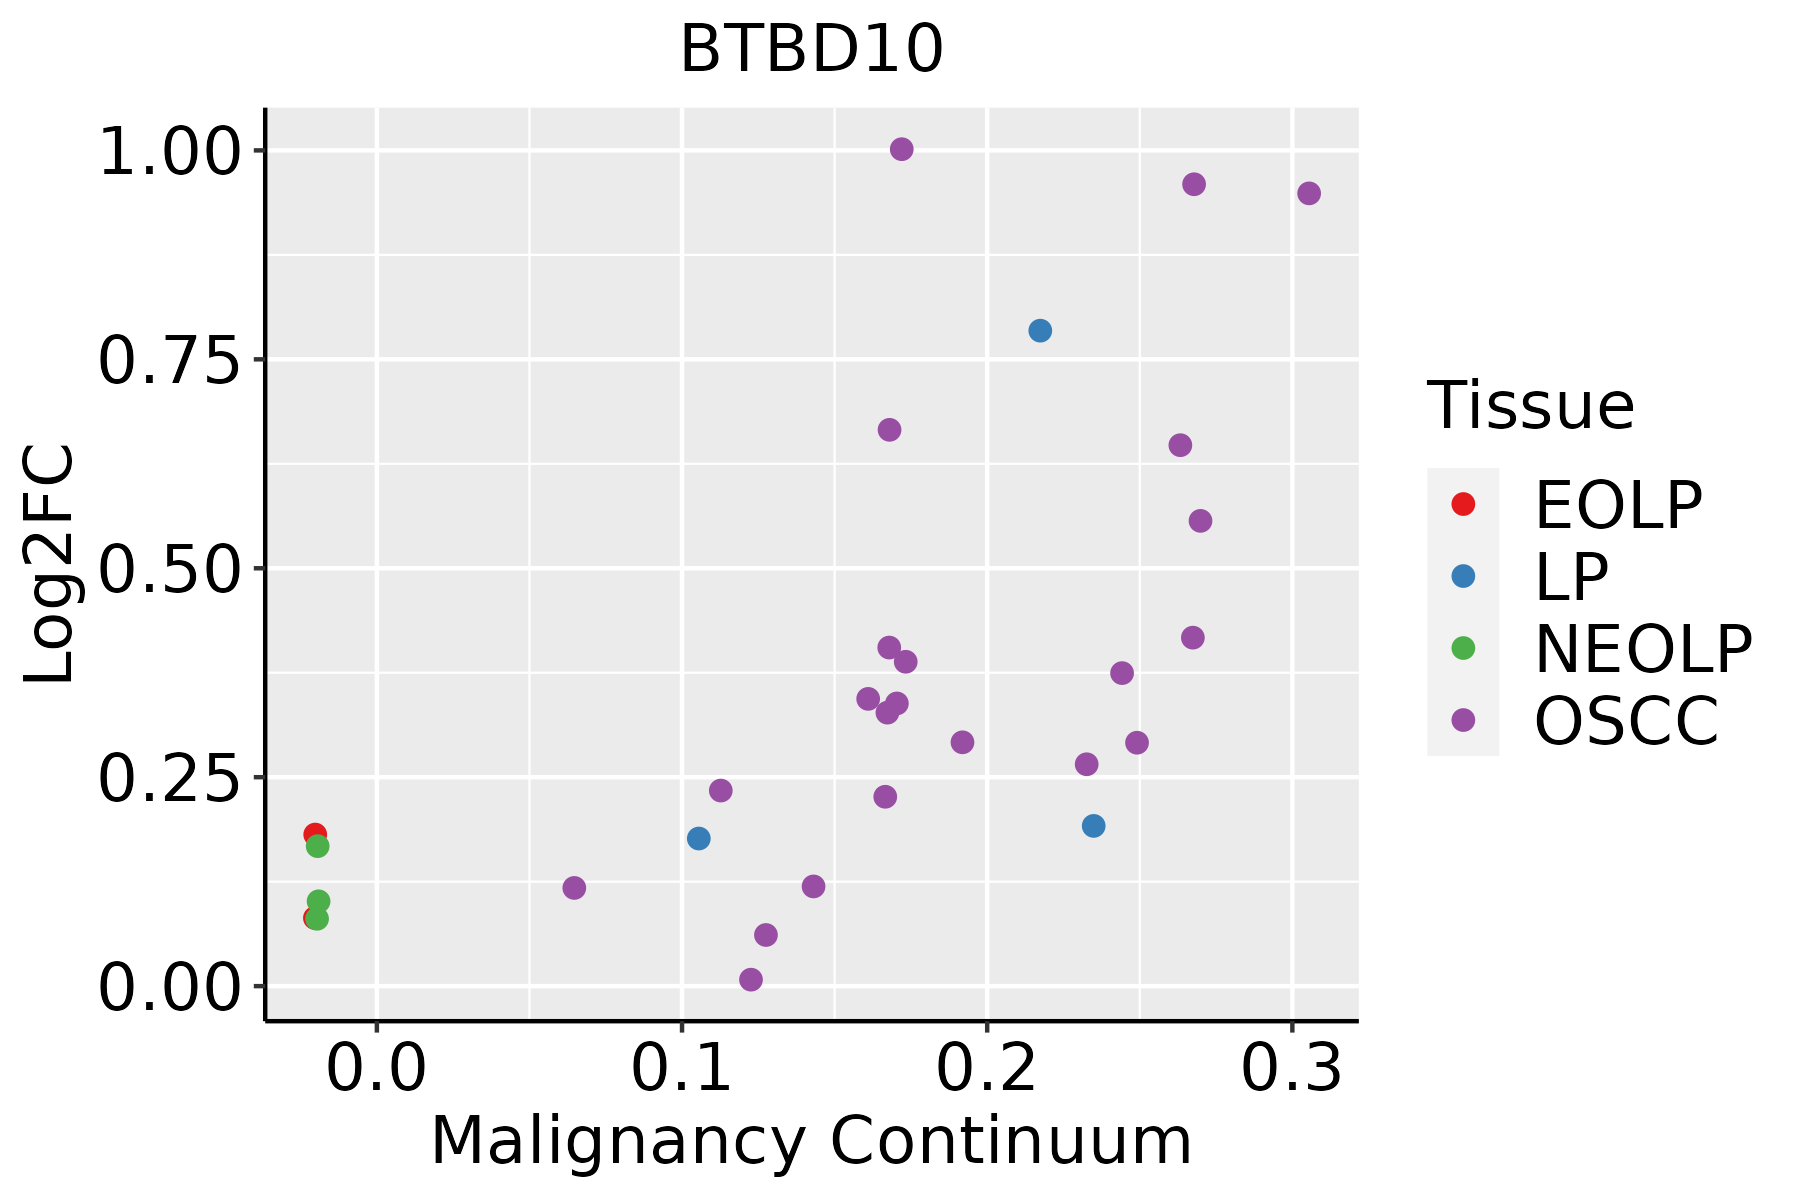 | EOLP: Erosive Oral lichen planus |
| LP: leukoplakia | ||
| NEOLP: Non-erosive oral lichen planus | ||
| OSCC: Oral squamous cell carcinoma | ||
| Skin | 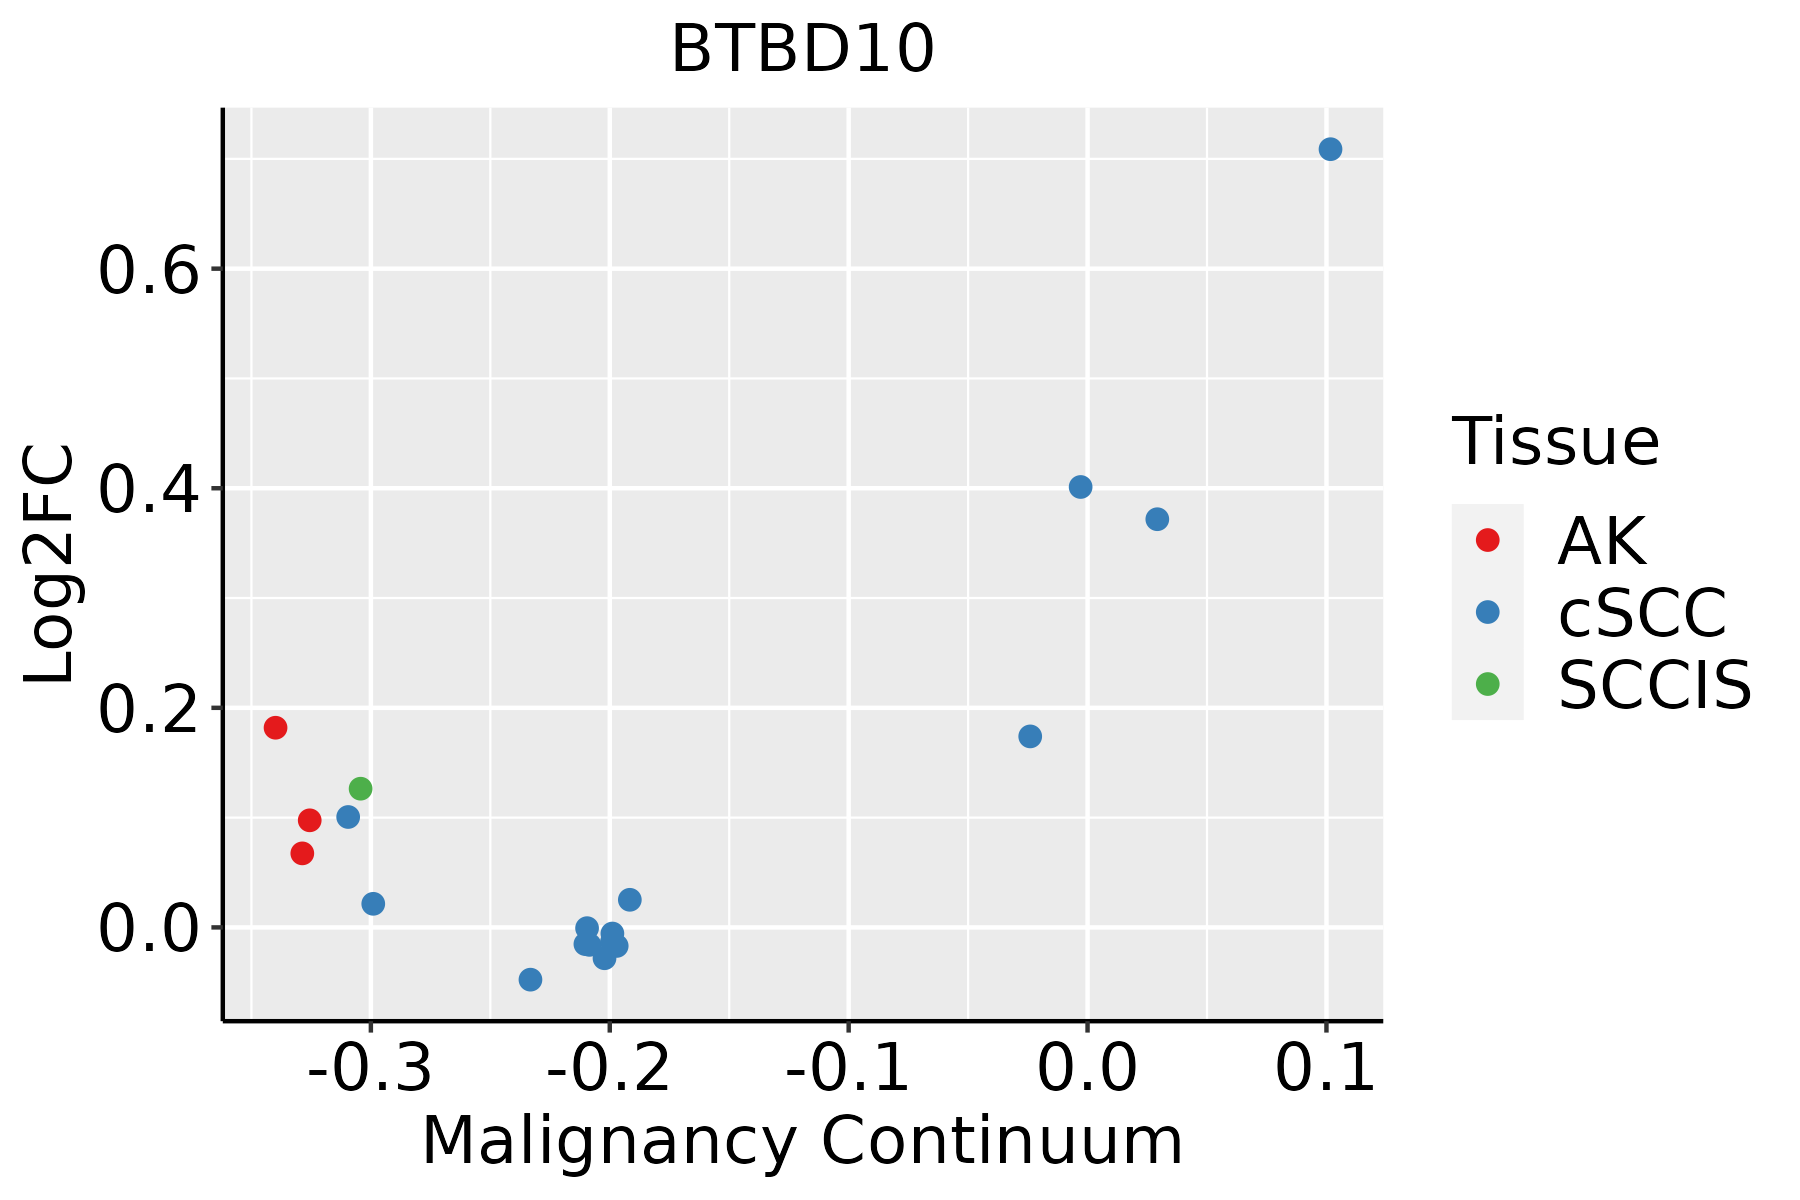 | AK: Actinic keratosis |
| cSCC: Cutaneous squamous cell carcinoma | ||
| SCCIS:squamous cell carcinoma in situ |
| ∗log2FC in expression of this searched gene in stem-like cells from each diseased tissue sample relative to stem-like cells in normal samples in each tissue plotted against the malignancy continuum. Samples are colored based on if they are from different disease stage. |
Top |
Malignant transformation related pathway analysis |
| Find out the enriched GO biological processes and KEGG pathways involved in transition from healthy to precancer to cancer |
| Tissue | Disease Stage | Enriched GO biological Processes |
| Colorectum | AD |  |
| Colorectum | SER |  |
| Colorectum | MSS |  |
| Colorectum | MSI-H |  |
| Colorectum | FAP |  |
| ∗Top 15 enriched GO BP terms are showed in the bar plot of each disease state in each tissue. Each row represents a significant GO biological process which is colored according to the -log10(p.adjust). |
| Page: 1 2 3 4 5 6 7 8 9 |
| GO ID | Tissue | Disease Stage | Description | Gene Ratio | Bg Ratio | pvalue | p.adjust | Count |
| GO:0070997 | Colorectum | AD | neuron death | 114/3918 | 361/18723 | 1.13e-06 | 3.72e-05 | 114 |
| GO:1901214 | Colorectum | AD | regulation of neuron death | 99/3918 | 319/18723 | 1.26e-05 | 2.76e-04 | 99 |
| GO:1901215 | Colorectum | AD | negative regulation of neuron death | 67/3918 | 208/18723 | 8.81e-05 | 1.35e-03 | 67 |
| GO:0050673 | Colorectum | AD | epithelial cell proliferation | 119/3918 | 437/18723 | 8.75e-04 | 8.51e-03 | 119 |
| GO:00709972 | Colorectum | MSS | neuron death | 97/3467 | 361/18723 | 5.21e-05 | 9.31e-04 | 97 |
| GO:19012142 | Colorectum | MSS | regulation of neuron death | 83/3467 | 319/18723 | 5.28e-04 | 5.99e-03 | 83 |
| GO:00506731 | Colorectum | MSS | epithelial cell proliferation | 108/3467 | 437/18723 | 6.76e-04 | 7.30e-03 | 108 |
| GO:19012152 | Colorectum | MSS | negative regulation of neuron death | 53/3467 | 208/18723 | 7.60e-03 | 4.77e-02 | 53 |
| GO:00709974 | Colorectum | FAP | neuron death | 81/2622 | 361/18723 | 8.35e-06 | 2.46e-04 | 81 |
| GO:19012144 | Colorectum | FAP | regulation of neuron death | 67/2622 | 319/18723 | 3.73e-04 | 4.63e-03 | 67 |
| GO:19012153 | Colorectum | FAP | negative regulation of neuron death | 46/2622 | 208/18723 | 9.52e-04 | 9.42e-03 | 46 |
| GO:00506732 | Colorectum | FAP | epithelial cell proliferation | 84/2622 | 437/18723 | 1.39e-03 | 1.25e-02 | 84 |
| GO:00709975 | Colorectum | CRC | neuron death | 65/2078 | 361/18723 | 5.55e-05 | 1.26e-03 | 65 |
| GO:19012154 | Colorectum | CRC | negative regulation of neuron death | 41/2078 | 208/18723 | 1.79e-04 | 3.17e-03 | 41 |
| GO:19012145 | Colorectum | CRC | regulation of neuron death | 57/2078 | 319/18723 | 1.90e-04 | 3.30e-03 | 57 |
| GO:00506733 | Colorectum | CRC | epithelial cell proliferation | 69/2078 | 437/18723 | 1.61e-03 | 1.69e-02 | 69 |
| GO:0070997111 | Esophagus | ESCC | neuron death | 216/8552 | 361/18723 | 3.49e-08 | 6.45e-07 | 216 |
| GO:1901214111 | Esophagus | ESCC | regulation of neuron death | 186/8552 | 319/18723 | 3.35e-06 | 3.73e-05 | 186 |
| GO:005067318 | Esophagus | ESCC | epithelial cell proliferation | 238/8552 | 437/18723 | 1.19e-04 | 8.20e-04 | 238 |
| GO:190121516 | Esophagus | ESCC | negative regulation of neuron death | 115/8552 | 208/18723 | 3.24e-03 | 1.34e-02 | 115 |
| Page: 1 2 |
| Pathway ID | Tissue | Disease Stage | Description | Gene Ratio | Bg Ratio | pvalue | p.adjust | qvalue | Count |
| Page: 1 |
Top |
Cell-cell communication analysis |
| Identification of potential cell-cell interactions between two cell types and their ligand-receptor pairs for different disease states |
| Ligand | Receptor | LRpair | Pathway | Tissue | Disease Stage |
| Page: 1 |
Top |
Single-cell gene regulatory network inference analysis |
| Find out the significant the regulons (TFs) and the target genes of each regulon across cell types for different disease states |
| TF | Cell Type | Tissue | Disease Stage | Target Gene | RSS | Regulon Activity |
| ∗The dot plots of a searched regulon are shown for all cell subpopulations in each disease state of each tissue based on the regulon specific score inferred using pySCENIC and by calculating the average expression. |
| Page: 1 |
Top |
Somatic mutation of malignant transformation related genes |
| Annotation of somatic variants for genes involved in malignant transformation |
| Hugo Symbol | Variant Class | Variant Classification | dbSNP RS | HGVSc | HGVSp | HGVSp Short | SWISSPROT | BIOTYPE | SIFT | PolyPhen | Tumor Sample Barcode | Tissue | Histology | Sex | Age | Stage | Therapy Types | Drugs | Outcome |
| BTBD10 | SNV | Missense_Mutation | rs760524210 | c.218G>A | p.Arg73Gln | p.R73Q | Q9BSF8 | protein_coding | tolerated_low_confidence(0.07) | possibly_damaging(0.836) | TCGA-BH-A0W7-01 | Breast | breast invasive carcinoma | Female | <65 | I/II | Chemotherapy | taxotere | CR |
| BTBD10 | SNV | Missense_Mutation | c.1426N>T | p.Pro476Ser | p.P476S | Q9BSF8 | protein_coding | deleterious_low_confidence(0.04) | benign(0) | TCGA-E2-A15S-01 | Breast | breast invasive carcinoma | Female | <65 | I/II | Chemotherapy | doxorubicin | SD | |
| BTBD10 | SNV | Missense_Mutation | novel | c.704N>A | p.Ala235Glu | p.A235E | Q9BSF8 | protein_coding | deleterious(0) | probably_damaging(0.94) | TCGA-OL-A6VO-01 | Breast | breast invasive carcinoma | Female | <65 | I/II | Chemotherapy | taxotere | CR |
| BTBD10 | SNV | Missense_Mutation | rs771981722 | c.565G>C | p.Asp189His | p.D189H | Q9BSF8 | protein_coding | deleterious(0) | probably_damaging(0.991) | TCGA-C5-A1BM-01 | Cervix | cervical & endocervical cancer | Female | >=65 | I/II | Unknown | Unknown | SD |
| BTBD10 | SNV | Missense_Mutation | novel | c.1375N>A | p.Glu459Lys | p.E459K | Q9BSF8 | protein_coding | tolerated(0.06) | possibly_damaging(0.79) | TCGA-C5-A2LZ-01 | Cervix | cervical & endocervical cancer | Female | >=65 | III/IV | Unknown | Unknown | PD |
| BTBD10 | SNV | Missense_Mutation | novel | c.370C>G | p.Gln124Glu | p.Q124E | Q9BSF8 | protein_coding | tolerated_low_confidence(0.16) | benign(0.099) | TCGA-VS-A9UM-01 | Cervix | cervical & endocervical cancer | Female | <65 | I/II | Chemotherapy | cisplatin | CR |
| BTBD10 | SNV | Missense_Mutation | c.152N>T | p.Gly51Val | p.G51V | Q9BSF8 | protein_coding | tolerated_low_confidence(0.17) | benign(0.001) | TCGA-A6-2677-01 | Colorectum | colon adenocarcinoma | Female | >=65 | III/IV | Ancillary | leucovorin | SD | |
| BTBD10 | SNV | Missense_Mutation | c.529G>A | p.Val177Met | p.V177M | Q9BSF8 | protein_coding | deleterious(0.02) | probably_damaging(0.999) | TCGA-A6-2679-01 | Colorectum | colon adenocarcinoma | Female | >=65 | I/II | Unknown | Unknown | SD | |
| BTBD10 | SNV | Missense_Mutation | novel | c.1020N>C | p.Glu340Asp | p.E340D | Q9BSF8 | protein_coding | tolerated(0.06) | possibly_damaging(0.897) | TCGA-AA-3845-01 | Colorectum | colon adenocarcinoma | Female | >=65 | I/II | Unknown | Unknown | PD |
| BTBD10 | SNV | Missense_Mutation | c.218G>T | p.Arg73Leu | p.R73L | Q9BSF8 | protein_coding | deleterious_low_confidence(0) | possibly_damaging(0.493) | TCGA-AM-5820-01 | Colorectum | colon adenocarcinoma | Female | <65 | I/II | Unknown | Unknown | SD |
| Page: 1 2 3 4 |
Top |
Related drugs of malignant transformation related genes |
| Identification of chemicals and drugs interact with genes involved in malignant transfromation |
| (DGIdb 4.0) |
| Entrez ID | Symbol | Category | Interaction Types | Drug Claim Name | Drug Name | PMIDs |
| Page: 1 |

Copyright 2023-Present -The University of Texas Health Science Center at Houston |