
|
|||||
|
 | |
| |
| |
| |
| |
| |
|
Gene: BTBD1 |
Gene summary for BTBD1 |
| Gene information | Species | Human | Gene symbol | BTBD1 | Gene ID | 53339 |
| Gene name | BTB domain containing 1 | |
| Gene Alias | C15orf1 | |
| Cytomap | 15q25.2 | |
| Gene Type | protein-coding | GO ID | GO:0006464 | UniProtAcc | Q9H0C5 |
Top |
Malignant transformation analysis |
| Identification of the aberrant gene expression in precancerous and cancerous lesions by comparing the gene expression of stem-like cells in diseased tissues with normal stem cells |
| Entrez ID | Symbol | Replicates | Species | Organ | Tissue | Adj P-value | Log2FC | Malignancy |
| 53339 | BTBD1 | LZE2T | Human | Esophagus | ESCC | 1.42e-02 | 3.97e-01 | 0.082 |
| 53339 | BTBD1 | LZE24T | Human | Esophagus | ESCC | 3.93e-03 | 1.70e-01 | 0.0596 |
| 53339 | BTBD1 | P2T-E | Human | Esophagus | ESCC | 2.51e-09 | 2.35e-01 | 0.1177 |
| 53339 | BTBD1 | P4T-E | Human | Esophagus | ESCC | 7.10e-16 | 4.76e-01 | 0.1323 |
| 53339 | BTBD1 | P5T-E | Human | Esophagus | ESCC | 3.17e-12 | 2.54e-01 | 0.1327 |
| 53339 | BTBD1 | P8T-E | Human | Esophagus | ESCC | 4.67e-27 | 2.85e-01 | 0.0889 |
| 53339 | BTBD1 | P9T-E | Human | Esophagus | ESCC | 9.73e-14 | 4.58e-01 | 0.1131 |
| 53339 | BTBD1 | P10T-E | Human | Esophagus | ESCC | 2.50e-25 | 4.89e-01 | 0.116 |
| 53339 | BTBD1 | P11T-E | Human | Esophagus | ESCC | 2.47e-11 | 2.80e-01 | 0.1426 |
| 53339 | BTBD1 | P12T-E | Human | Esophagus | ESCC | 1.53e-15 | 3.31e-01 | 0.1122 |
| 53339 | BTBD1 | P15T-E | Human | Esophagus | ESCC | 4.39e-20 | 5.52e-01 | 0.1149 |
| 53339 | BTBD1 | P16T-E | Human | Esophagus | ESCC | 6.97e-14 | 3.25e-01 | 0.1153 |
| 53339 | BTBD1 | P17T-E | Human | Esophagus | ESCC | 6.35e-05 | 2.46e-01 | 0.1278 |
| 53339 | BTBD1 | P19T-E | Human | Esophagus | ESCC | 4.96e-02 | 6.52e-01 | 0.1662 |
| 53339 | BTBD1 | P20T-E | Human | Esophagus | ESCC | 4.64e-07 | 2.73e-01 | 0.1124 |
| 53339 | BTBD1 | P21T-E | Human | Esophagus | ESCC | 7.59e-19 | 2.77e-01 | 0.1617 |
| 53339 | BTBD1 | P22T-E | Human | Esophagus | ESCC | 2.74e-18 | 3.35e-01 | 0.1236 |
| 53339 | BTBD1 | P23T-E | Human | Esophagus | ESCC | 2.67e-22 | 3.99e-01 | 0.108 |
| 53339 | BTBD1 | P24T-E | Human | Esophagus | ESCC | 3.83e-11 | 2.25e-01 | 0.1287 |
| 53339 | BTBD1 | P26T-E | Human | Esophagus | ESCC | 1.08e-18 | 2.45e-01 | 0.1276 |
| Page: 1 2 3 4 5 |
| Tissue | Expression Dynamics | Abbreviation |
| Esophagus | 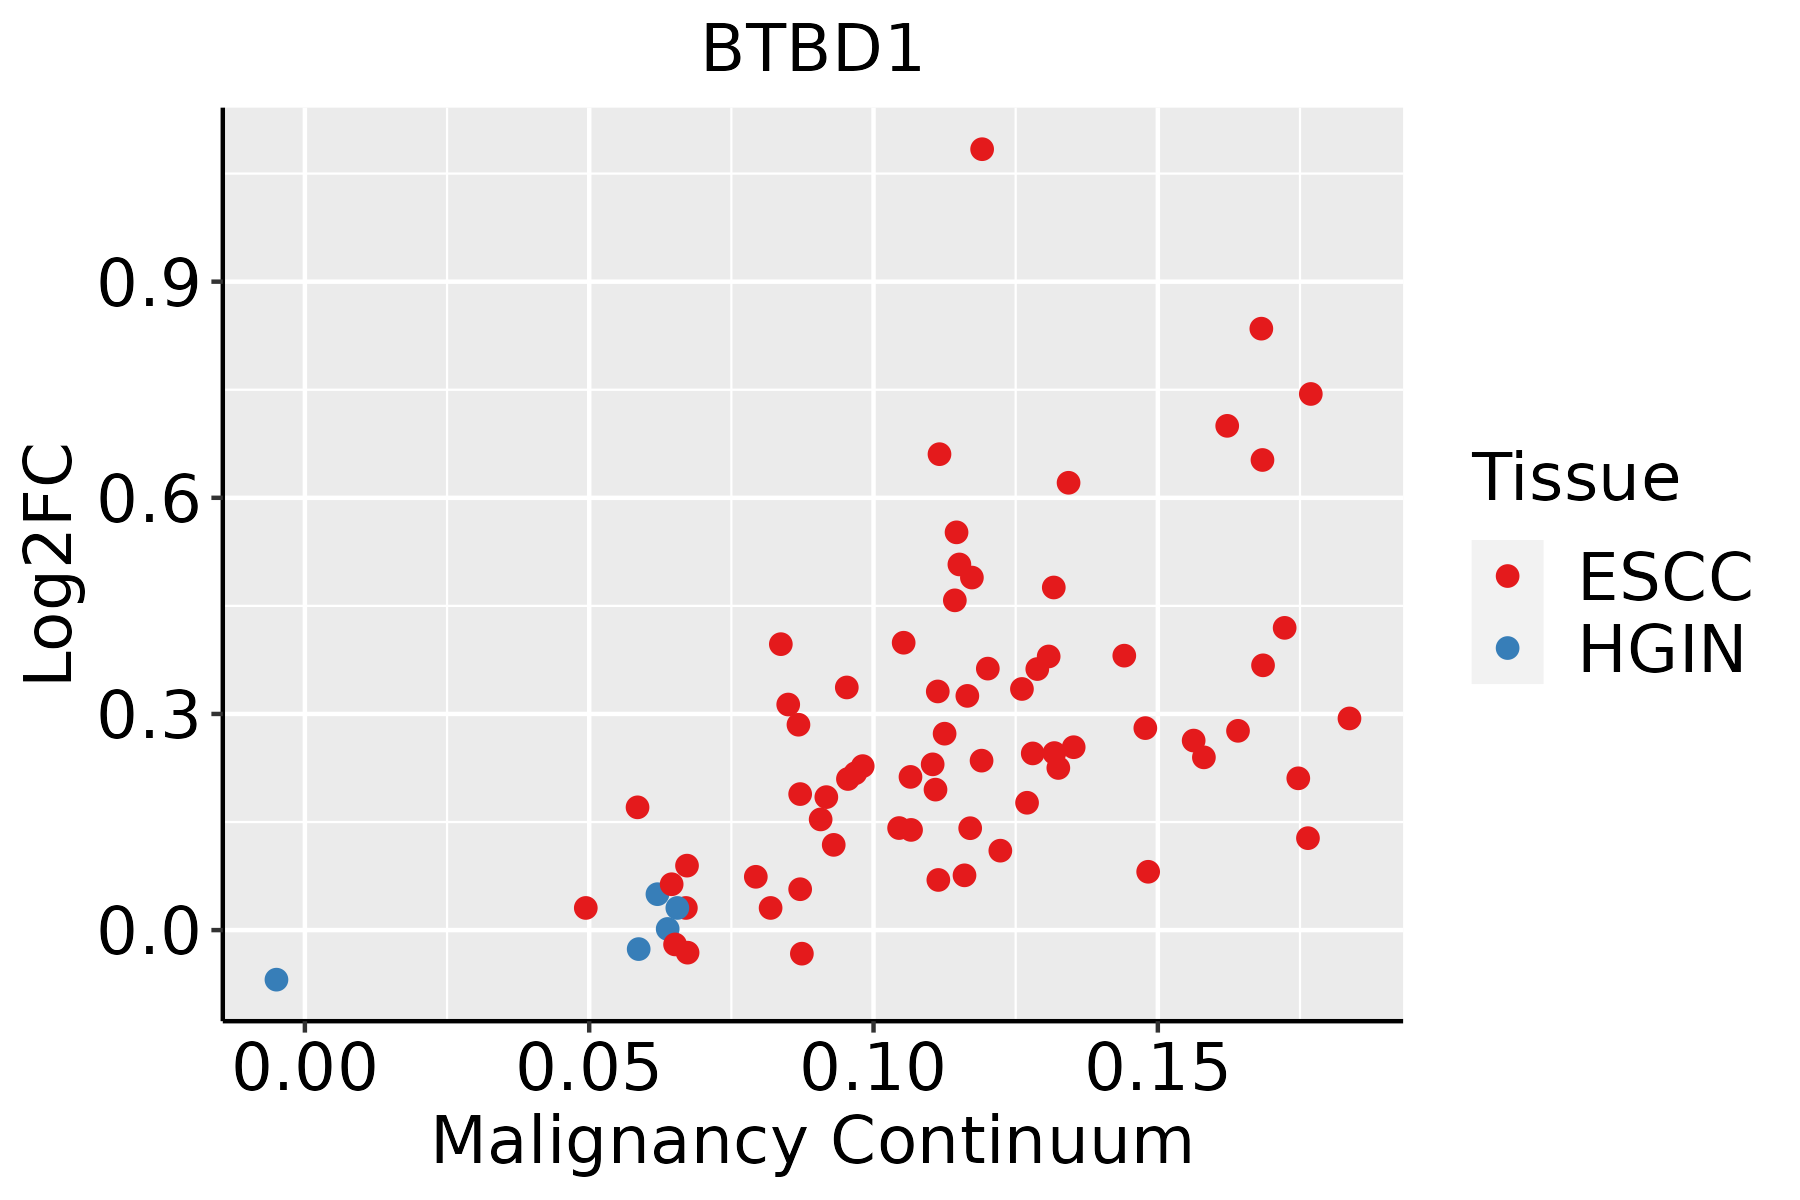 | ESCC: Esophageal squamous cell carcinoma |
| HGIN: High-grade intraepithelial neoplasias | ||
| LGIN: Low-grade intraepithelial neoplasias | ||
| Liver |  | HCC: Hepatocellular carcinoma |
| NAFLD: Non-alcoholic fatty liver disease | ||
| Oral Cavity | 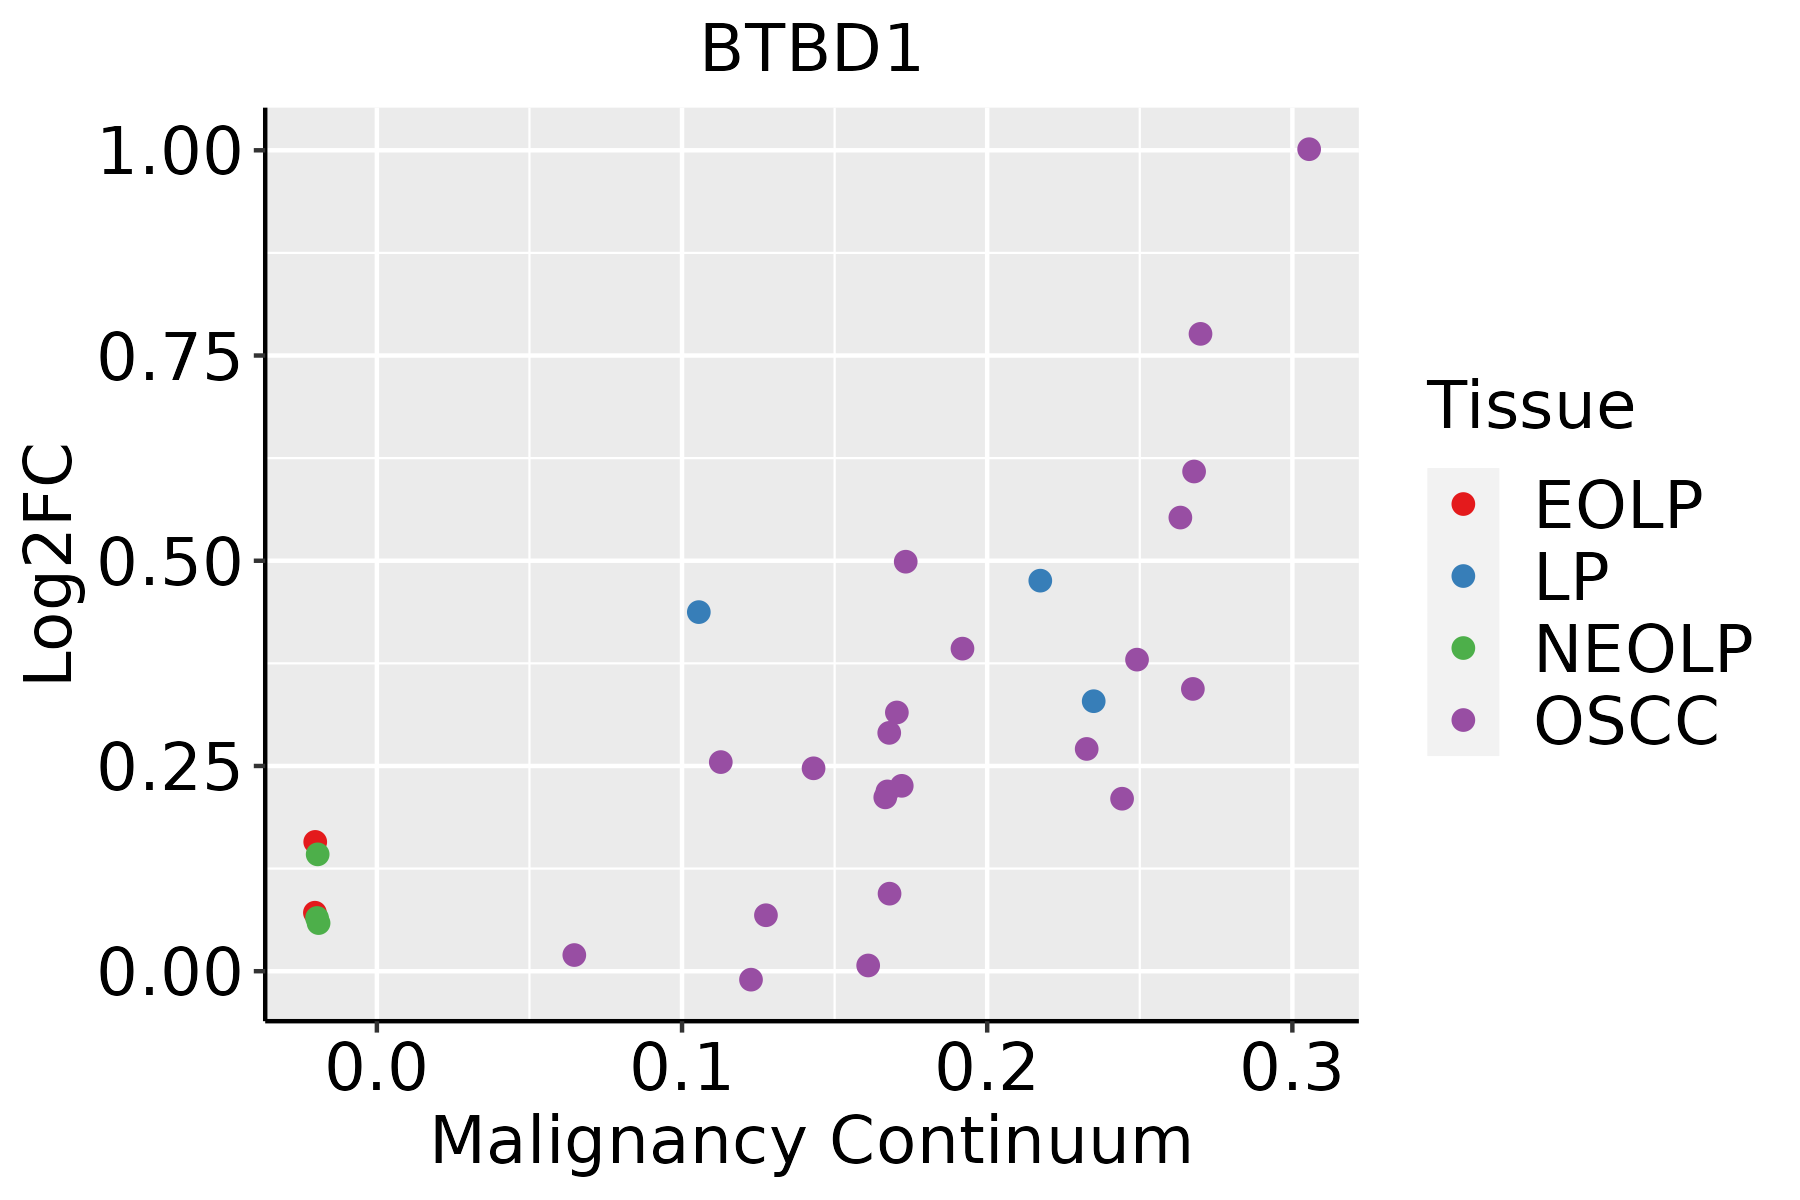 | EOLP: Erosive Oral lichen planus |
| LP: leukoplakia | ||
| NEOLP: Non-erosive oral lichen planus | ||
| OSCC: Oral squamous cell carcinoma | ||
| Skin | 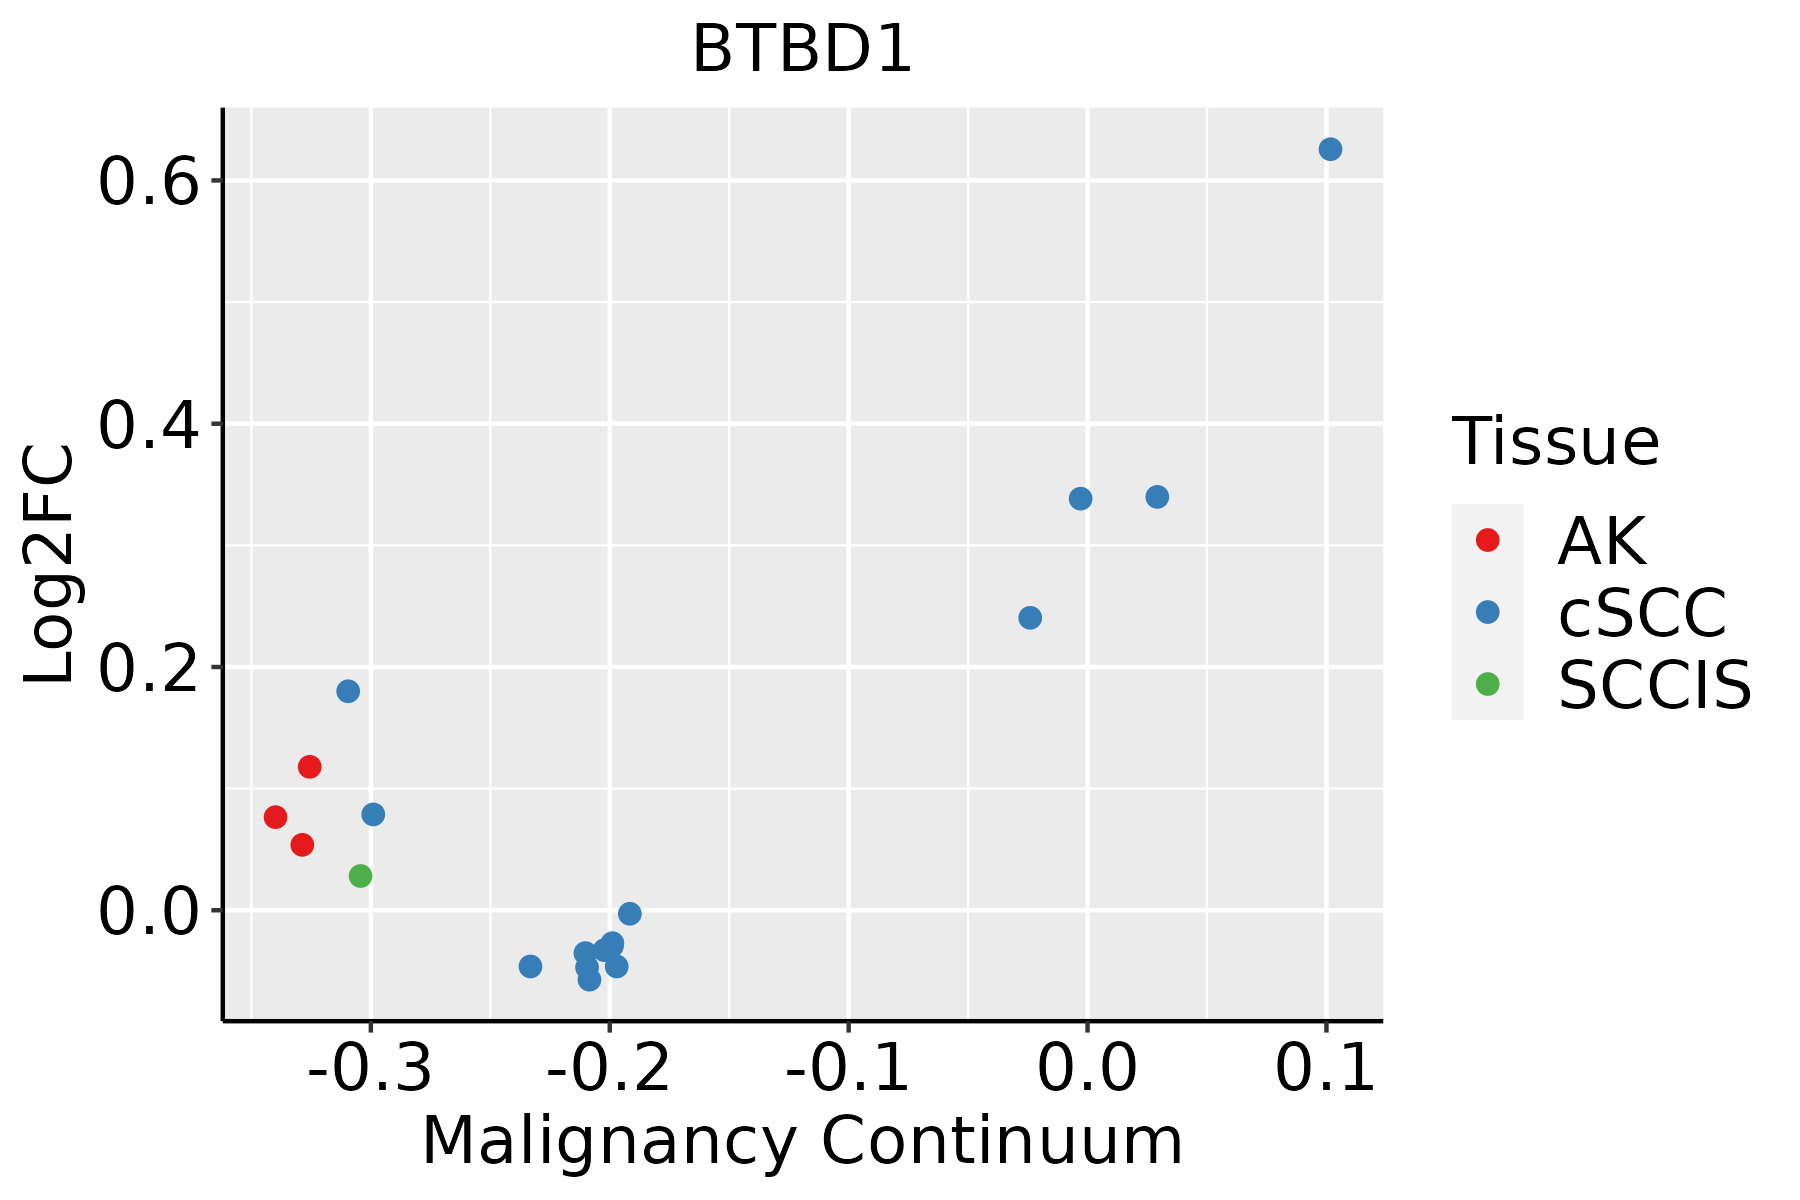 | AK: Actinic keratosis |
| cSCC: Cutaneous squamous cell carcinoma | ||
| SCCIS:squamous cell carcinoma in situ | ||
| Thyroid | 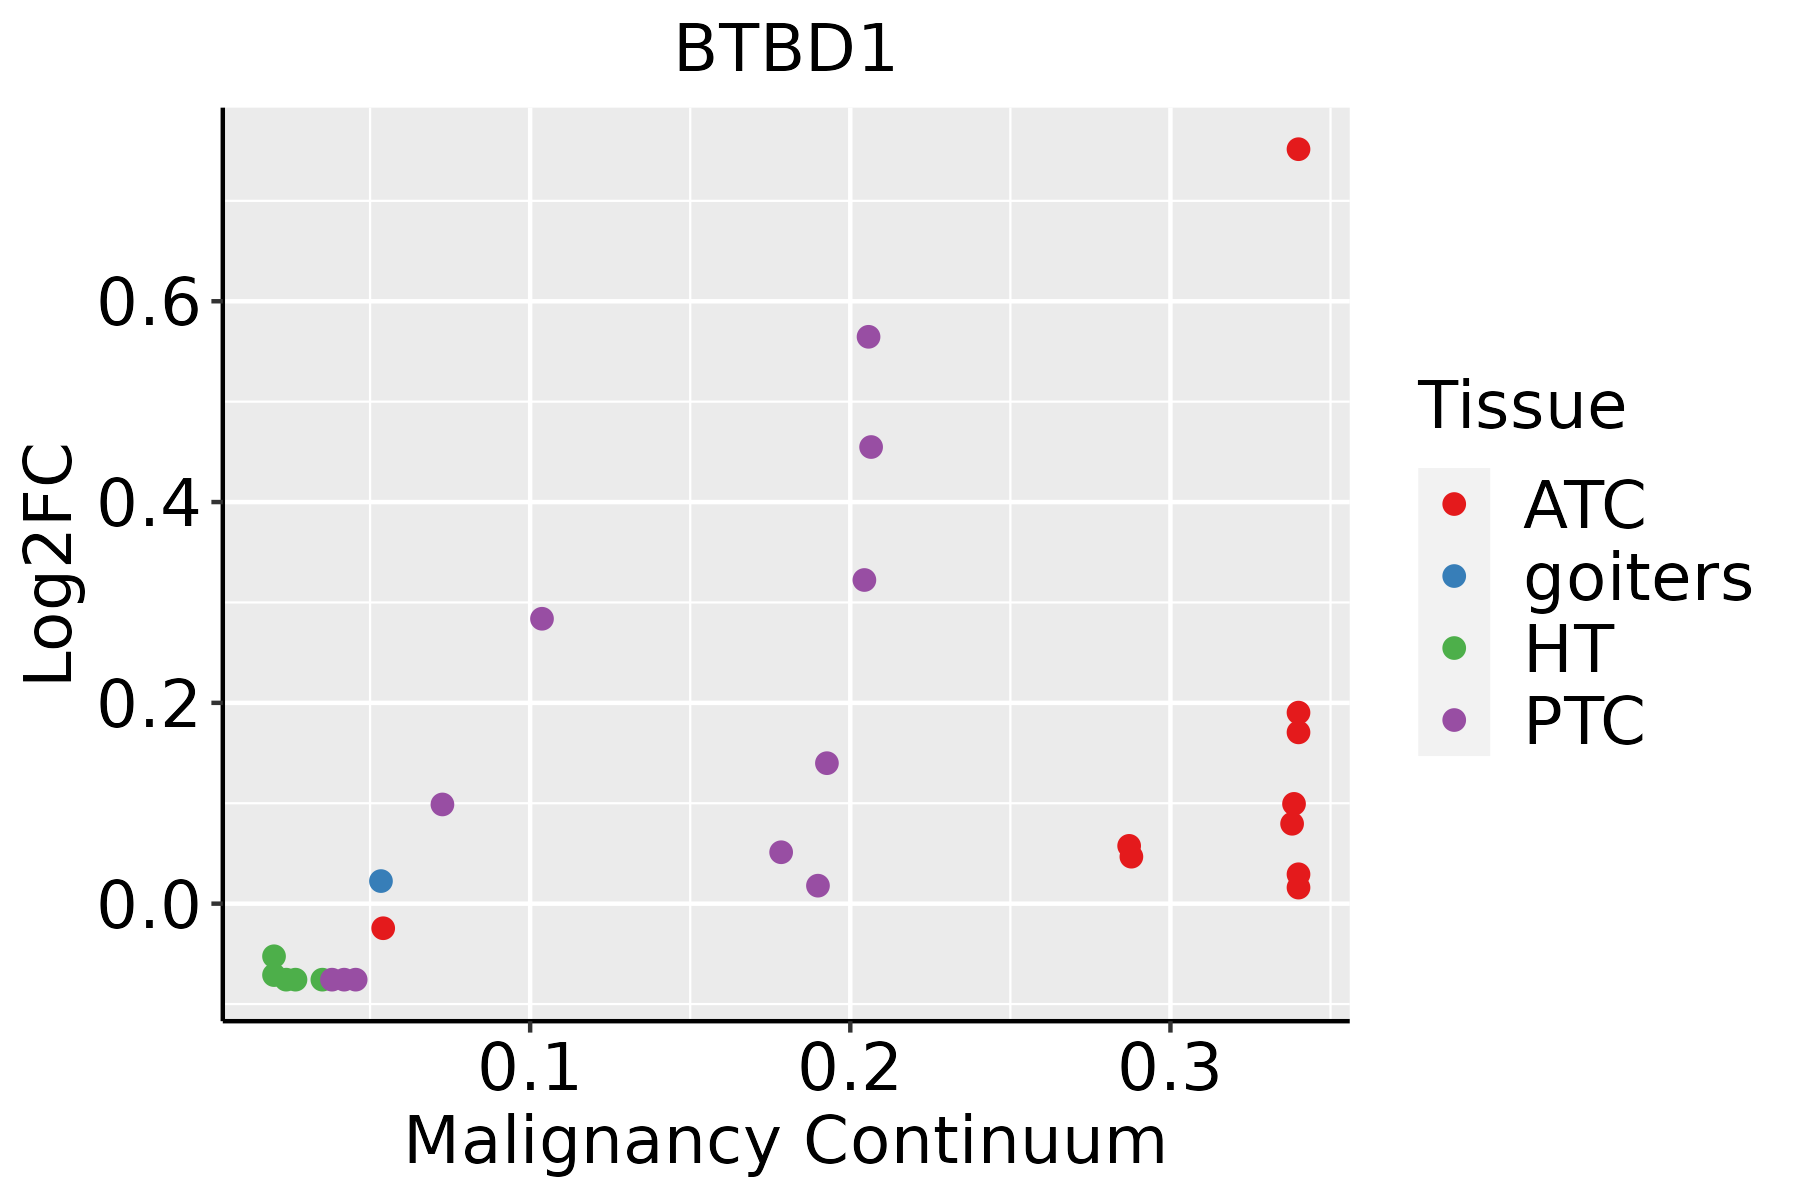 | ATC: Anaplastic thyroid cancer |
| HT: Hashimoto's thyroiditis | ||
| PTC: Papillary thyroid cancer |
| ∗log2FC in expression of this searched gene in stem-like cells from each diseased tissue sample relative to stem-like cells in normal samples in each tissue plotted against the malignancy continuum. Samples are colored based on if they are from different disease stage. |
Top |
Malignant transformation related pathway analysis |
| Find out the enriched GO biological processes and KEGG pathways involved in transition from healthy to precancer to cancer |
| Tissue | Disease Stage | Enriched GO biological Processes |
| Colorectum | AD |  |
| Colorectum | SER |  |
| Colorectum | MSS |  |
| Colorectum | MSI-H |  |
| Colorectum | FAP |  |
| ∗Top 15 enriched GO BP terms are showed in the bar plot of each disease state in each tissue. Each row represents a significant GO biological process which is colored according to the -log10(p.adjust). |
| Page: 1 2 3 4 5 6 7 8 9 |
| GO ID | Tissue | Disease Stage | Description | Gene Ratio | Bg Ratio | pvalue | p.adjust | Count |
| GO:00071786 | Cervix | CC | transmembrane receptor protein serine/threonine kinase signaling pathway | 67/2311 | 355/18723 | 2.39e-04 | 2.67e-03 | 67 |
| GO:0070997 | Colorectum | AD | neuron death | 114/3918 | 361/18723 | 1.13e-06 | 3.72e-05 | 114 |
| GO:1901214 | Colorectum | AD | regulation of neuron death | 99/3918 | 319/18723 | 1.26e-05 | 2.76e-04 | 99 |
| GO:1901215 | Colorectum | AD | negative regulation of neuron death | 67/3918 | 208/18723 | 8.81e-05 | 1.35e-03 | 67 |
| GO:0050673 | Colorectum | AD | epithelial cell proliferation | 119/3918 | 437/18723 | 8.75e-04 | 8.51e-03 | 119 |
| GO:00709972 | Colorectum | MSS | neuron death | 97/3467 | 361/18723 | 5.21e-05 | 9.31e-04 | 97 |
| GO:19012142 | Colorectum | MSS | regulation of neuron death | 83/3467 | 319/18723 | 5.28e-04 | 5.99e-03 | 83 |
| GO:00506731 | Colorectum | MSS | epithelial cell proliferation | 108/3467 | 437/18723 | 6.76e-04 | 7.30e-03 | 108 |
| GO:19012152 | Colorectum | MSS | negative regulation of neuron death | 53/3467 | 208/18723 | 7.60e-03 | 4.77e-02 | 53 |
| GO:00709974 | Colorectum | FAP | neuron death | 81/2622 | 361/18723 | 8.35e-06 | 2.46e-04 | 81 |
| GO:19012144 | Colorectum | FAP | regulation of neuron death | 67/2622 | 319/18723 | 3.73e-04 | 4.63e-03 | 67 |
| GO:19012153 | Colorectum | FAP | negative regulation of neuron death | 46/2622 | 208/18723 | 9.52e-04 | 9.42e-03 | 46 |
| GO:00506732 | Colorectum | FAP | epithelial cell proliferation | 84/2622 | 437/18723 | 1.39e-03 | 1.25e-02 | 84 |
| GO:00709975 | Colorectum | CRC | neuron death | 65/2078 | 361/18723 | 5.55e-05 | 1.26e-03 | 65 |
| GO:19012154 | Colorectum | CRC | negative regulation of neuron death | 41/2078 | 208/18723 | 1.79e-04 | 3.17e-03 | 41 |
| GO:19012145 | Colorectum | CRC | regulation of neuron death | 57/2078 | 319/18723 | 1.90e-04 | 3.30e-03 | 57 |
| GO:00506733 | Colorectum | CRC | epithelial cell proliferation | 69/2078 | 437/18723 | 1.61e-03 | 1.69e-02 | 69 |
| GO:0051098111 | Esophagus | ESCC | regulation of binding | 251/8552 | 363/18723 | 6.73e-20 | 8.46e-18 | 251 |
| GO:004339320 | Esophagus | ESCC | regulation of protein binding | 135/8552 | 196/18723 | 3.69e-11 | 1.22e-09 | 135 |
| GO:0070997111 | Esophagus | ESCC | neuron death | 216/8552 | 361/18723 | 3.49e-08 | 6.45e-07 | 216 |
| Page: 1 2 3 |
| Pathway ID | Tissue | Disease Stage | Description | Gene Ratio | Bg Ratio | pvalue | p.adjust | qvalue | Count |
| Page: 1 |
Top |
Cell-cell communication analysis |
| Identification of potential cell-cell interactions between two cell types and their ligand-receptor pairs for different disease states |
| Ligand | Receptor | LRpair | Pathway | Tissue | Disease Stage |
| Page: 1 |
Top |
Single-cell gene regulatory network inference analysis |
| Find out the significant the regulons (TFs) and the target genes of each regulon across cell types for different disease states |
| TF | Cell Type | Tissue | Disease Stage | Target Gene | RSS | Regulon Activity |
| ∗The dot plots of a searched regulon are shown for all cell subpopulations in each disease state of each tissue based on the regulon specific score inferred using pySCENIC and by calculating the average expression. |
| Page: 1 |
Top |
Somatic mutation of malignant transformation related genes |
| Annotation of somatic variants for genes involved in malignant transformation |
| Hugo Symbol | Variant Class | Variant Classification | dbSNP RS | HGVSc | HGVSp | HGVSp Short | SWISSPROT | BIOTYPE | SIFT | PolyPhen | Tumor Sample Barcode | Tissue | Histology | Sex | Age | Stage | Therapy Types | Drugs | Outcome |
| BTBD1 | SNV | Missense_Mutation | c.1027G>T | p.Gly343Cys | p.G343C | Q9H0C5 | protein_coding | deleterious(0.01) | probably_damaging(1) | TCGA-A1-A0SO-01 | Breast | breast invasive carcinoma | Female | >=65 | I/II | Chemotherapy | SD | ||
| BTBD1 | SNV | Missense_Mutation | novel | c.1106C>G | p.Ser369Cys | p.S369C | Q9H0C5 | protein_coding | deleterious(0) | probably_damaging(0.999) | TCGA-A7-A6VW-01 | Breast | breast invasive carcinoma | Female | <65 | I/II | Chemotherapy | doxorubicin | CR |
| BTBD1 | SNV | Missense_Mutation | c.1195N>C | p.Ser399Arg | p.S399R | Q9H0C5 | protein_coding | tolerated(0.35) | probably_damaging(0.932) | TCGA-A8-A07L-01 | Breast | breast invasive carcinoma | Female | <65 | III/IV | Chemotherapy | CR | ||
| BTBD1 | SNV | Missense_Mutation | novel | c.711A>C | p.Glu237Asp | p.E237D | Q9H0C5 | protein_coding | deleterious(0) | probably_damaging(0.985) | TCGA-AN-A046-01 | Breast | breast invasive carcinoma | Female | >=65 | I/II | Unknown | Unknown | SD |
| BTBD1 | SNV | Missense_Mutation | c.1420N>A | p.Gln474Lys | p.Q474K | Q9H0C5 | protein_coding | deleterious(0) | probably_damaging(0.997) | TCGA-E9-A1NA-01 | Breast | breast invasive carcinoma | Female | <65 | I/II | Chemotherapy | cyclophosphamide | SD | |
| BTBD1 | SNV | Missense_Mutation | novel | c.655N>G | p.Ile219Val | p.I219V | Q9H0C5 | protein_coding | tolerated(0.1) | benign(0.107) | TCGA-DS-A3LQ-01 | Cervix | cervical & endocervical cancer | Female | <65 | III/IV | Chemotherapy | cisplatin | SD |
| BTBD1 | SNV | Missense_Mutation | c.860N>T | p.Ala287Val | p.A287V | Q9H0C5 | protein_coding | tolerated(0.35) | benign(0.196) | TCGA-AA-A01P-01 | Colorectum | colon adenocarcinoma | Female | >=65 | III/IV | Unknown | Unknown | PD | |
| BTBD1 | SNV | Missense_Mutation | novel | c.1268N>G | p.Tyr423Cys | p.Y423C | Q9H0C5 | protein_coding | deleterious(0) | probably_damaging(1) | TCGA-AZ-4315-01 | Colorectum | colon adenocarcinoma | Male | <65 | I/II | Unknown | Unknown | SD |
| BTBD1 | SNV | Missense_Mutation | novel | c.1090N>G | p.Phe364Val | p.F364V | Q9H0C5 | protein_coding | deleterious(0) | probably_damaging(0.948) | TCGA-CA-6717-01 | Colorectum | colon adenocarcinoma | Male | <65 | I/II | Chemotherapy | oxaliplatin | CR |
| BTBD1 | SNV | Missense_Mutation | c.832N>T | p.Pro278Ser | p.P278S | Q9H0C5 | protein_coding | deleterious(0) | probably_damaging(0.989) | TCGA-AG-A02N-01 | Colorectum | rectum adenocarcinoma | Male | >=65 | I/II | Chemotherapy | folinic | CR |
| Page: 1 2 3 4 |
Top |
Related drugs of malignant transformation related genes |
| Identification of chemicals and drugs interact with genes involved in malignant transfromation |
| (DGIdb 4.0) |
| Entrez ID | Symbol | Category | Interaction Types | Drug Claim Name | Drug Name | PMIDs |
| Page: 1 |

Copyright 2023-Present -The University of Texas Health Science Center at Houston |