
|
|||||
|
 | |
| |
| |
| |
| |
| |
|
Gene: BSDC1 |
Gene summary for BSDC1 |
| Gene information | Species | Human | Gene symbol | BSDC1 | Gene ID | 55108 |
| Gene name | BSD domain containing 1 | |
| Gene Alias | BSDC1 | |
| Cytomap | 1p35.1 | |
| Gene Type | protein-coding | GO ID | GO:0005575 | UniProtAcc | Q9NW68 |
Top |
Malignant transformation analysis |
| Identification of the aberrant gene expression in precancerous and cancerous lesions by comparing the gene expression of stem-like cells in diseased tissues with normal stem cells |
| Entrez ID | Symbol | Replicates | Species | Organ | Tissue | Adj P-value | Log2FC | Malignancy |
| 55108 | BSDC1 | HTA11_347_2000001011 | Human | Colorectum | AD | 1.46e-11 | 4.12e-01 | -0.1954 |
| 55108 | BSDC1 | HTA11_696_2000001011 | Human | Colorectum | AD | 4.55e-02 | 3.62e-01 | -0.1464 |
| 55108 | BSDC1 | HTA11_866_2000001011 | Human | Colorectum | AD | 3.65e-02 | 3.59e-01 | -0.1001 |
| 55108 | BSDC1 | HTA11_1391_2000001011 | Human | Colorectum | AD | 1.94e-05 | 3.68e-01 | -0.059 |
| 55108 | BSDC1 | HTA11_866_3004761011 | Human | Colorectum | AD | 1.34e-02 | 2.38e-01 | 0.096 |
| 55108 | BSDC1 | HTA11_8622_2000001021 | Human | Colorectum | SER | 7.44e-05 | 5.61e-01 | 0.0528 |
| 55108 | BSDC1 | HTA11_10711_2000001011 | Human | Colorectum | AD | 6.08e-04 | 3.68e-01 | 0.0338 |
| 55108 | BSDC1 | HTA11_7696_3000711011 | Human | Colorectum | AD | 8.12e-04 | 3.98e-01 | 0.0674 |
| 55108 | BSDC1 | HTA11_6818_2000001021 | Human | Colorectum | AD | 1.46e-02 | 2.44e-01 | 0.0588 |
| 55108 | BSDC1 | HTA11_99999965104_69814 | Human | Colorectum | MSS | 1.84e-03 | 2.70e-01 | 0.281 |
| 55108 | BSDC1 | A015-C-203 | Human | Colorectum | FAP | 1.08e-05 | -1.54e-01 | -0.1294 |
| 55108 | BSDC1 | A015-C-106 | Human | Colorectum | FAP | 2.80e-04 | -9.06e-02 | -0.0511 |
| 55108 | BSDC1 | A015-C-104 | Human | Colorectum | FAP | 8.90e-07 | -1.88e-01 | -0.1899 |
| 55108 | BSDC1 | A002-C-016 | Human | Colorectum | FAP | 3.65e-09 | -1.71e-01 | 0.0521 |
| 55108 | BSDC1 | A002-C-116 | Human | Colorectum | FAP | 3.05e-08 | -1.81e-01 | -0.0452 |
| 55108 | BSDC1 | F034 | Human | Colorectum | FAP | 2.54e-04 | -1.10e-01 | -0.0665 |
| 55108 | BSDC1 | CRC-1-8810 | Human | Colorectum | CRC | 9.71e-04 | -1.43e-01 | 0.6257 |
| 55108 | BSDC1 | CRC-3-11773 | Human | Colorectum | CRC | 6.30e-05 | -1.78e-01 | 0.2564 |
| 55108 | BSDC1 | LZE2D | Human | Esophagus | HGIN | 5.47e-04 | 2.82e-01 | 0.0642 |
| 55108 | BSDC1 | LZE4T | Human | Esophagus | ESCC | 9.36e-09 | 2.38e-01 | 0.0811 |
| Page: 1 2 3 4 5 6 7 8 |
| Tissue | Expression Dynamics | Abbreviation |
| Colorectum (GSE201348) |  | FAP: Familial adenomatous polyposis |
| CRC: Colorectal cancer | ||
| Colorectum (HTA11) |  | AD: Adenomas |
| SER: Sessile serrated lesions | ||
| MSI-H: Microsatellite-high colorectal cancer | ||
| MSS: Microsatellite stable colorectal cancer | ||
| Esophagus |  | ESCC: Esophageal squamous cell carcinoma |
| HGIN: High-grade intraepithelial neoplasias | ||
| LGIN: Low-grade intraepithelial neoplasias | ||
| Liver | 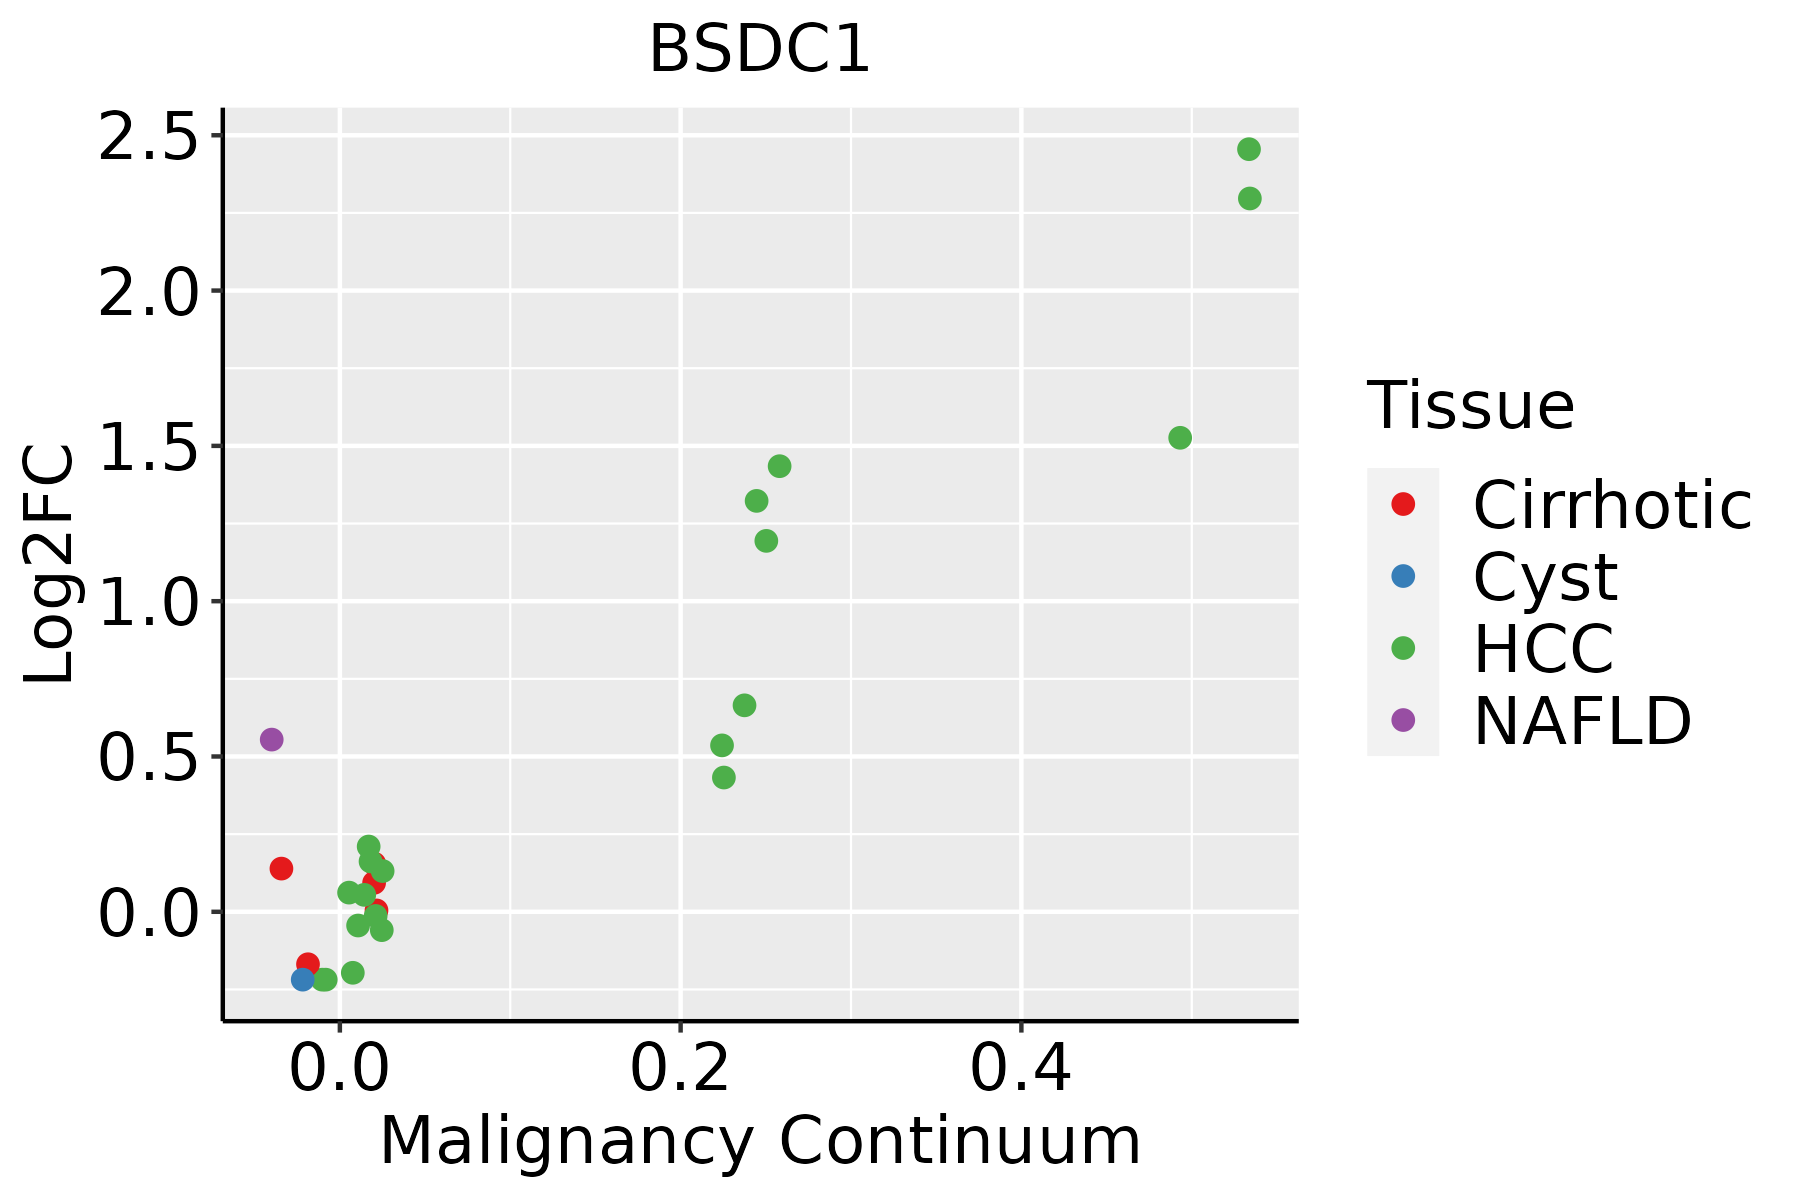 | HCC: Hepatocellular carcinoma |
| NAFLD: Non-alcoholic fatty liver disease | ||
| Oral Cavity |  | EOLP: Erosive Oral lichen planus |
| LP: leukoplakia | ||
| NEOLP: Non-erosive oral lichen planus | ||
| OSCC: Oral squamous cell carcinoma | ||
| Skin | 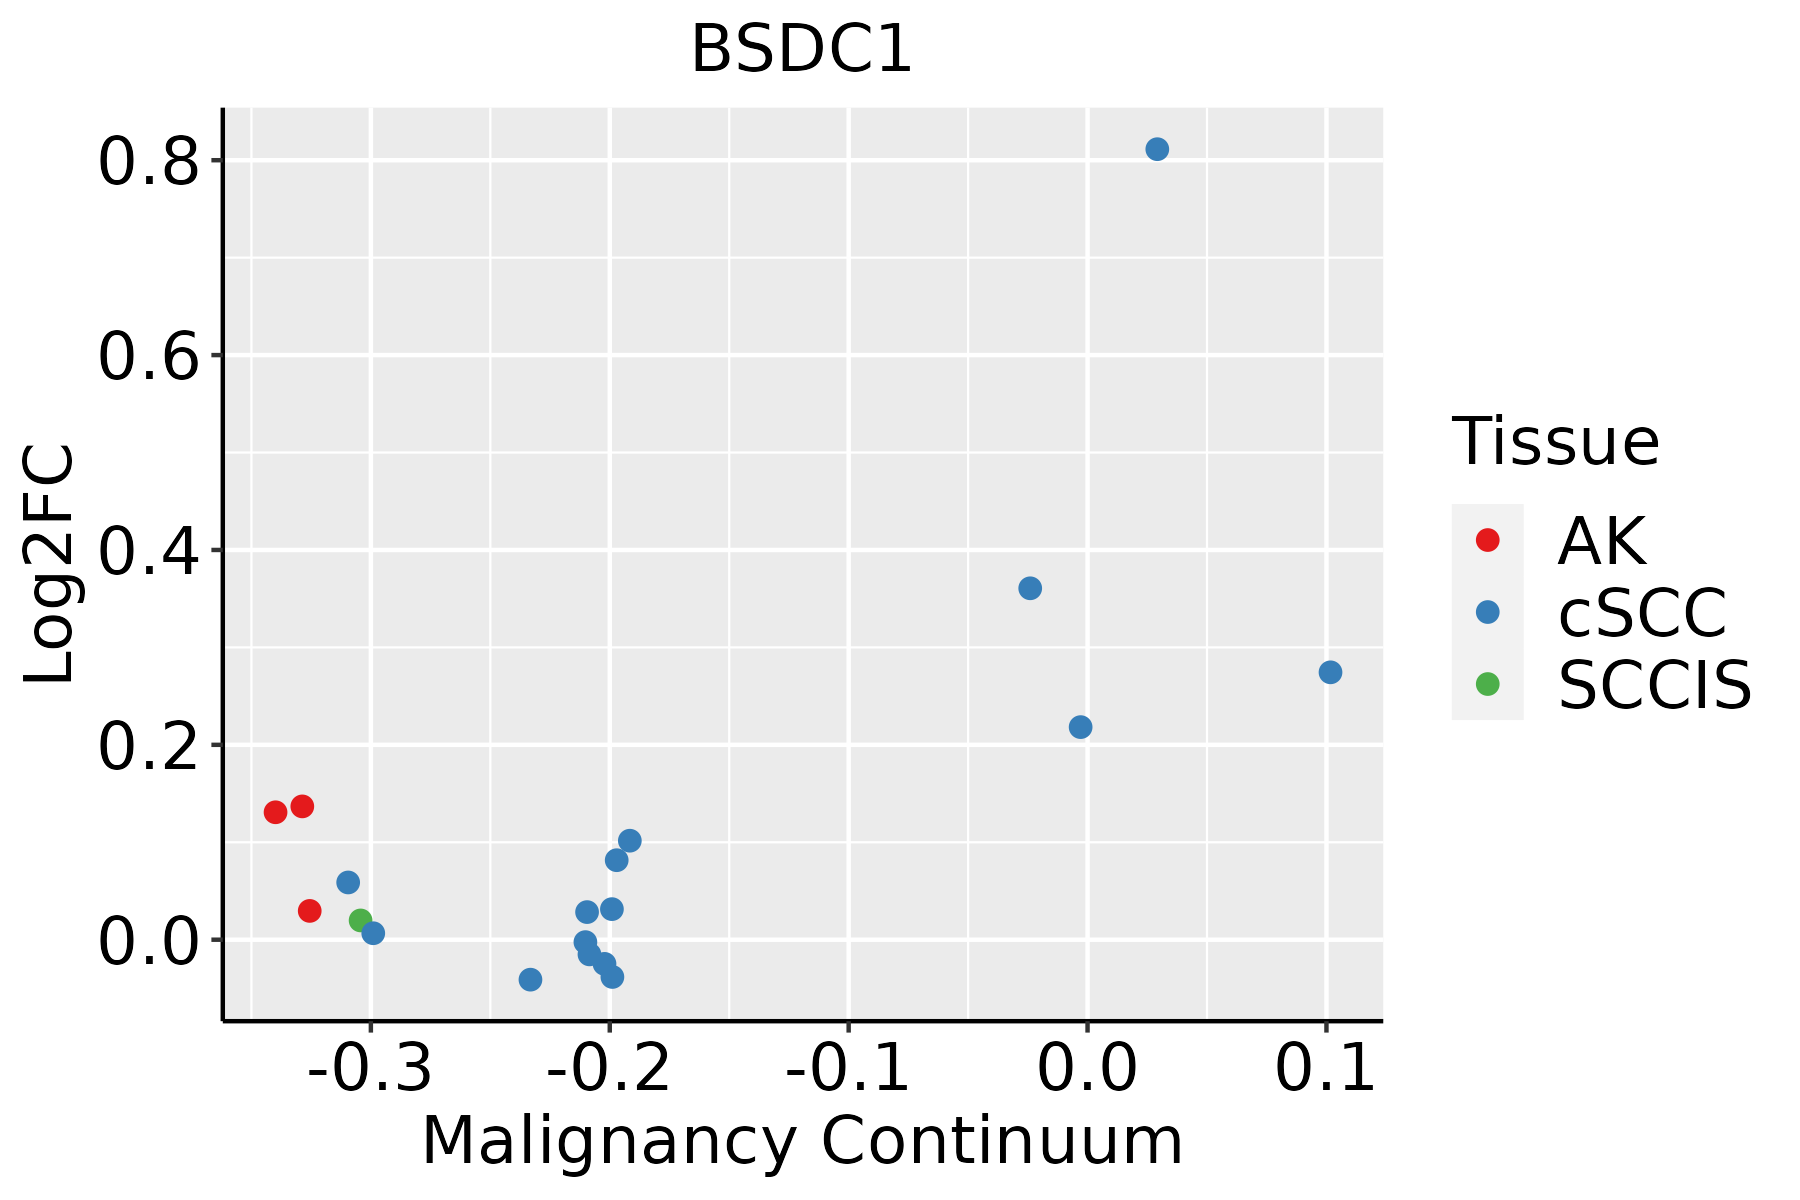 | AK: Actinic keratosis |
| cSCC: Cutaneous squamous cell carcinoma | ||
| SCCIS:squamous cell carcinoma in situ | ||
| Thyroid | 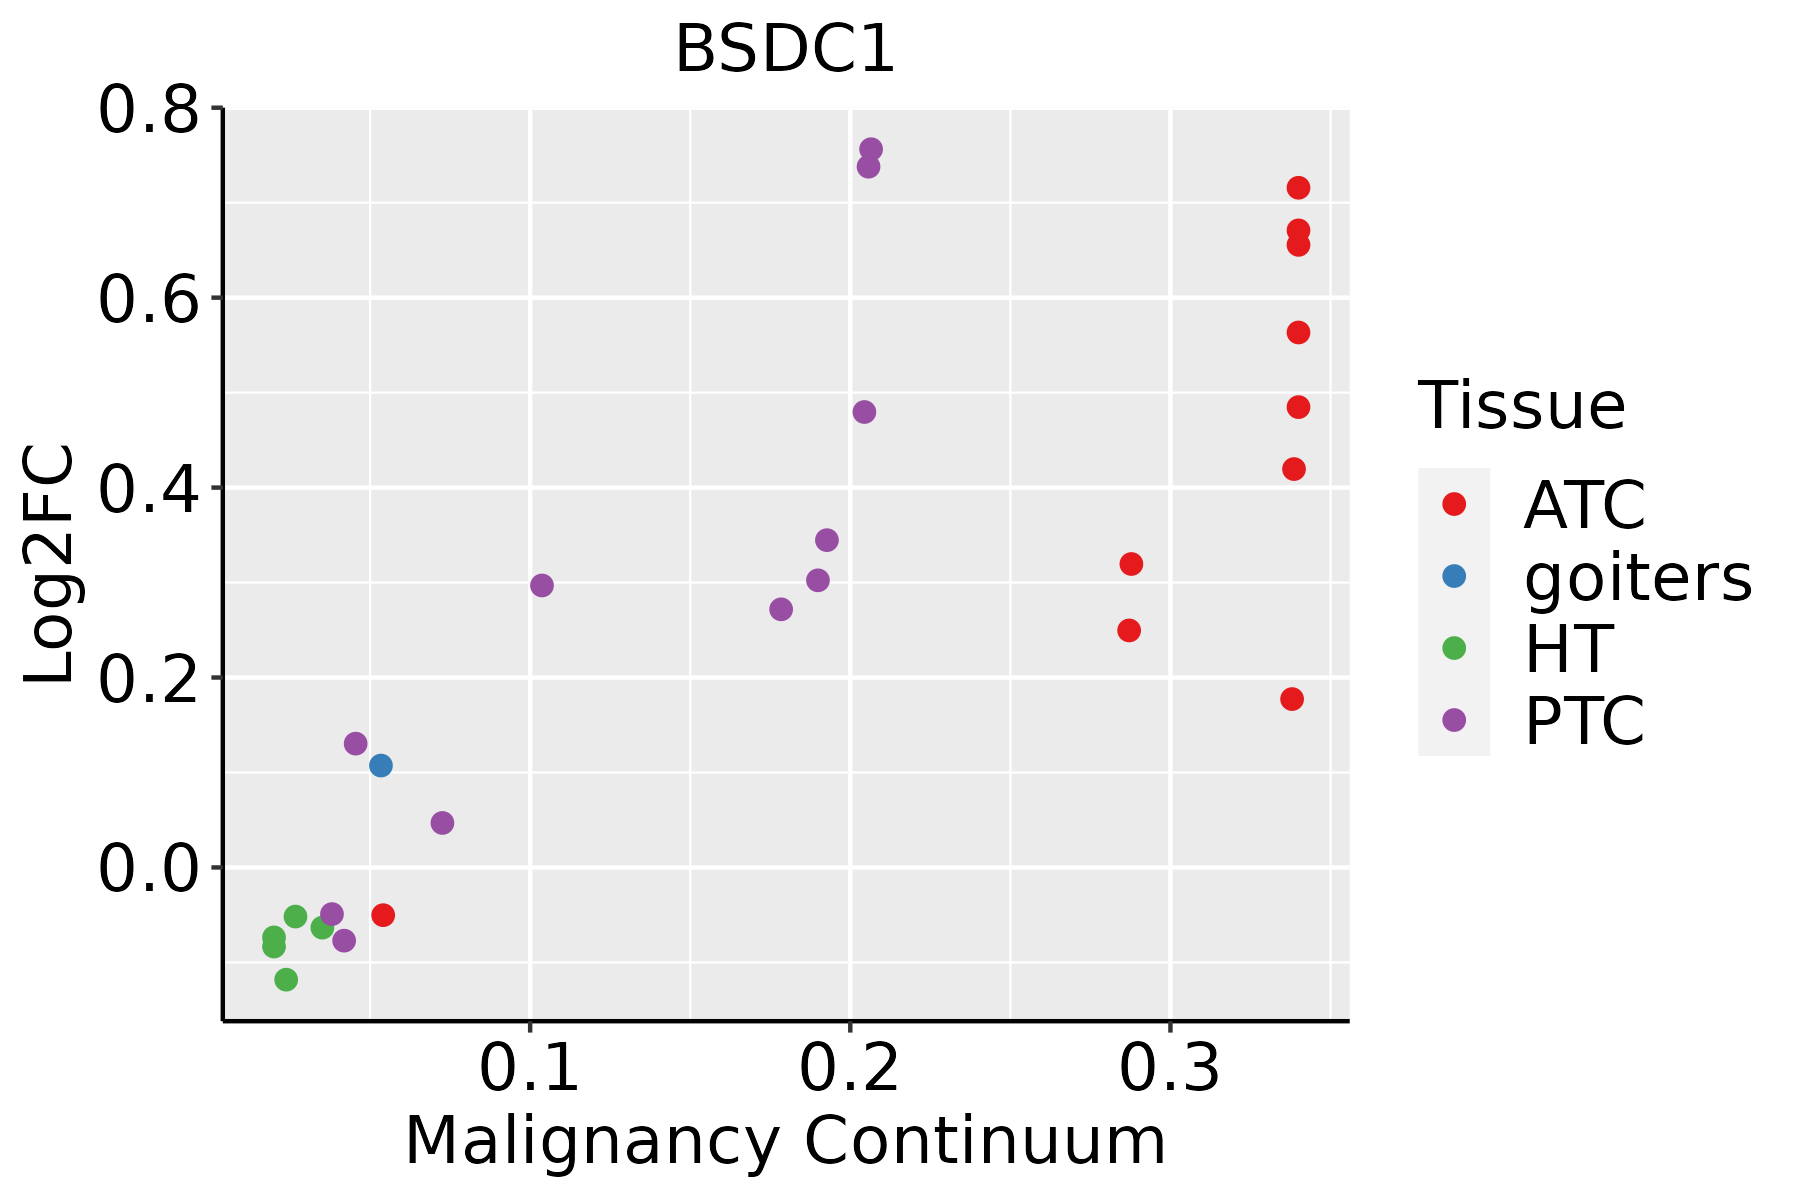 | ATC: Anaplastic thyroid cancer |
| HT: Hashimoto's thyroiditis | ||
| PTC: Papillary thyroid cancer |
| ∗log2FC in expression of this searched gene in stem-like cells from each diseased tissue sample relative to stem-like cells in normal samples in each tissue plotted against the malignancy continuum. Samples are colored based on if they are from different disease stage. |
Top |
Malignant transformation related pathway analysis |
| Find out the enriched GO biological processes and KEGG pathways involved in transition from healthy to precancer to cancer |
| Tissue | Disease Stage | Enriched GO biological Processes |
| Colorectum | AD |  |
| Colorectum | SER |  |
| Colorectum | MSS |  |
| Colorectum | MSI-H |  |
| Colorectum | FAP |  |
| ∗Top 15 enriched GO BP terms are showed in the bar plot of each disease state in each tissue. Each row represents a significant GO biological process which is colored according to the -log10(p.adjust). |
| Page: 1 2 3 4 5 6 7 8 9 |
| GO ID | Tissue | Disease Stage | Description | Gene Ratio | Bg Ratio | pvalue | p.adjust | Count |
| Page: 1 |
| Pathway ID | Tissue | Disease Stage | Description | Gene Ratio | Bg Ratio | pvalue | p.adjust | qvalue | Count |
| Page: 1 |
Top |
Cell-cell communication analysis |
| Identification of potential cell-cell interactions between two cell types and their ligand-receptor pairs for different disease states |
| Ligand | Receptor | LRpair | Pathway | Tissue | Disease Stage |
| Page: 1 |
Top |
Single-cell gene regulatory network inference analysis |
| Find out the significant the regulons (TFs) and the target genes of each regulon across cell types for different disease states |
| TF | Cell Type | Tissue | Disease Stage | Target Gene | RSS | Regulon Activity |
| ∗The dot plots of a searched regulon are shown for all cell subpopulations in each disease state of each tissue based on the regulon specific score inferred using pySCENIC and by calculating the average expression. |
| Page: 1 |
Top |
Somatic mutation of malignant transformation related genes |
| Annotation of somatic variants for genes involved in malignant transformation |
| Hugo Symbol | Variant Class | Variant Classification | dbSNP RS | HGVSc | HGVSp | HGVSp Short | SWISSPROT | BIOTYPE | SIFT | PolyPhen | Tumor Sample Barcode | Tissue | Histology | Sex | Age | Stage | Therapy Types | Drugs | Outcome |
| BSDC1 | SNV | Missense_Mutation | rs769628705 | c.23G>A | p.Gly8Glu | p.G8E | Q9NW68 | protein_coding | deleterious(0) | possibly_damaging(0.681) | TCGA-A2-A0CX-01 | Breast | breast invasive carcinoma | Female | <65 | I/II | Chemotherapy | adriamycin | SD |
| BSDC1 | SNV | Missense_Mutation | c.301G>A | p.Val101Met | p.V101M | Q9NW68 | protein_coding | deleterious(0.02) | possibly_damaging(0.891) | TCGA-AR-A0TU-01 | Breast | breast invasive carcinoma | Female | <65 | I/II | Unspecific | Doxorubicin | SD | |
| BSDC1 | SNV | Missense_Mutation | c.274A>G | p.Lys92Glu | p.K92E | Q9NW68 | protein_coding | deleterious(0) | probably_damaging(0.929) | TCGA-BH-A18G-01 | Breast | breast invasive carcinoma | Female | >=65 | I/II | Unknown | Unknown | SD | |
| BSDC1 | SNV | Missense_Mutation | c.602N>T | p.Ser201Leu | p.S201L | Q9NW68 | protein_coding | tolerated(0.24) | benign(0.012) | TCGA-E2-A1IN-01 | Breast | breast invasive carcinoma | Female | <65 | I/II | Hormone Therapy | arimidex | SD | |
| BSDC1 | SNV | Missense_Mutation | novel | c.1156N>C | p.Glu386Gln | p.E386Q | Q9NW68 | protein_coding | deleterious_low_confidence(0) | probably_damaging(0.999) | TCGA-OL-A97C-01 | Breast | breast invasive carcinoma | Female | >=65 | I/II | Unknown | Unknown | PD |
| BSDC1 | insertion | In_Frame_Ins | novel | c.1076_1077insGAAAGGTAGGTCTGGAGGTCCAAG | p.His359delinsGlnLysGlyArgSerGlyGlyProSer | p.H359delinsQKGRSGGPS | Q9NW68 | protein_coding | TCGA-A8-A07J-01 | Breast | breast invasive carcinoma | Female | <65 | I/II | Chemotherapy | 5-fluorouracil | CR | ||
| BSDC1 | insertion | Frame_Shift_Ins | novel | c.896_897insAGCGGGCGGAACAGAG | p.Ser299ArgfsTer21 | p.S299Rfs*21 | Q9NW68 | protein_coding | TCGA-A8-A07R-01 | Breast | breast invasive carcinoma | Female | >=65 | III/IV | Ancillary | zoledronic | SD | ||
| BSDC1 | SNV | Missense_Mutation | c.1114N>C | p.Glu372Gln | p.E372Q | Q9NW68 | protein_coding | tolerated(0.09) | probably_damaging(0.928) | TCGA-EA-A43B-01 | Cervix | cervical & endocervical cancer | Female | <65 | I/II | Chemotherapy | cisplatin | CR | |
| BSDC1 | SNV | Missense_Mutation | c.1351N>T | p.Gly451Cys | p.G451C | Q9NW68 | protein_coding | deleterious_low_confidence(0) | benign(0.416) | TCGA-EK-A2PM-01 | Cervix | cervical & endocervical cancer | Female | >=65 | I/II | Unknown | Unknown | SD | |
| BSDC1 | SNV | Missense_Mutation | c.328N>T | p.Pro110Ser | p.P110S | Q9NW68 | protein_coding | deleterious(0.01) | possibly_damaging(0.543) | TCGA-AA-3663-01 | Colorectum | colon adenocarcinoma | Male | <65 | I/II | Unknown | Unknown | SD |
| Page: 1 2 3 4 5 |
Top |
Related drugs of malignant transformation related genes |
| Identification of chemicals and drugs interact with genes involved in malignant transfromation |
| (DGIdb 4.0) |
| Entrez ID | Symbol | Category | Interaction Types | Drug Claim Name | Drug Name | PMIDs |
| Page: 1 |

Copyright 2023-Present -The University of Texas Health Science Center at Houston |