
|
|||||
|
 | |
| |
| |
| |
| |
| |
|
Gene: BSCL2 |
Gene summary for BSCL2 |
| Gene information | Species | Human | Gene symbol | BSCL2 | Gene ID | 26580 |
| Gene name | BSCL2 lipid droplet biogenesis associated, seipin | |
| Gene Alias | GNG3LG | |
| Cytomap | 11q12.3 | |
| Gene Type | protein-coding | GO ID | GO:0001659 | UniProtAcc | A0A024R540 |
Top |
Malignant transformation analysis |
| Identification of the aberrant gene expression in precancerous and cancerous lesions by comparing the gene expression of stem-like cells in diseased tissues with normal stem cells |
| Entrez ID | Symbol | Replicates | Species | Organ | Tissue | Adj P-value | Log2FC | Malignancy |
| 26580 | BSCL2 | HTA11_3410_2000001011 | Human | Colorectum | AD | 3.35e-15 | 2.88e-01 | 0.0155 |
| 26580 | BSCL2 | HTA11_2487_2000001011 | Human | Colorectum | SER | 6.13e-19 | 4.25e-01 | -0.1808 |
| 26580 | BSCL2 | HTA11_2951_2000001011 | Human | Colorectum | AD | 1.51e-11 | 5.62e-01 | 0.0216 |
| 26580 | BSCL2 | HTA11_1938_2000001011 | Human | Colorectum | AD | 2.77e-18 | 5.63e-01 | -0.0811 |
| 26580 | BSCL2 | HTA11_78_2000001011 | Human | Colorectum | AD | 8.38e-10 | 2.84e-01 | -0.1088 |
| 26580 | BSCL2 | HTA11_347_2000001011 | Human | Colorectum | AD | 3.42e-16 | 3.16e-01 | -0.1954 |
| 26580 | BSCL2 | HTA11_411_2000001011 | Human | Colorectum | SER | 2.50e-11 | 7.18e-01 | -0.2602 |
| 26580 | BSCL2 | HTA11_2112_2000001011 | Human | Colorectum | SER | 8.76e-08 | 4.80e-01 | -0.2196 |
| 26580 | BSCL2 | HTA11_3361_2000001011 | Human | Colorectum | AD | 5.46e-22 | 6.31e-01 | -0.1207 |
| 26580 | BSCL2 | HTA11_83_2000001011 | Human | Colorectum | SER | 2.70e-12 | 4.07e-01 | -0.1526 |
| 26580 | BSCL2 | HTA11_696_2000001011 | Human | Colorectum | AD | 3.10e-42 | 6.86e-01 | -0.1464 |
| 26580 | BSCL2 | HTA11_866_2000001011 | Human | Colorectum | AD | 1.63e-22 | 4.25e-01 | -0.1001 |
| 26580 | BSCL2 | HTA11_1391_2000001011 | Human | Colorectum | AD | 1.67e-29 | 6.25e-01 | -0.059 |
| 26580 | BSCL2 | HTA11_2992_2000001011 | Human | Colorectum | SER | 2.14e-07 | 3.79e-01 | -0.1706 |
| 26580 | BSCL2 | HTA11_5212_2000001011 | Human | Colorectum | AD | 1.00e-07 | 3.63e-01 | -0.2061 |
| 26580 | BSCL2 | HTA11_5216_2000001011 | Human | Colorectum | SER | 2.17e-09 | 4.66e-01 | -0.1462 |
| 26580 | BSCL2 | HTA11_546_2000001011 | Human | Colorectum | AD | 1.74e-13 | 4.15e-01 | -0.0842 |
| 26580 | BSCL2 | HTA11_9341_2000001011 | Human | Colorectum | SER | 5.61e-03 | 4.03e-01 | -0.00410000000000005 |
| 26580 | BSCL2 | HTA11_7862_2000001011 | Human | Colorectum | AD | 1.12e-06 | 2.70e-01 | -0.0179 |
| 26580 | BSCL2 | HTA11_866_3004761011 | Human | Colorectum | AD | 4.00e-26 | 5.41e-01 | 0.096 |
| Page: 1 2 3 4 5 6 |
| Tissue | Expression Dynamics | Abbreviation |
| Colorectum (GSE201348) |  | FAP: Familial adenomatous polyposis |
| CRC: Colorectal cancer | ||
| Colorectum (HTA11) |  | AD: Adenomas |
| SER: Sessile serrated lesions | ||
| MSI-H: Microsatellite-high colorectal cancer | ||
| MSS: Microsatellite stable colorectal cancer | ||
| Esophagus | 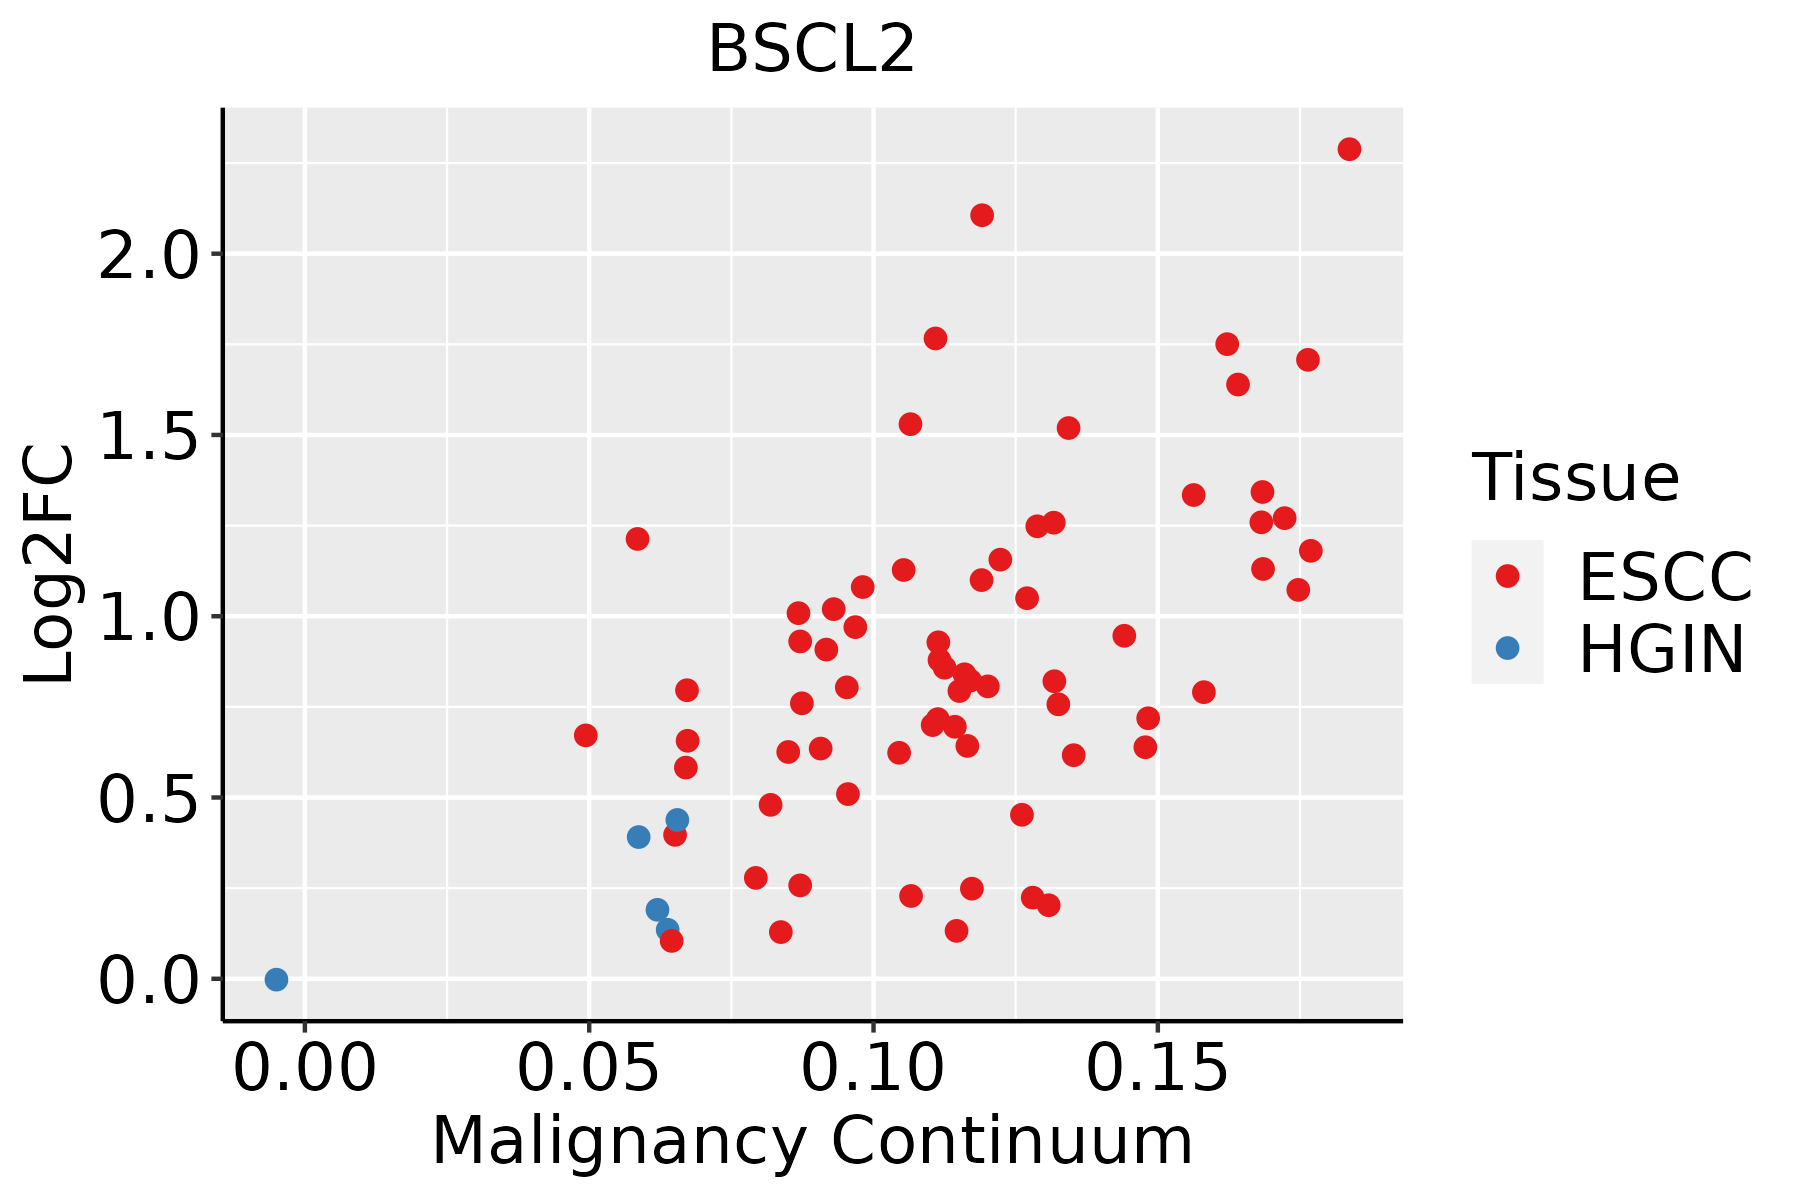 | ESCC: Esophageal squamous cell carcinoma |
| HGIN: High-grade intraepithelial neoplasias | ||
| LGIN: Low-grade intraepithelial neoplasias |
| ∗log2FC in expression of this searched gene in stem-like cells from each diseased tissue sample relative to stem-like cells in normal samples in each tissue plotted against the malignancy continuum. Samples are colored based on if they are from different disease stage. |
Top |
Malignant transformation related pathway analysis |
| Find out the enriched GO biological processes and KEGG pathways involved in transition from healthy to precancer to cancer |
| Tissue | Disease Stage | Enriched GO biological Processes |
| Colorectum | AD |  |
| Colorectum | SER |  |
| Colorectum | MSS |  |
| Colorectum | MSI-H |  |
| Colorectum | FAP |  |
| ∗Top 15 enriched GO BP terms are showed in the bar plot of each disease state in each tissue. Each row represents a significant GO biological process which is colored according to the -log10(p.adjust). |
| Page: 1 2 3 4 5 6 7 8 9 |
| GO ID | Tissue | Disease Stage | Description | Gene Ratio | Bg Ratio | pvalue | p.adjust | Count |
| GO:0009895 | Colorectum | AD | negative regulation of catabolic process | 124/3918 | 320/18723 | 1.66e-13 | 3.35e-11 | 124 |
| GO:0016042 | Colorectum | AD | lipid catabolic process | 97/3918 | 320/18723 | 4.31e-05 | 7.56e-04 | 97 |
| GO:0010876 | Colorectum | AD | lipid localization | 120/3918 | 448/18723 | 1.59e-03 | 1.33e-02 | 120 |
| GO:0120162 | Colorectum | AD | positive regulation of cold-induced thermogenesis | 32/3918 | 97/18723 | 3.74e-03 | 2.63e-02 | 32 |
| GO:0106106 | Colorectum | AD | cold-induced thermogenesis | 43/3918 | 144/18723 | 7.05e-03 | 4.31e-02 | 43 |
| GO:0120161 | Colorectum | AD | regulation of cold-induced thermogenesis | 43/3918 | 144/18723 | 7.05e-03 | 4.31e-02 | 43 |
| GO:1990845 | Colorectum | AD | adaptive thermogenesis | 46/3918 | 157/18723 | 7.97e-03 | 4.73e-02 | 46 |
| GO:00098951 | Colorectum | SER | negative regulation of catabolic process | 84/2897 | 320/18723 | 3.93e-07 | 2.06e-05 | 84 |
| GO:00160421 | Colorectum | SER | lipid catabolic process | 77/2897 | 320/18723 | 3.52e-05 | 9.18e-04 | 77 |
| GO:0045444 | Colorectum | SER | fat cell differentiation | 51/2897 | 229/18723 | 3.96e-03 | 3.26e-02 | 51 |
| GO:00098952 | Colorectum | MSS | negative regulation of catabolic process | 110/3467 | 320/18723 | 7.88e-12 | 1.20e-09 | 110 |
| GO:00108761 | Colorectum | MSS | lipid localization | 104/3467 | 448/18723 | 6.76e-03 | 4.38e-02 | 104 |
| GO:00160422 | Colorectum | MSS | lipid catabolic process | 77/3467 | 320/18723 | 7.43e-03 | 4.71e-02 | 77 |
| GO:00098953 | Colorectum | MSI-H | negative regulation of catabolic process | 46/1319 | 320/18723 | 3.00e-06 | 1.68e-04 | 46 |
| GO:000989520 | Esophagus | HGIN | negative regulation of catabolic process | 87/2587 | 320/18723 | 1.74e-10 | 1.68e-08 | 87 |
| GO:005123520 | Esophagus | HGIN | maintenance of location | 73/2587 | 327/18723 | 1.73e-05 | 4.71e-04 | 73 |
| GO:0009895111 | Esophagus | ESCC | negative regulation of catabolic process | 201/8552 | 320/18723 | 3.88e-10 | 1.05e-08 | 201 |
| GO:0051235110 | Esophagus | ESCC | maintenance of location | 200/8552 | 327/18723 | 1.01e-08 | 2.02e-07 | 200 |
| GO:00454449 | Esophagus | ESCC | fat cell differentiation | 135/8552 | 229/18723 | 3.38e-05 | 2.78e-04 | 135 |
| GO:00199155 | Esophagus | ESCC | lipid storage | 58/8552 | 87/18723 | 6.15e-05 | 4.72e-04 | 58 |
| Page: 1 2 |
| Pathway ID | Tissue | Disease Stage | Description | Gene Ratio | Bg Ratio | pvalue | p.adjust | qvalue | Count |
| Page: 1 |
Top |
Cell-cell communication analysis |
| Identification of potential cell-cell interactions between two cell types and their ligand-receptor pairs for different disease states |
| Ligand | Receptor | LRpair | Pathway | Tissue | Disease Stage |
| Page: 1 |
Top |
Single-cell gene regulatory network inference analysis |
| Find out the significant the regulons (TFs) and the target genes of each regulon across cell types for different disease states |
| TF | Cell Type | Tissue | Disease Stage | Target Gene | RSS | Regulon Activity |
| ∗The dot plots of a searched regulon are shown for all cell subpopulations in each disease state of each tissue based on the regulon specific score inferred using pySCENIC and by calculating the average expression. |
| Page: 1 |
Top |
Somatic mutation of malignant transformation related genes |
| Annotation of somatic variants for genes involved in malignant transformation |
| Hugo Symbol | Variant Class | Variant Classification | dbSNP RS | HGVSc | HGVSp | HGVSp Short | SWISSPROT | BIOTYPE | SIFT | PolyPhen | Tumor Sample Barcode | Tissue | Histology | Sex | Age | Stage | Therapy Types | Drugs | Outcome |
| BSCL2 | SNV | Missense_Mutation | rs781147014 | c.511N>T | p.Arg171Cys | p.R171C | Q96G97 | protein_coding | deleterious(0) | possibly_damaging(0.899) | TCGA-AN-A046-01 | Breast | breast invasive carcinoma | Female | >=65 | I/II | Unknown | Unknown | SD |
| BSCL2 | SNV | Missense_Mutation | c.1183N>A | p.Asp395Asn | p.D395N | Q96G97 | protein_coding | tolerated(0.07) | benign(0.3) | TCGA-BH-A0DK-01 | Breast | breast invasive carcinoma | Female | <65 | I/II | Hormone Therapy | tamoxiphen | SD | |
| BSCL2 | SNV | Missense_Mutation | c.1078N>A | p.Glu360Lys | p.E360K | Q96G97 | protein_coding | tolerated(0.64) | benign(0) | TCGA-BH-A0DK-01 | Breast | breast invasive carcinoma | Female | <65 | I/II | Hormone Therapy | tamoxiphen | SD | |
| BSCL2 | SNV | Missense_Mutation | rs142608646 | c.836N>A | p.Arg279His | p.R279H | Q96G97 | protein_coding | tolerated(0.17) | possibly_damaging(0.857) | TCGA-C8-A134-01 | Breast | breast invasive carcinoma | Female | <65 | I/II | Chemotherapy | 5-fluorouracil | CR |
| BSCL2 | insertion | Frame_Shift_Ins | rs749890533 | c.974_975insG | p.Ile326HisfsTer12 | p.I326Hfs*12 | Q96G97 | protein_coding | TCGA-AN-A0FY-01 | Breast | breast invasive carcinoma | Female | <65 | I/II | Unknown | Unknown | SD | ||
| BSCL2 | SNV | Missense_Mutation | rs781147014 | c.511C>T | p.Arg171Cys | p.R171C | Q96G97 | protein_coding | deleterious(0) | possibly_damaging(0.899) | TCGA-EA-A5FO-01 | Cervix | cervical & endocervical cancer | Female | <65 | I/II | Unknown | Unknown | SD |
| BSCL2 | SNV | Missense_Mutation | rs879253900 | c.409N>A | p.Asp137Asn | p.D137N | Q96G97 | protein_coding | deleterious(0.01) | probably_damaging(0.975) | TCGA-EK-A2RM-01 | Cervix | cervical & endocervical cancer | Female | <65 | I/II | Unknown | Unknown | SD |
| BSCL2 | insertion | In_Frame_Ins | novel | c.124_125insCAC | p.Trp41_Arg42insPro | p.W41_R42insP | Q96G97 | protein_coding | TCGA-ZJ-A8QO-01 | Cervix | cervical & endocervical cancer | Female | >=65 | I/II | Unknown | Unknown | SD | ||
| BSCL2 | SNV | Missense_Mutation | rs878855171 | c.505C>T | p.Pro169Ser | p.P169S | Q96G97 | protein_coding | tolerated(0.05) | possibly_damaging(0.743) | TCGA-A6-6781-01 | Colorectum | colon adenocarcinoma | Male | <65 | III/IV | Chemotherapy | oxaliplatin | SD |
| BSCL2 | SNV | Missense_Mutation | c.445N>T | p.Pro149Ser | p.P149S | Q96G97 | protein_coding | deleterious(0) | probably_damaging(0.999) | TCGA-AA-3672-01 | Colorectum | colon adenocarcinoma | Female | >=65 | III/IV | Unknown | Unknown | SD |
| Page: 1 2 3 4 5 |
Top |
Related drugs of malignant transformation related genes |
| Identification of chemicals and drugs interact with genes involved in malignant transfromation |
| (DGIdb 4.0) |
| Entrez ID | Symbol | Category | Interaction Types | Drug Claim Name | Drug Name | PMIDs |
| Page: 1 |

Copyright 2023-Present -The University of Texas Health Science Center at Houston |