
|
|||||
|
 | |
| |
| |
| |
| |
| |
|
Gene: BRWD3 |
Gene summary for BRWD3 |
| Gene information | Species | Human | Gene symbol | BRWD3 | Gene ID | 254065 |
| Gene name | bromodomain and WD repeat domain containing 3 | |
| Gene Alias | BRODL | |
| Cytomap | Xq21.1 | |
| Gene Type | protein-coding | GO ID | GO:0000902 | UniProtAcc | Q6RI45 |
Top |
Malignant transformation analysis |
| Identification of the aberrant gene expression in precancerous and cancerous lesions by comparing the gene expression of stem-like cells in diseased tissues with normal stem cells |
| Entrez ID | Symbol | Replicates | Species | Organ | Tissue | Adj P-value | Log2FC | Malignancy |
| 254065 | BRWD3 | HCC1_Meng | Human | Liver | HCC | 6.07e-22 | 5.89e-02 | 0.0246 |
| 254065 | BRWD3 | HCC2_Meng | Human | Liver | HCC | 1.00e-18 | 1.90e-01 | 0.0107 |
| 254065 | BRWD3 | HCC1 | Human | Liver | HCC | 4.06e-04 | 3.30e+00 | 0.5336 |
| 254065 | BRWD3 | HCC2 | Human | Liver | HCC | 7.55e-14 | 2.97e+00 | 0.5341 |
| 254065 | BRWD3 | S014 | Human | Liver | HCC | 1.06e-04 | 2.88e-01 | 0.2254 |
| 254065 | BRWD3 | S027 | Human | Liver | HCC | 2.66e-05 | 6.54e-01 | 0.2446 |
| 254065 | BRWD3 | S028 | Human | Liver | HCC | 1.84e-06 | 3.93e-01 | 0.2503 |
| 254065 | BRWD3 | S029 | Human | Liver | HCC | 3.86e-05 | 3.30e-01 | 0.2581 |
| 254065 | BRWD3 | RNA-P17T-P17T-4 | Human | Lung | IAC | 3.62e-02 | 4.55e-01 | 0.343 |
| 254065 | BRWD3 | RNA-P17T-P17T-6 | Human | Lung | IAC | 1.65e-05 | 5.46e-01 | 0.3385 |
| 254065 | BRWD3 | RNA-P17T-P17T-8 | Human | Lung | IAC | 3.32e-04 | 5.56e-01 | 0.3329 |
| 254065 | BRWD3 | RNA-P25T1-P25T1-4 | Human | Lung | AIS | 3.19e-05 | 4.04e-01 | -0.2119 |
| 254065 | BRWD3 | RNA-P6T2-P6T2-2 | Human | Lung | IAC | 2.06e-04 | 2.39e-01 | -0.0132 |
| 254065 | BRWD3 | RNA-P6T2-P6T2-3 | Human | Lung | IAC | 4.91e-08 | 3.26e-01 | -0.013 |
| 254065 | BRWD3 | RNA-P6T2-P6T2-4 | Human | Lung | IAC | 3.44e-02 | 2.55e-01 | -0.0121 |
| 254065 | BRWD3 | HTA12-15-2 | Human | Pancreas | PDAC | 2.48e-02 | 2.69e-01 | 0.2315 |
| 254065 | BRWD3 | HTA12-23-1 | Human | Pancreas | PDAC | 1.47e-02 | 5.41e-01 | 0.3405 |
| 254065 | BRWD3 | HTA12-26-1 | Human | Pancreas | PDAC | 6.36e-12 | 6.05e-01 | 0.3728 |
| 254065 | BRWD3 | HTA12-29-1 | Human | Pancreas | PDAC | 2.24e-16 | 3.94e-01 | 0.3722 |
| 254065 | BRWD3 | male-WTA | Human | Thyroid | PTC | 8.47e-06 | 6.97e-02 | 0.1037 |
| Page: 1 2 |
| Tissue | Expression Dynamics | Abbreviation |
| Liver |  | HCC: Hepatocellular carcinoma |
| NAFLD: Non-alcoholic fatty liver disease | ||
| Lung |  | AAH: Atypical adenomatous hyperplasia |
| AIS: Adenocarcinoma in situ | ||
| IAC: Invasive lung adenocarcinoma | ||
| MIA: Minimally invasive adenocarcinoma | ||
| Thyroid | 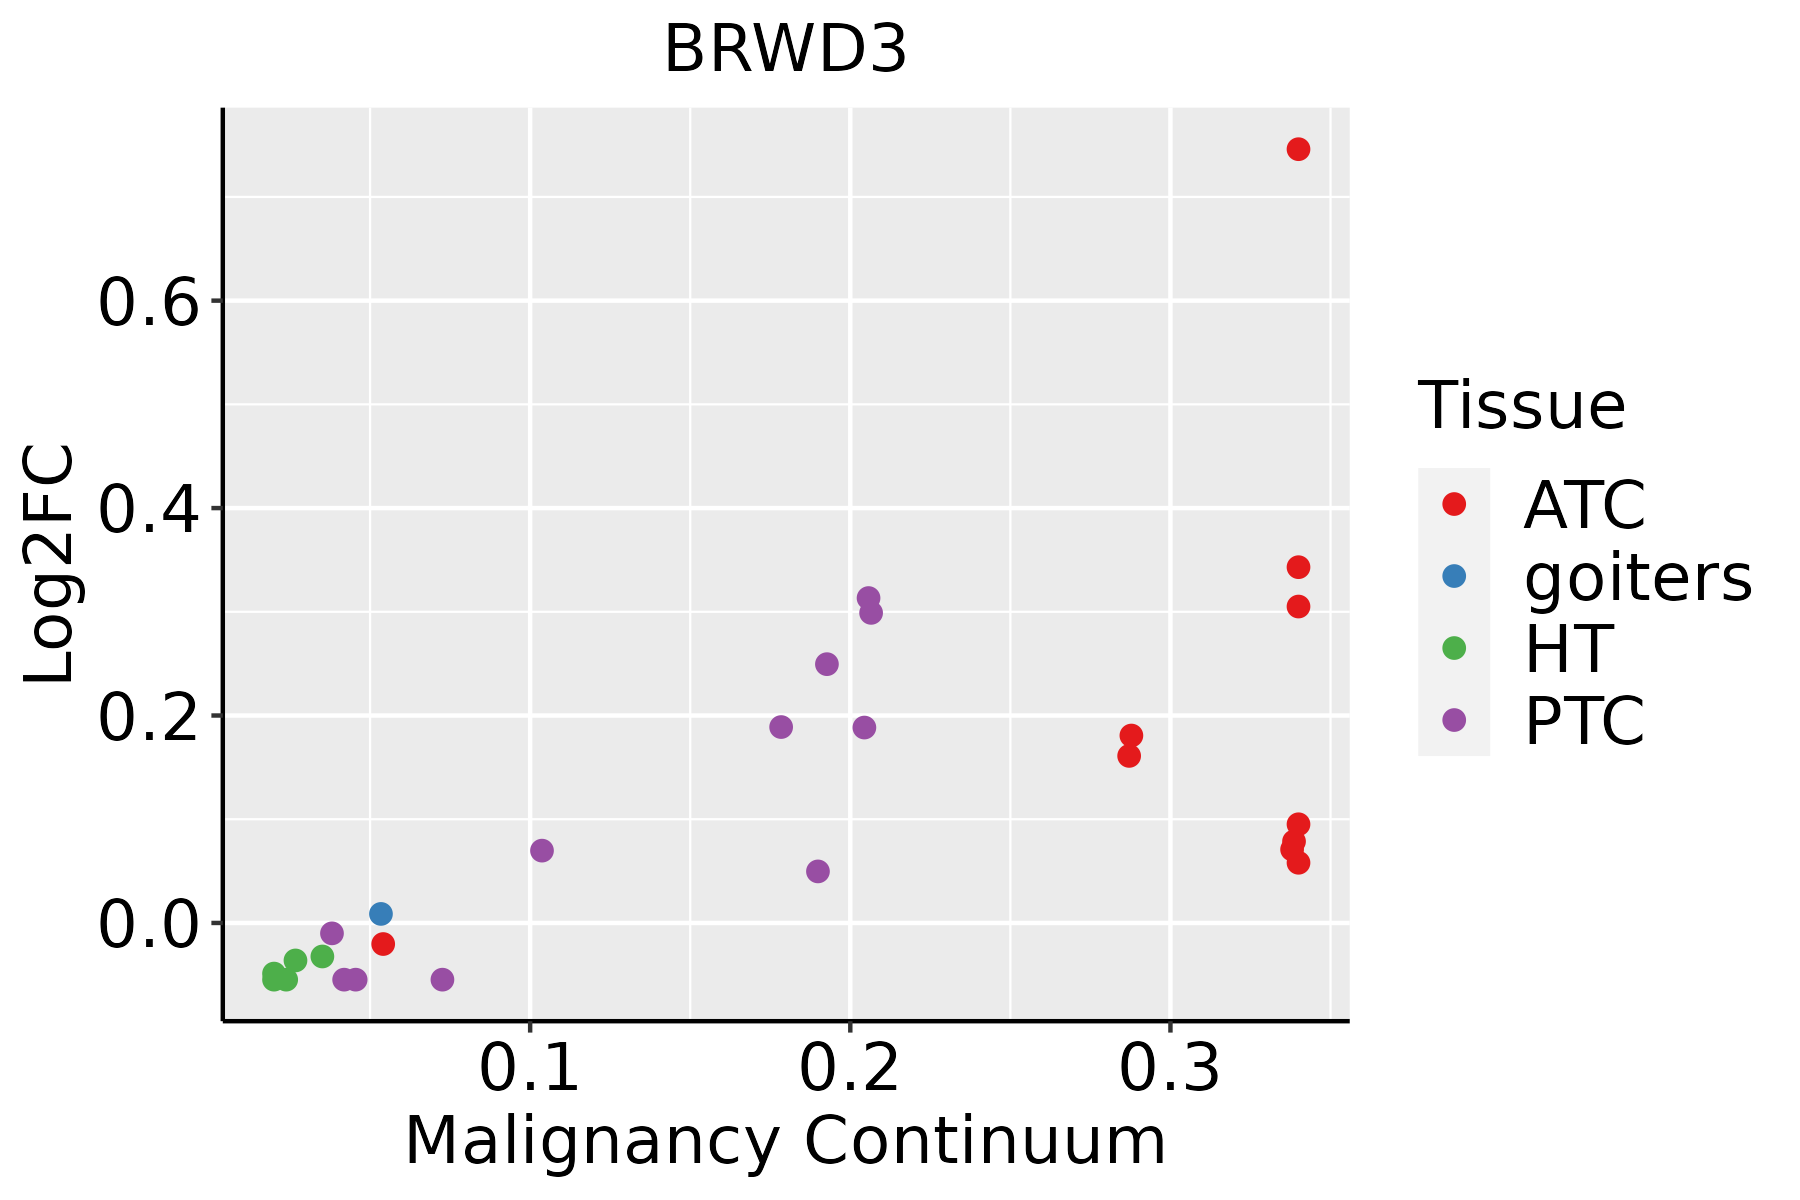 | ATC: Anaplastic thyroid cancer |
| HT: Hashimoto's thyroiditis | ||
| PTC: Papillary thyroid cancer |
| ∗log2FC in expression of this searched gene in stem-like cells from each diseased tissue sample relative to stem-like cells in normal samples in each tissue plotted against the malignancy continuum. Samples are colored based on if they are from different disease stage. |
Top |
Malignant transformation related pathway analysis |
| Find out the enriched GO biological processes and KEGG pathways involved in transition from healthy to precancer to cancer |
| Tissue | Disease Stage | Enriched GO biological Processes |
| Colorectum | AD |  |
| Colorectum | SER |  |
| Colorectum | MSS |  |
| Colorectum | MSI-H |  |
| Colorectum | FAP |  |
| ∗Top 15 enriched GO BP terms are showed in the bar plot of each disease state in each tissue. Each row represents a significant GO biological process which is colored according to the -log10(p.adjust). |
| Page: 1 2 3 4 5 6 7 8 9 |
| GO ID | Tissue | Disease Stage | Description | Gene Ratio | Bg Ratio | pvalue | p.adjust | Count |
| GO:002260422 | Liver | HCC | regulation of cell morphogenesis | 188/7958 | 309/18723 | 4.84e-11 | 1.82e-09 | 188 |
| GO:000836022 | Liver | HCC | regulation of cell shape | 92/7958 | 154/18723 | 1.15e-05 | 1.31e-04 | 92 |
| GO:00226048 | Lung | IAC | regulation of cell morphogenesis | 74/2061 | 309/18723 | 6.31e-11 | 1.70e-08 | 74 |
| GO:00083607 | Lung | IAC | regulation of cell shape | 37/2061 | 154/18723 | 3.35e-06 | 1.42e-04 | 37 |
| GO:002260413 | Lung | AIS | regulation of cell morphogenesis | 65/1849 | 309/18723 | 2.97e-09 | 5.09e-07 | 65 |
| GO:000836013 | Lung | AIS | regulation of cell shape | 32/1849 | 154/18723 | 3.75e-05 | 1.14e-03 | 32 |
| GO:0022604112 | Thyroid | PTC | regulation of cell morphogenesis | 165/5968 | 309/18723 | 2.60e-15 | 1.82e-13 | 165 |
| GO:0008360111 | Thyroid | PTC | regulation of cell shape | 86/5968 | 154/18723 | 6.22e-10 | 1.95e-08 | 86 |
| GO:002260429 | Thyroid | ATC | regulation of cell morphogenesis | 171/6293 | 309/18723 | 2.36e-15 | 1.70e-13 | 171 |
| GO:000836026 | Thyroid | ATC | regulation of cell shape | 91/6293 | 154/18723 | 7.33e-11 | 2.31e-09 | 91 |
| Page: 1 |
| Pathway ID | Tissue | Disease Stage | Description | Gene Ratio | Bg Ratio | pvalue | p.adjust | qvalue | Count |
| Page: 1 |
Top |
Cell-cell communication analysis |
| Identification of potential cell-cell interactions between two cell types and their ligand-receptor pairs for different disease states |
| Ligand | Receptor | LRpair | Pathway | Tissue | Disease Stage |
| Page: 1 |
Top |
Single-cell gene regulatory network inference analysis |
| Find out the significant the regulons (TFs) and the target genes of each regulon across cell types for different disease states |
| TF | Cell Type | Tissue | Disease Stage | Target Gene | RSS | Regulon Activity |
| ∗The dot plots of a searched regulon are shown for all cell subpopulations in each disease state of each tissue based on the regulon specific score inferred using pySCENIC and by calculating the average expression. |
| Page: 1 |
Top |
Somatic mutation of malignant transformation related genes |
| Annotation of somatic variants for genes involved in malignant transformation |
| Hugo Symbol | Variant Class | Variant Classification | dbSNP RS | HGVSc | HGVSp | HGVSp Short | SWISSPROT | BIOTYPE | SIFT | PolyPhen | Tumor Sample Barcode | Tissue | Histology | Sex | Age | Stage | Therapy Types | Drugs | Outcome |
| BRWD3 | SNV | Missense_Mutation | novel | c.1059N>C | p.Glu353Asp | p.E353D | Q6RI45 | protein_coding | deleterious(0.01) | possibly_damaging(0.477) | TCGA-A7-A4SA-01 | Breast | breast invasive carcinoma | Female | <65 | I/II | Chemotherapy | doxorubicin | CR |
| BRWD3 | SNV | Missense_Mutation | c.5097N>T | p.Arg1699Ser | p.R1699S | Q6RI45 | protein_coding | tolerated_low_confidence(0.08) | possibly_damaging(0.879) | TCGA-A8-A08T-01 | Breast | breast invasive carcinoma | Female | <65 | III/IV | Unknown | Unknown | PD | |
| BRWD3 | SNV | Missense_Mutation | c.980N>A | p.Ser327Asn | p.S327N | Q6RI45 | protein_coding | deleterious(0.04) | probably_damaging(0.967) | TCGA-A8-A09W-01 | Breast | breast invasive carcinoma | Female | >=65 | III/IV | Unknown | Unknown | SD | |
| BRWD3 | SNV | Missense_Mutation | rs774748578 | c.1151N>C | p.Arg384Pro | p.R384P | Q6RI45 | protein_coding | deleterious(0) | probably_damaging(0.988) | TCGA-AC-A23H-01 | Breast | breast invasive carcinoma | Female | >=65 | I/II | Unknown | Unknown | PD |
| BRWD3 | SNV | Missense_Mutation | novel | c.5359A>G | p.Lys1787Glu | p.K1787E | Q6RI45 | protein_coding | deleterious_low_confidence(0) | benign(0.264) | TCGA-AN-A046-01 | Breast | breast invasive carcinoma | Female | >=65 | I/II | Unknown | Unknown | SD |
| BRWD3 | SNV | Missense_Mutation | c.919C>T | p.Arg307Cys | p.R307C | Q6RI45 | protein_coding | deleterious(0.03) | probably_damaging(0.943) | TCGA-AN-A046-01 | Breast | breast invasive carcinoma | Female | >=65 | I/II | Unknown | Unknown | SD | |
| BRWD3 | SNV | Missense_Mutation | c.2351G>T | p.Arg784Leu | p.R784L | Q6RI45 | protein_coding | tolerated(0.1) | benign(0.003) | TCGA-BH-A0HF-01 | Breast | breast invasive carcinoma | Female | >=65 | I/II | Hormone Therapy | arimidex | SD | |
| BRWD3 | SNV | Missense_Mutation | c.1489N>T | p.Arg497Trp | p.R497W | Q6RI45 | protein_coding | tolerated(0.06) | possibly_damaging(0.881) | TCGA-BH-A0HK-01 | Breast | breast invasive carcinoma | Female | >=65 | I/II | Hormone Therapy | arimidex | SD | |
| BRWD3 | SNV | Missense_Mutation | c.1771N>C | p.Asp591His | p.D591H | Q6RI45 | protein_coding | deleterious(0) | probably_damaging(0.996) | TCGA-BH-A18P-01 | Breast | breast invasive carcinoma | Female | <65 | I/II | Unknown | Unknown | PD | |
| BRWD3 | SNV | Missense_Mutation | novel | c.2360N>A | p.Arg787His | p.R787H | Q6RI45 | protein_coding | deleterious(0.03) | benign(0.022) | TCGA-BH-A8FY-01 | Breast | breast invasive carcinoma | Female | >=65 | I/II | Unknown | Unknown | SD |
| Page: 1 2 3 4 5 6 7 8 9 10 11 12 13 14 15 16 17 18 19 20 21 22 23 24 25 26 27 28 29 30 31 32 33 34 35 |
Top |
Related drugs of malignant transformation related genes |
| Identification of chemicals and drugs interact with genes involved in malignant transfromation |
| (DGIdb 4.0) |
| Entrez ID | Symbol | Category | Interaction Types | Drug Claim Name | Drug Name | PMIDs |
| Page: 1 |

Copyright 2023-Present -The University of Texas Health Science Center at Houston |