| Tissue | Expression Dynamics | Abbreviation |
| Cervix | 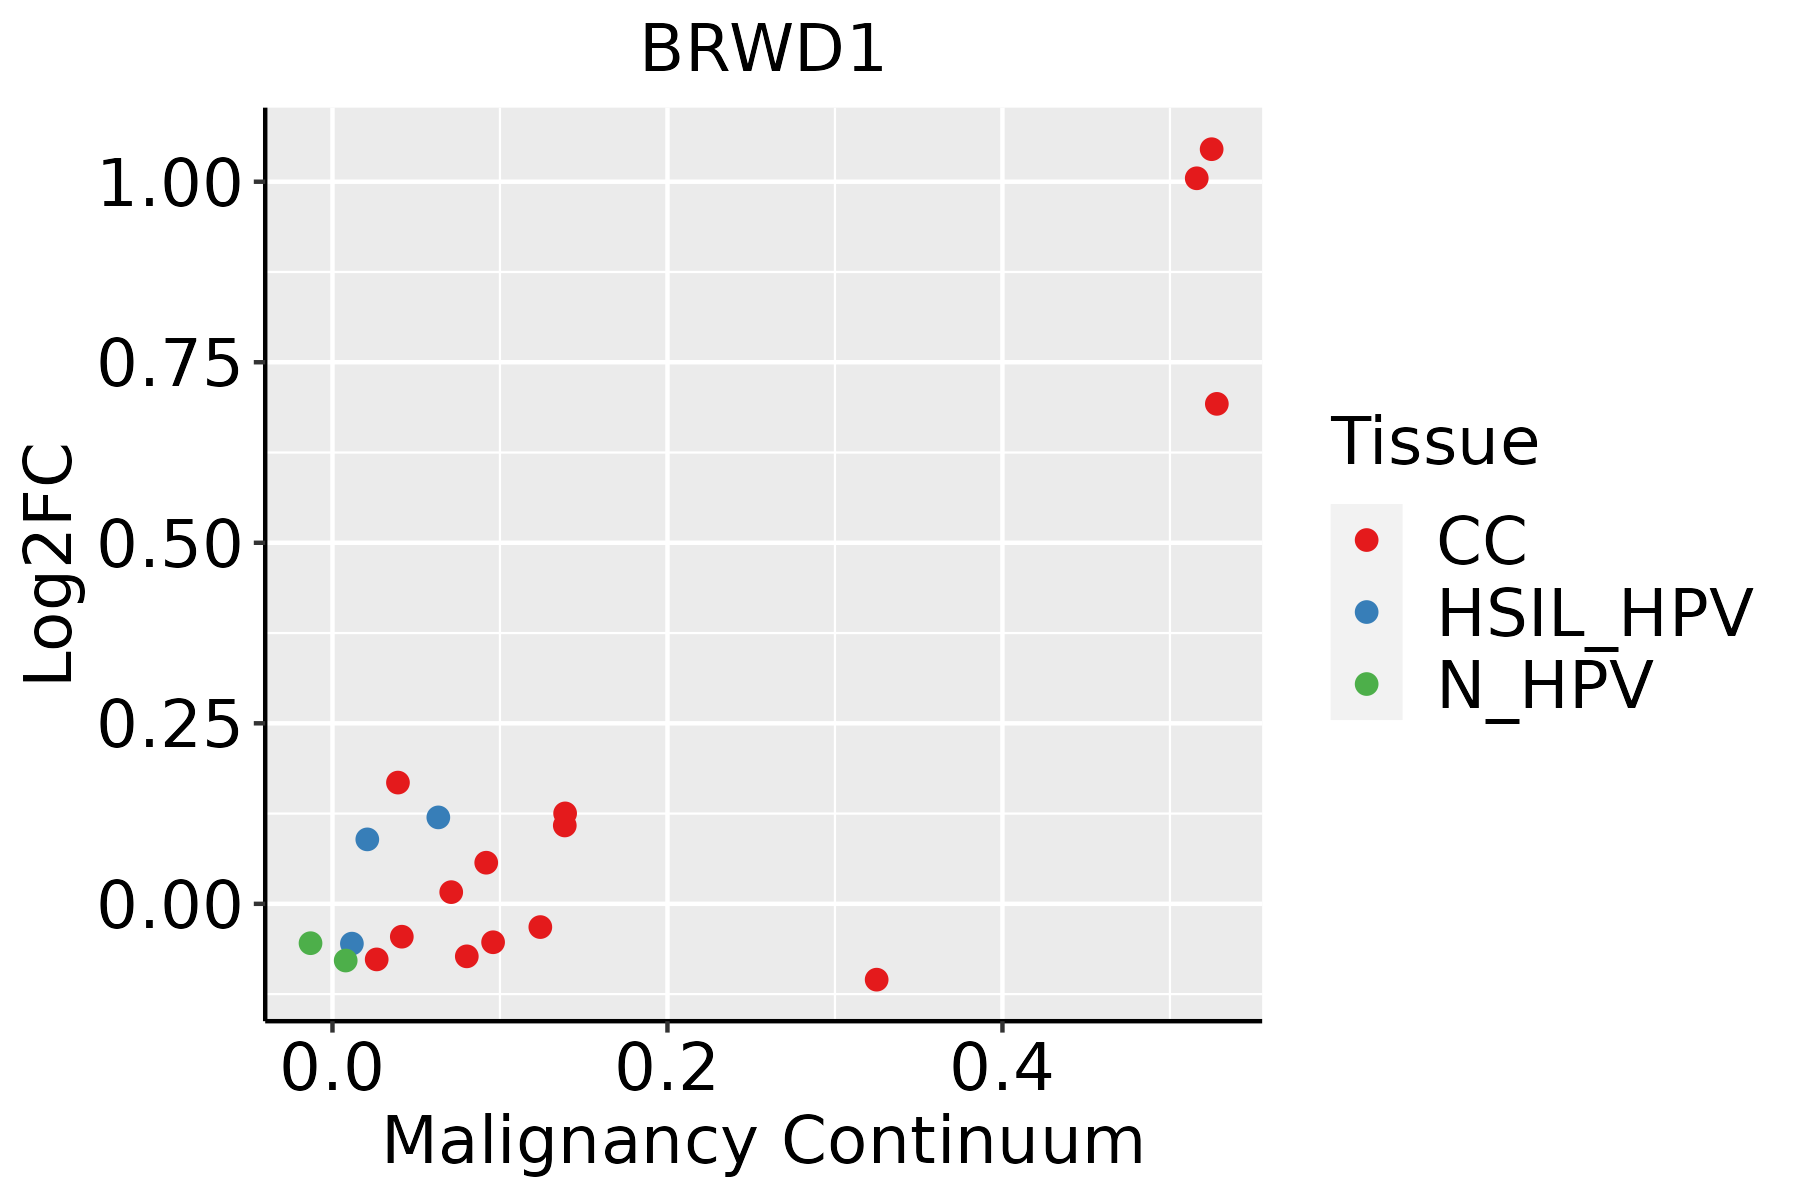 | CC: Cervix cancer |
| HSIL_HPV: HPV-infected high-grade squamous intraepithelial lesions |
| N_HPV: HPV-infected normal cervix |
| Colorectum (GSE201348) |  | FAP: Familial adenomatous polyposis |
| CRC: Colorectal cancer |
| Colorectum (HTA11) |  | AD: Adenomas |
| SER: Sessile serrated lesions |
| MSI-H: Microsatellite-high colorectal cancer |
| MSS: Microsatellite stable colorectal cancer |
| Esophagus | 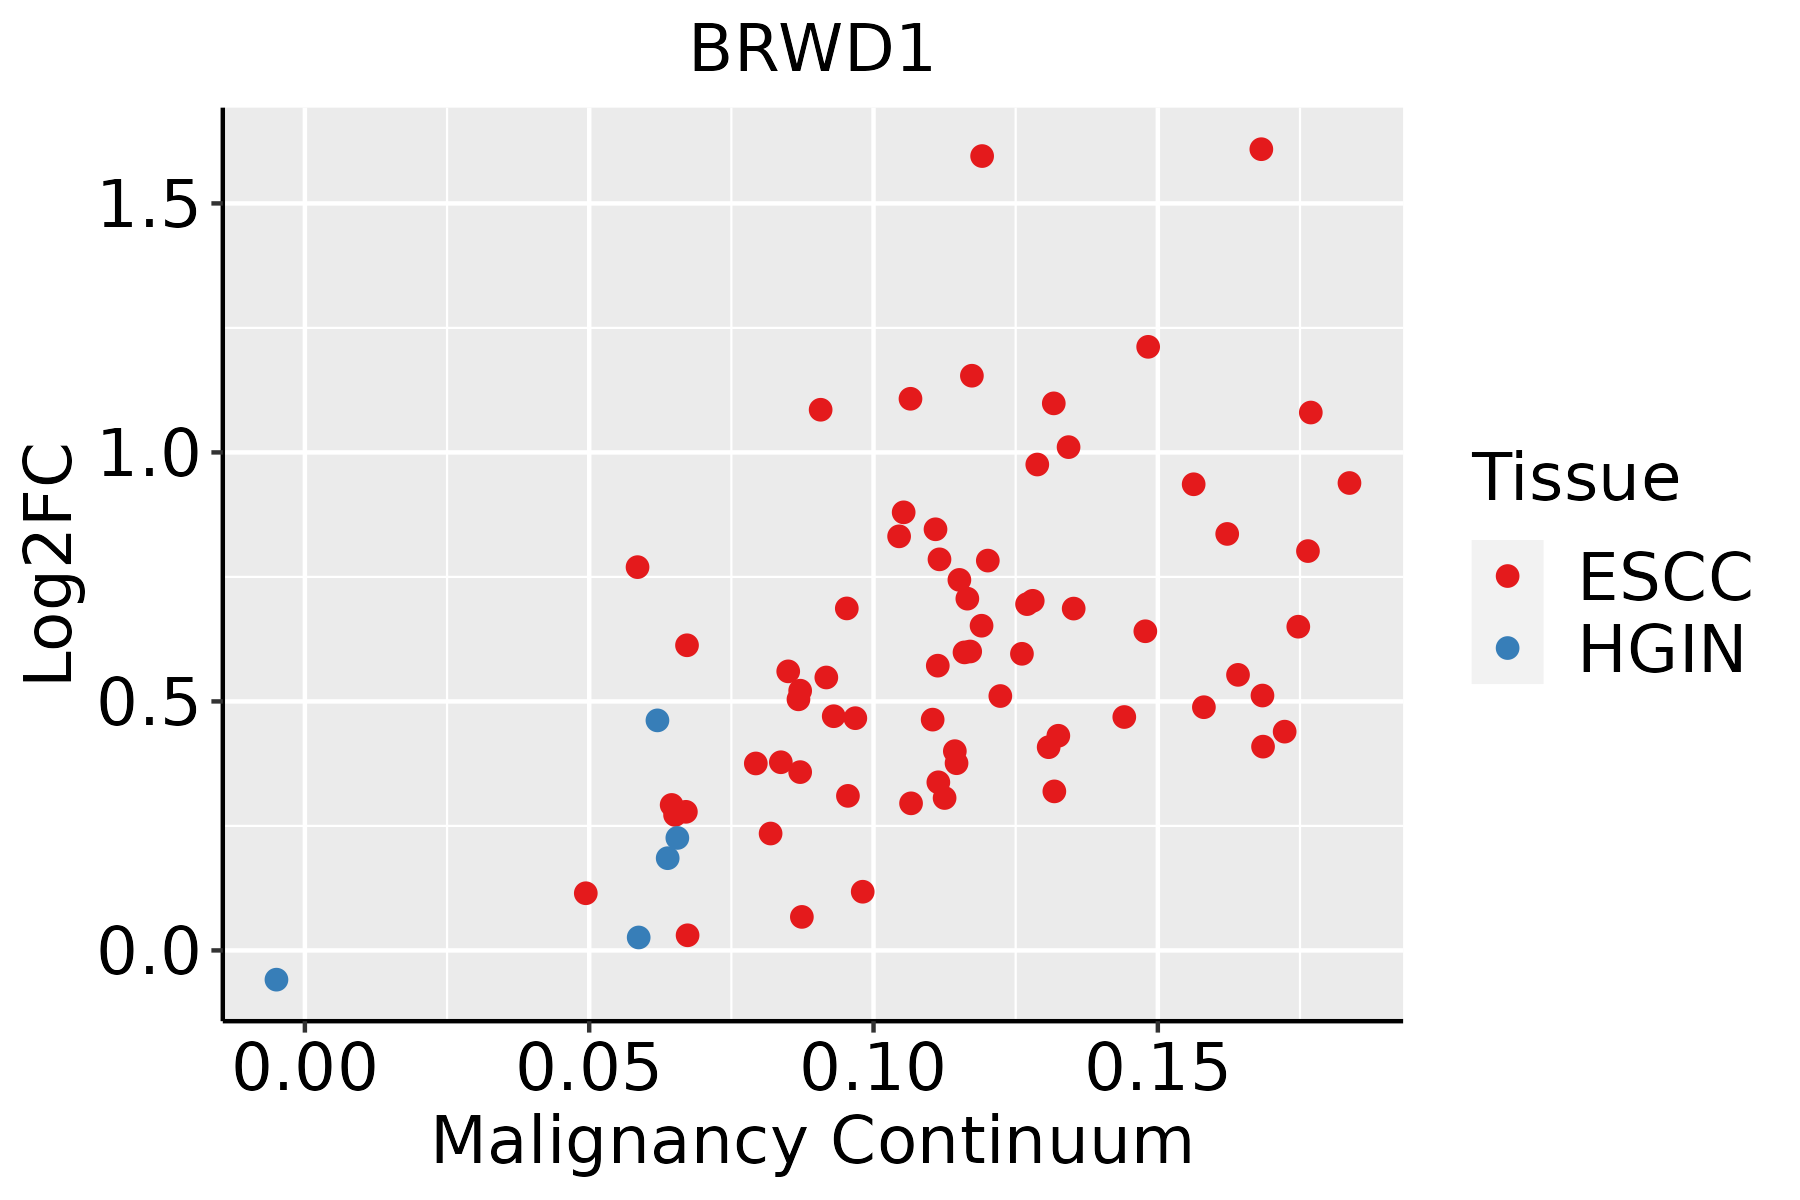 | ESCC: Esophageal squamous cell carcinoma |
| HGIN: High-grade intraepithelial neoplasias |
| LGIN: Low-grade intraepithelial neoplasias |
| Liver |  | HCC: Hepatocellular carcinoma |
| NAFLD: Non-alcoholic fatty liver disease |
| Lung | 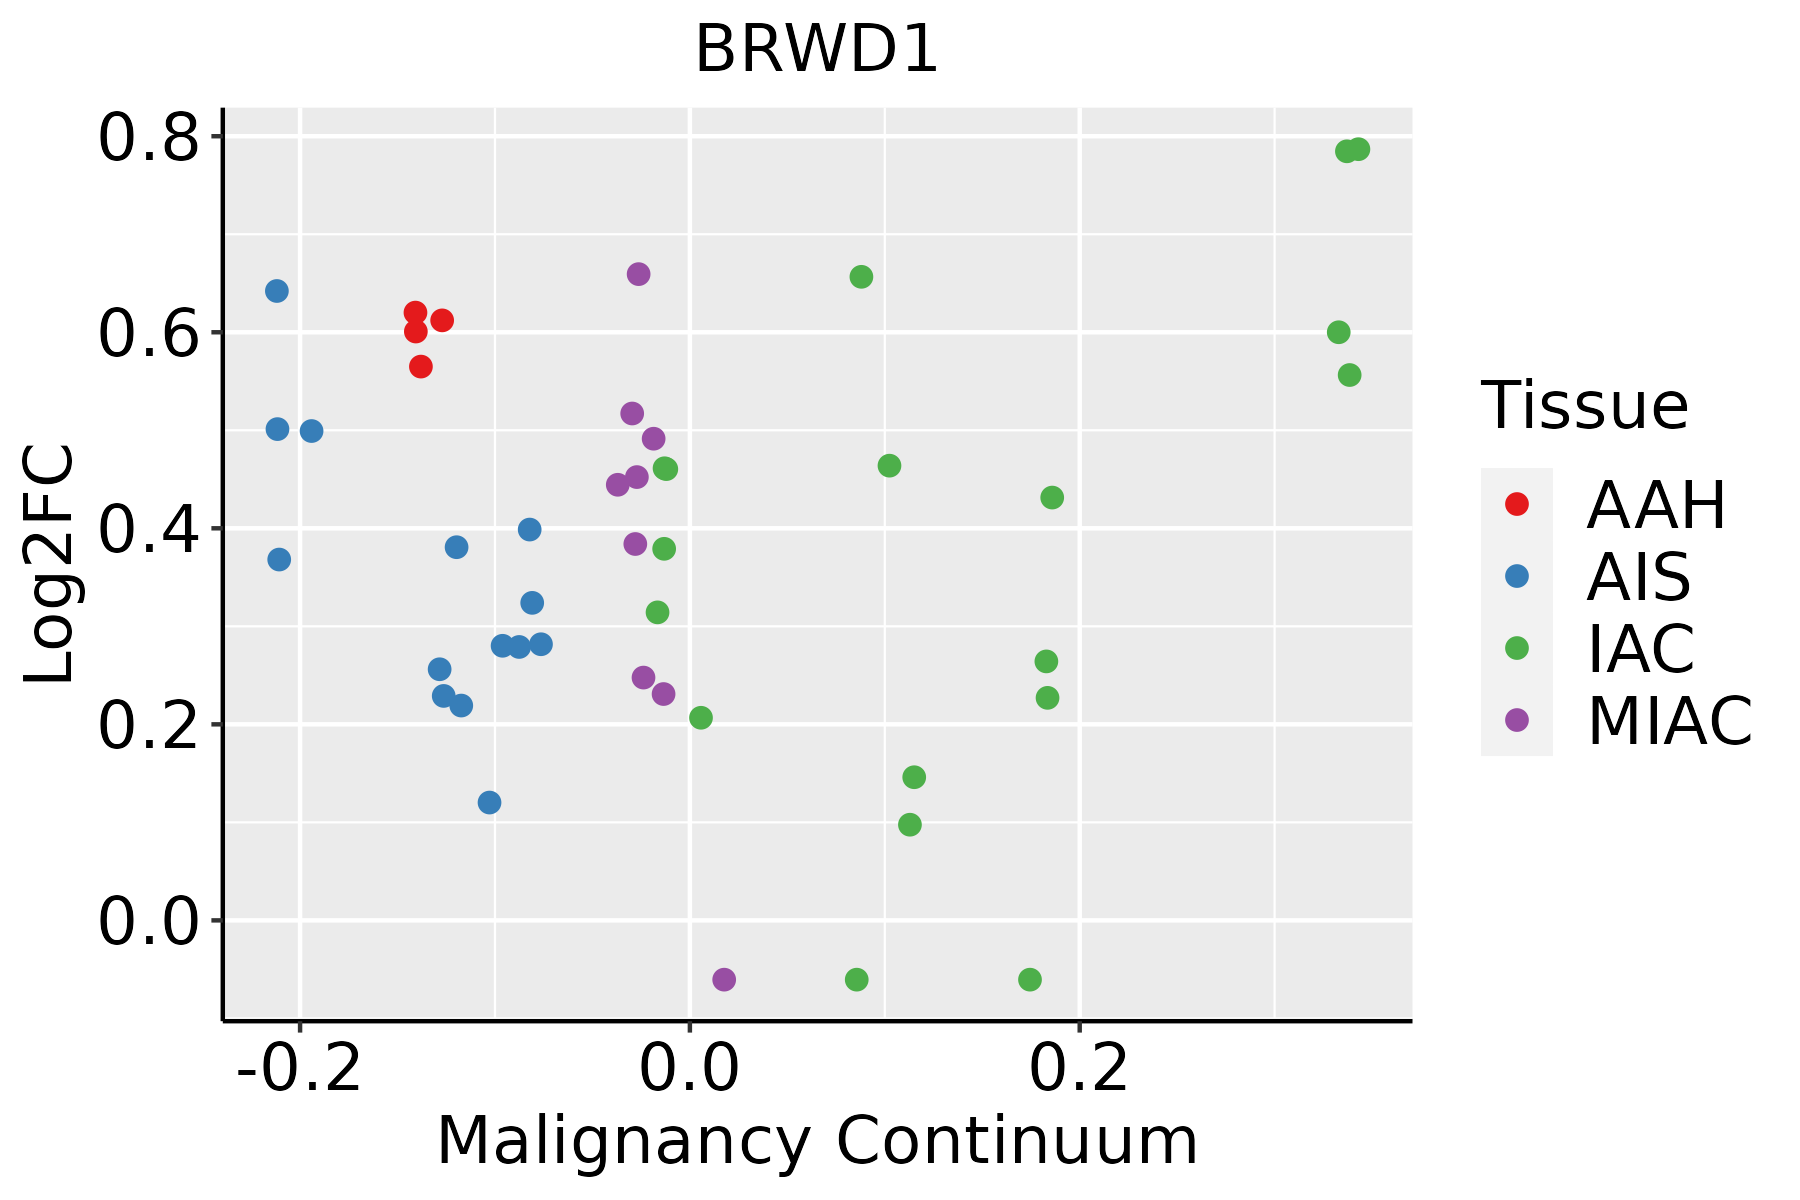 | AAH: Atypical adenomatous hyperplasia |
| AIS: Adenocarcinoma in situ |
| IAC: Invasive lung adenocarcinoma |
| MIA: Minimally invasive adenocarcinoma |
| Oral Cavity | 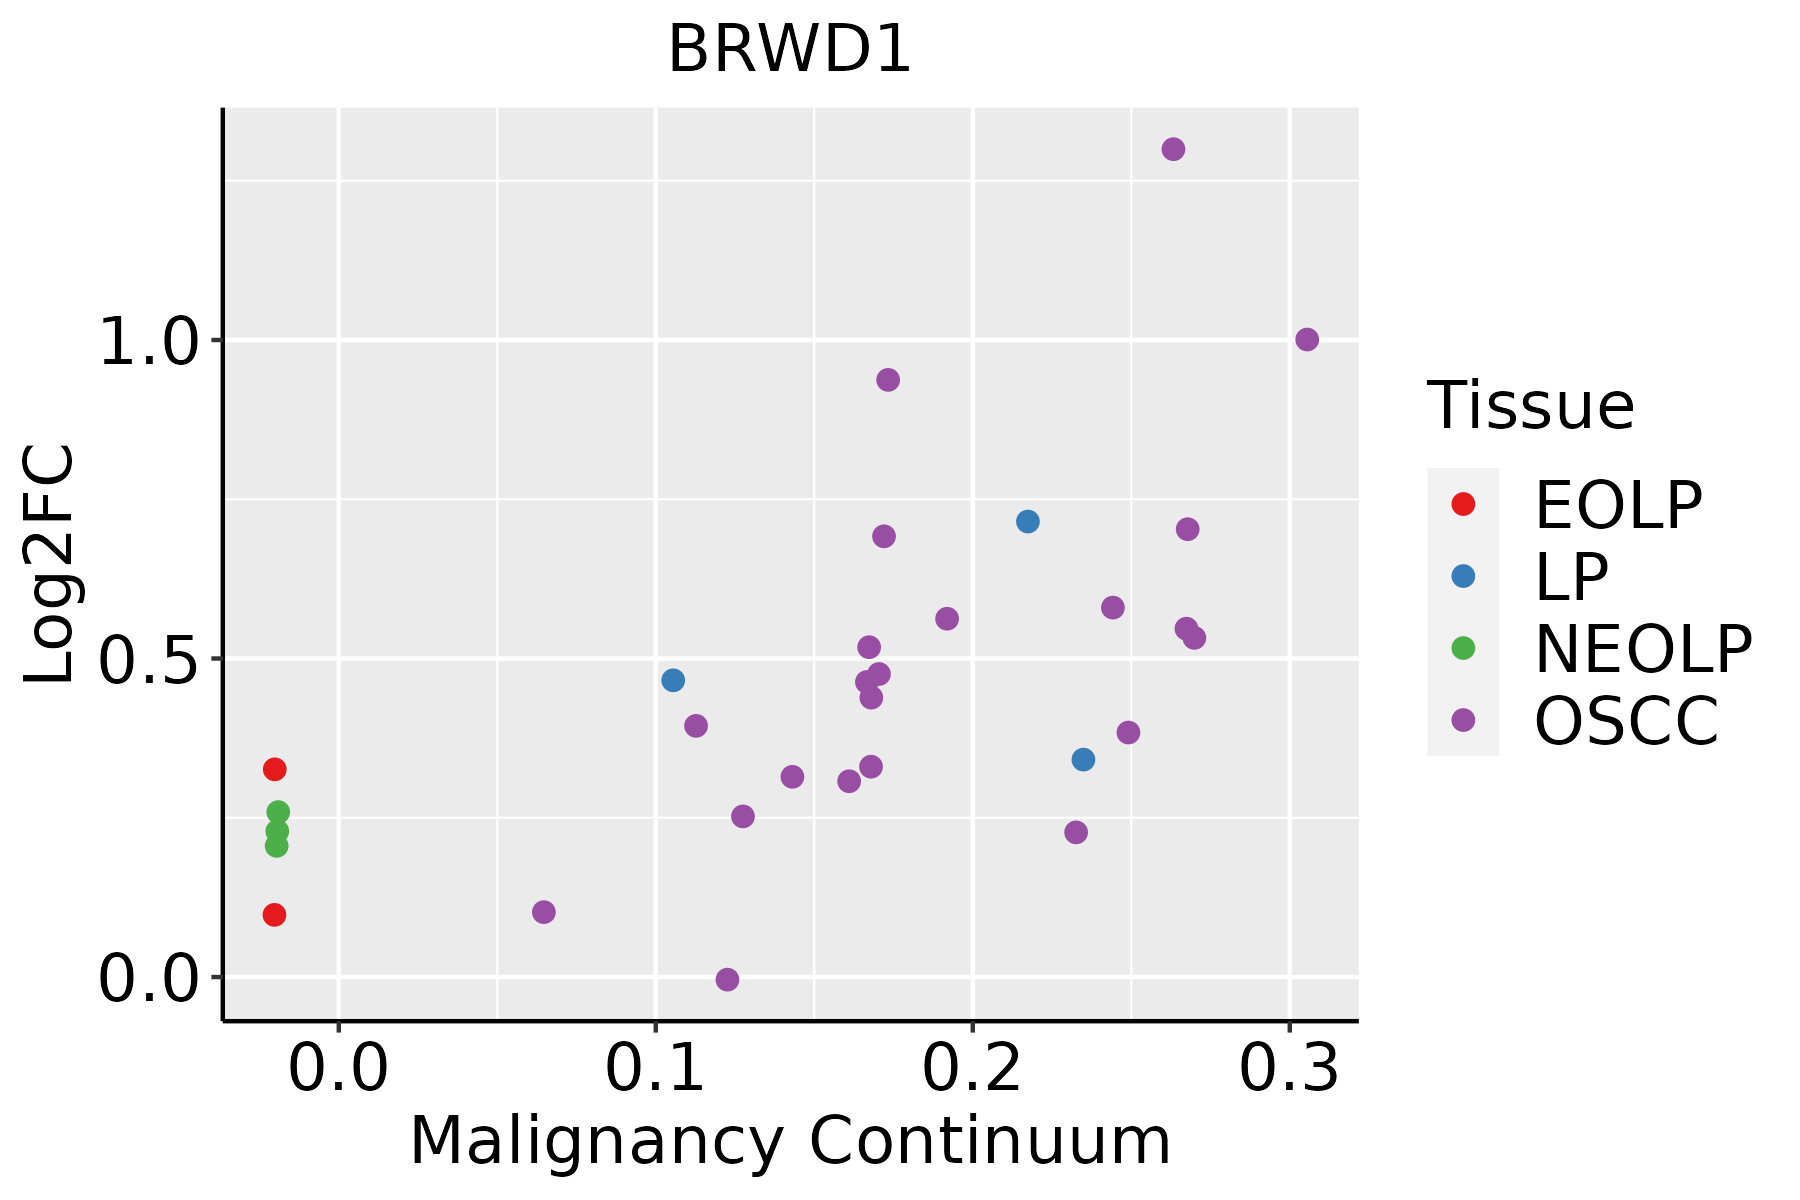 | EOLP: Erosive Oral lichen planus |
| LP: leukoplakia |
| NEOLP: Non-erosive oral lichen planus |
| OSCC: Oral squamous cell carcinoma |
| Prostate | 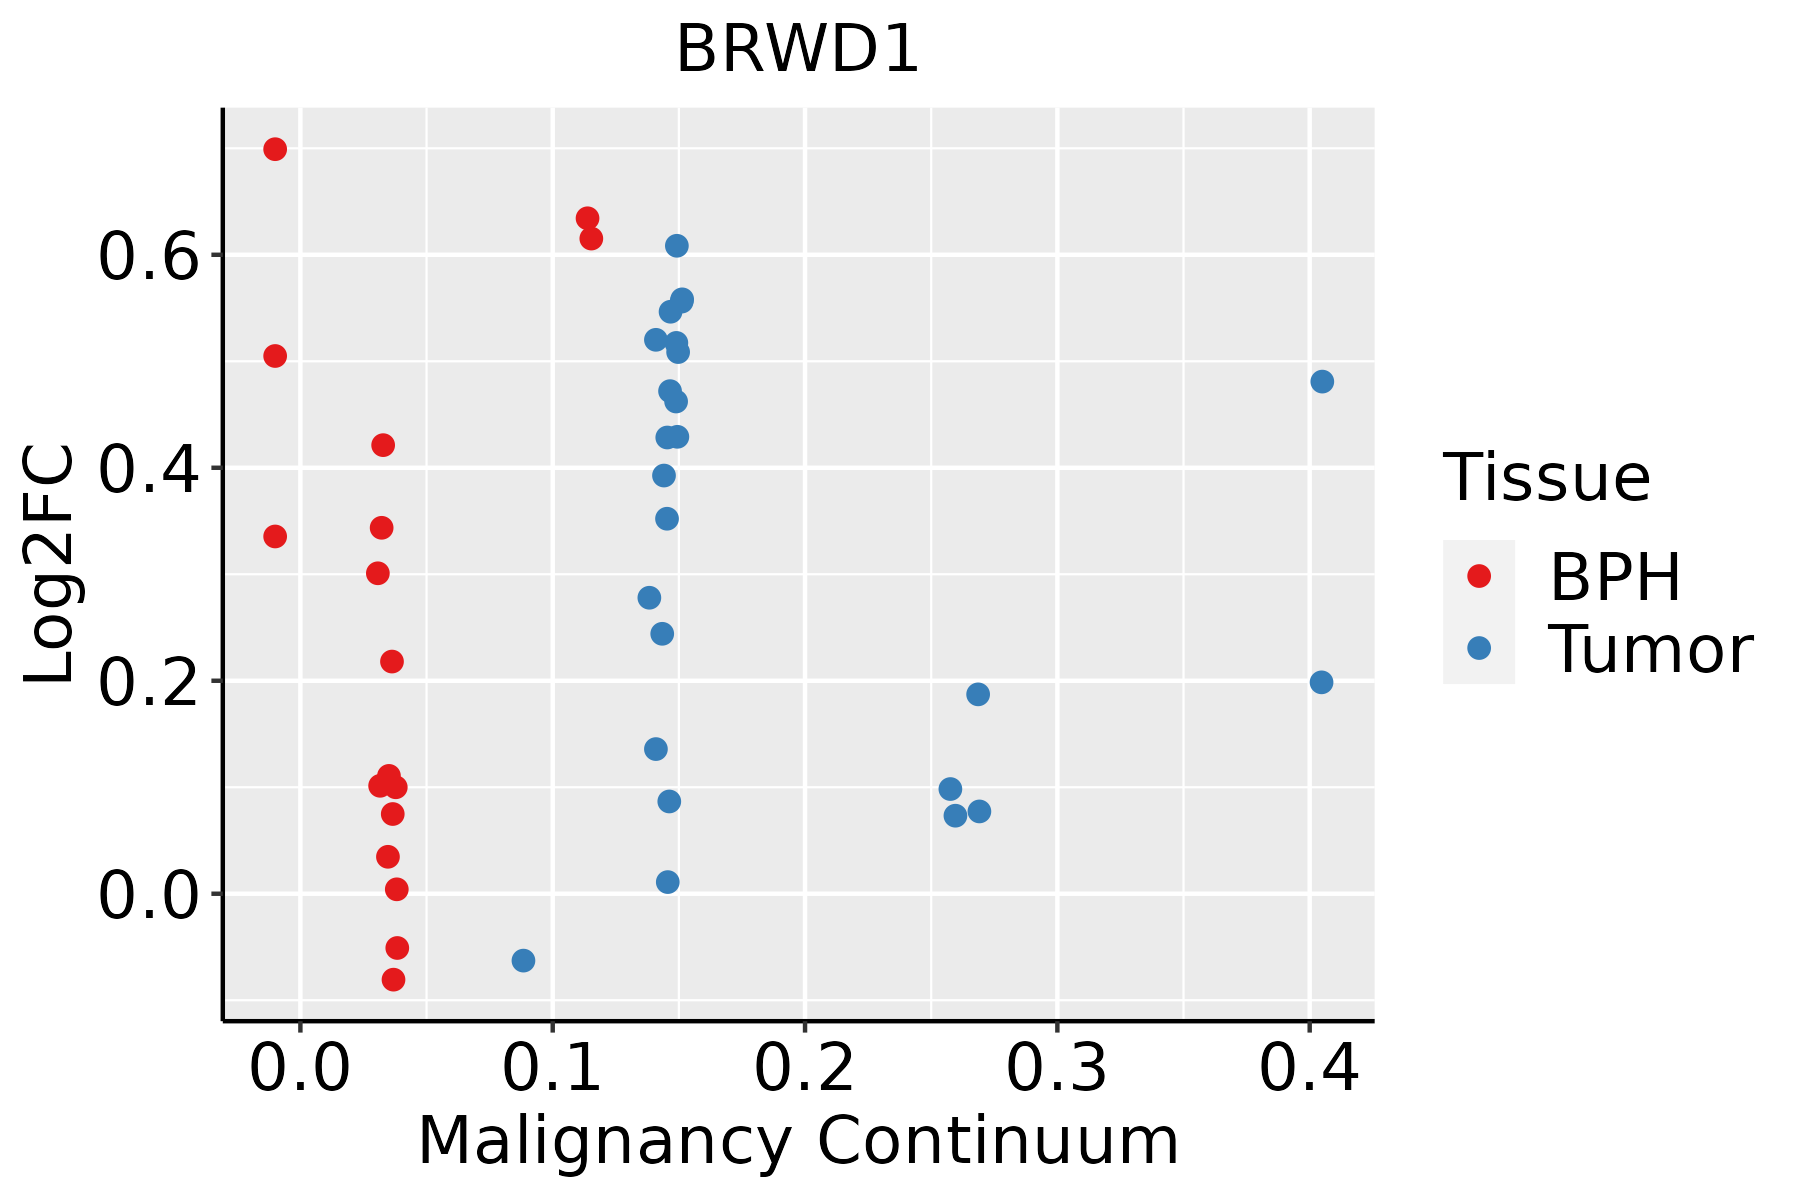 | BPH: Benign Prostatic Hyperplasia |
| Skin |  | AK: Actinic keratosis |
| cSCC: Cutaneous squamous cell carcinoma |
| SCCIS:squamous cell carcinoma in situ |
| Thyroid |  | ATC: Anaplastic thyroid cancer |
| HT: Hashimoto's thyroiditis |
| PTC: Papillary thyroid cancer |
| GO ID | Tissue | Disease Stage | Description | Gene Ratio | Bg Ratio | pvalue | p.adjust | Count |
| GO:002260410 | Cervix | CC | regulation of cell morphogenesis | 84/2311 | 309/18723 | 1.00e-12 | 4.29e-10 | 84 |
| GO:00083608 | Cervix | CC | regulation of cell shape | 38/2311 | 154/18723 | 1.86e-05 | 3.46e-04 | 38 |
| GO:0022604 | Colorectum | AD | regulation of cell morphogenesis | 109/3918 | 309/18723 | 3.08e-09 | 2.07e-07 | 109 |
| GO:0008360 | Colorectum | AD | regulation of cell shape | 56/3918 | 154/18723 | 7.01e-06 | 1.73e-04 | 56 |
| GO:00226041 | Colorectum | SER | regulation of cell morphogenesis | 89/2897 | 309/18723 | 1.51e-09 | 1.52e-07 | 89 |
| GO:00083601 | Colorectum | SER | regulation of cell shape | 43/2897 | 154/18723 | 5.47e-05 | 1.30e-03 | 43 |
| GO:00226042 | Colorectum | MSS | regulation of cell morphogenesis | 103/3467 | 309/18723 | 2.70e-10 | 2.56e-08 | 103 |
| GO:00083602 | Colorectum | MSS | regulation of cell shape | 52/3467 | 154/18723 | 4.40e-06 | 1.24e-04 | 52 |
| GO:00226044 | Colorectum | FAP | regulation of cell morphogenesis | 87/2622 | 309/18723 | 4.89e-11 | 1.87e-08 | 87 |
| GO:00083603 | Colorectum | FAP | regulation of cell shape | 43/2622 | 154/18723 | 4.55e-06 | 1.52e-04 | 43 |
| GO:00226045 | Colorectum | CRC | regulation of cell morphogenesis | 74/2078 | 309/18723 | 9.25e-11 | 5.04e-08 | 74 |
| GO:00083604 | Colorectum | CRC | regulation of cell shape | 38/2078 | 154/18723 | 1.51e-06 | 8.15e-05 | 38 |
| GO:002260420 | Esophagus | ESCC | regulation of cell morphogenesis | 180/8552 | 309/18723 | 5.19e-06 | 5.45e-05 | 180 |
| GO:000836018 | Esophagus | ESCC | regulation of cell shape | 92/8552 | 154/18723 | 3.00e-04 | 1.81e-03 | 92 |
| GO:00226047 | Liver | NAFLD | regulation of cell morphogenesis | 62/1882 | 309/18723 | 8.35e-08 | 7.09e-06 | 62 |
| GO:00083606 | Liver | NAFLD | regulation of cell shape | 27/1882 | 154/18723 | 2.92e-03 | 2.65e-02 | 27 |
| GO:002260412 | Liver | Cirrhotic | regulation of cell morphogenesis | 127/4634 | 309/18723 | 1.45e-10 | 7.44e-09 | 127 |
| GO:000836012 | Liver | Cirrhotic | regulation of cell shape | 69/4634 | 154/18723 | 4.21e-08 | 1.36e-06 | 69 |
| GO:002260422 | Liver | HCC | regulation of cell morphogenesis | 188/7958 | 309/18723 | 4.84e-11 | 1.82e-09 | 188 |
| GO:000836022 | Liver | HCC | regulation of cell shape | 92/7958 | 154/18723 | 1.15e-05 | 1.31e-04 | 92 |
| Hugo Symbol | Variant Class | Variant Classification | dbSNP RS | HGVSc | HGVSp | HGVSp Short | SWISSPROT | BIOTYPE | SIFT | PolyPhen | Tumor Sample Barcode | Tissue | Histology | Sex | Age | Stage | Therapy Types | Drugs | Outcome |
| BRWD1 | SNV | Missense_Mutation | | c.4784G>C | p.Arg1595Thr | p.R1595T | Q9NSI6 | protein_coding | tolerated(0.05) | benign(0.096) | TCGA-A2-A0CW-01 | Breast | breast invasive carcinoma | Female | >=65 | I/II | Hormone Therapy | anastrozole | SD |
| BRWD1 | SNV | Missense_Mutation | novel | c.3551N>G | p.Ala1184Gly | p.A1184G | Q9NSI6 | protein_coding | tolerated(0.1) | probably_damaging(0.926) | TCGA-A2-A3Y0-01 | Breast | breast invasive carcinoma | Female | <65 | I/II | Chemotherapy | adriamycin | CR |
| BRWD1 | SNV | Missense_Mutation | | c.5956N>C | p.Glu1986Gln | p.E1986Q | Q9NSI6 | protein_coding | deleterious_low_confidence(0.05) | benign(0.23) | TCGA-A8-A09M-01 | Breast | breast invasive carcinoma | Female | >=65 | III/IV | Chemotherapy | paclitaxel | CR |
| BRWD1 | SNV | Missense_Mutation | | c.3436G>C | p.Glu1146Gln | p.E1146Q | Q9NSI6 | protein_coding | tolerated(0.21) | possibly_damaging(0.63) | TCGA-AC-A23H-01 | Breast | breast invasive carcinoma | Female | >=65 | I/II | Unknown | Unknown | PD |
| BRWD1 | SNV | Missense_Mutation | novel | c.2423N>T | p.Arg808Ile | p.R808I | Q9NSI6 | protein_coding | deleterious(0.01) | possibly_damaging(0.548) | TCGA-AN-A046-01 | Breast | breast invasive carcinoma | Female | >=65 | I/II | Unknown | Unknown | SD |
| BRWD1 | SNV | Missense_Mutation | | c.3668N>G | p.Ser1223Cys | p.S1223C | Q9NSI6 | protein_coding | deleterious(0) | probably_damaging(1) | TCGA-AN-A0XR-01 | Breast | breast invasive carcinoma | Female | <65 | III/IV | Unknown | Unknown | SD |
| BRWD1 | SNV | Missense_Mutation | novel | c.614N>T | p.Ser205Leu | p.S205L | Q9NSI6 | protein_coding | deleterious(0) | probably_damaging(0.971) | TCGA-AR-A2LE-01 | Breast | breast invasive carcinoma | Female | >=65 | I/II | Hormone Therapy | tamoxiphen | PD |
| BRWD1 | SNV | Missense_Mutation | | c.4949N>G | p.Ser1650Cys | p.S1650C | Q9NSI6 | protein_coding | tolerated(0.1) | possibly_damaging(0.87) | TCGA-BH-A0DZ-01 | Breast | breast invasive carcinoma | Female | <65 | I/II | Chemotherapy | docetaxel | SD |
| BRWD1 | SNV | Missense_Mutation | | c.5464N>G | p.Ser1822Ala | p.S1822A | Q9NSI6 | protein_coding | tolerated_low_confidence(0.61) | possibly_damaging(0.446) | TCGA-C8-A12W-01 | Breast | breast invasive carcinoma | Female | <65 | III/IV | Unknown | Unknown | SD |
| BRWD1 | SNV | Missense_Mutation | | c.773N>T | p.Arg258Ile | p.R258I | Q9NSI6 | protein_coding | deleterious(0) | probably_damaging(0.963) | TCGA-D8-A1JK-01 | Breast | breast invasive carcinoma | Female | >=65 | I/II | Unknown | Unknown | SD |


