
|
|||||
|
 | |
| |
| |
| |
| |
| |
|
Gene: BRPF3 |
Gene summary for BRPF3 |
| Gene information | Species | Human | Gene symbol | BRPF3 | Gene ID | 27154 |
| Gene name | bromodomain and PHD finger containing 3 | |
| Gene Alias | BRPF3 | |
| Cytomap | 6p21.31 | |
| Gene Type | protein-coding | GO ID | GO:0006260 | UniProtAcc | Q9ULD4 |
Top |
Malignant transformation analysis |
| Identification of the aberrant gene expression in precancerous and cancerous lesions by comparing the gene expression of stem-like cells in diseased tissues with normal stem cells |
| Entrez ID | Symbol | Replicates | Species | Organ | Tissue | Adj P-value | Log2FC | Malignancy |
| 27154 | BRPF3 | HCC1_Meng | Human | Liver | HCC | 2.24e-39 | 6.25e-02 | 0.0246 |
| 27154 | BRPF3 | HCC2_Meng | Human | Liver | HCC | 5.65e-08 | 2.51e-02 | 0.0107 |
| 27154 | BRPF3 | HCC1 | Human | Liver | HCC | 1.04e-12 | 3.68e+00 | 0.5336 |
| 27154 | BRPF3 | HCC2 | Human | Liver | HCC | 3.60e-14 | 3.53e+00 | 0.5341 |
| 27154 | BRPF3 | S014 | Human | Liver | HCC | 3.46e-09 | 4.04e-01 | 0.2254 |
| 27154 | BRPF3 | S015 | Human | Liver | HCC | 5.84e-05 | 3.78e-01 | 0.2375 |
| 27154 | BRPF3 | S016 | Human | Liver | HCC | 1.77e-02 | 2.49e-01 | 0.2243 |
| 27154 | BRPF3 | S027 | Human | Liver | HCC | 1.25e-03 | 4.61e-01 | 0.2446 |
| 27154 | BRPF3 | S028 | Human | Liver | HCC | 4.10e-15 | 5.41e-01 | 0.2503 |
| 27154 | BRPF3 | S029 | Human | Liver | HCC | 8.26e-09 | 4.76e-01 | 0.2581 |
| 27154 | BRPF3 | male-WTA | Human | Thyroid | PTC | 1.33e-16 | 6.94e-02 | 0.1037 |
| 27154 | BRPF3 | PTC01 | Human | Thyroid | PTC | 2.12e-06 | -6.38e-02 | 0.1899 |
| 27154 | BRPF3 | PTC04 | Human | Thyroid | PTC | 7.07e-08 | 4.21e-02 | 0.1927 |
| 27154 | BRPF3 | PTC05 | Human | Thyroid | PTC | 7.18e-05 | 2.27e-01 | 0.2065 |
| 27154 | BRPF3 | PTC06 | Human | Thyroid | PTC | 4.06e-07 | 2.35e-01 | 0.2057 |
| 27154 | BRPF3 | PTC07 | Human | Thyroid | PTC | 5.69e-13 | 8.93e-02 | 0.2044 |
| 27154 | BRPF3 | ATC12 | Human | Thyroid | ATC | 7.23e-04 | -5.59e-03 | 0.34 |
| 27154 | BRPF3 | ATC13 | Human | Thyroid | ATC | 1.38e-37 | 7.03e-01 | 0.34 |
| 27154 | BRPF3 | ATC4 | Human | Thyroid | ATC | 5.71e-08 | 1.57e-02 | 0.34 |
| 27154 | BRPF3 | ATC5 | Human | Thyroid | ATC | 2.64e-43 | 7.72e-01 | 0.34 |
| Page: 1 |
| Tissue | Expression Dynamics | Abbreviation |
| Liver | 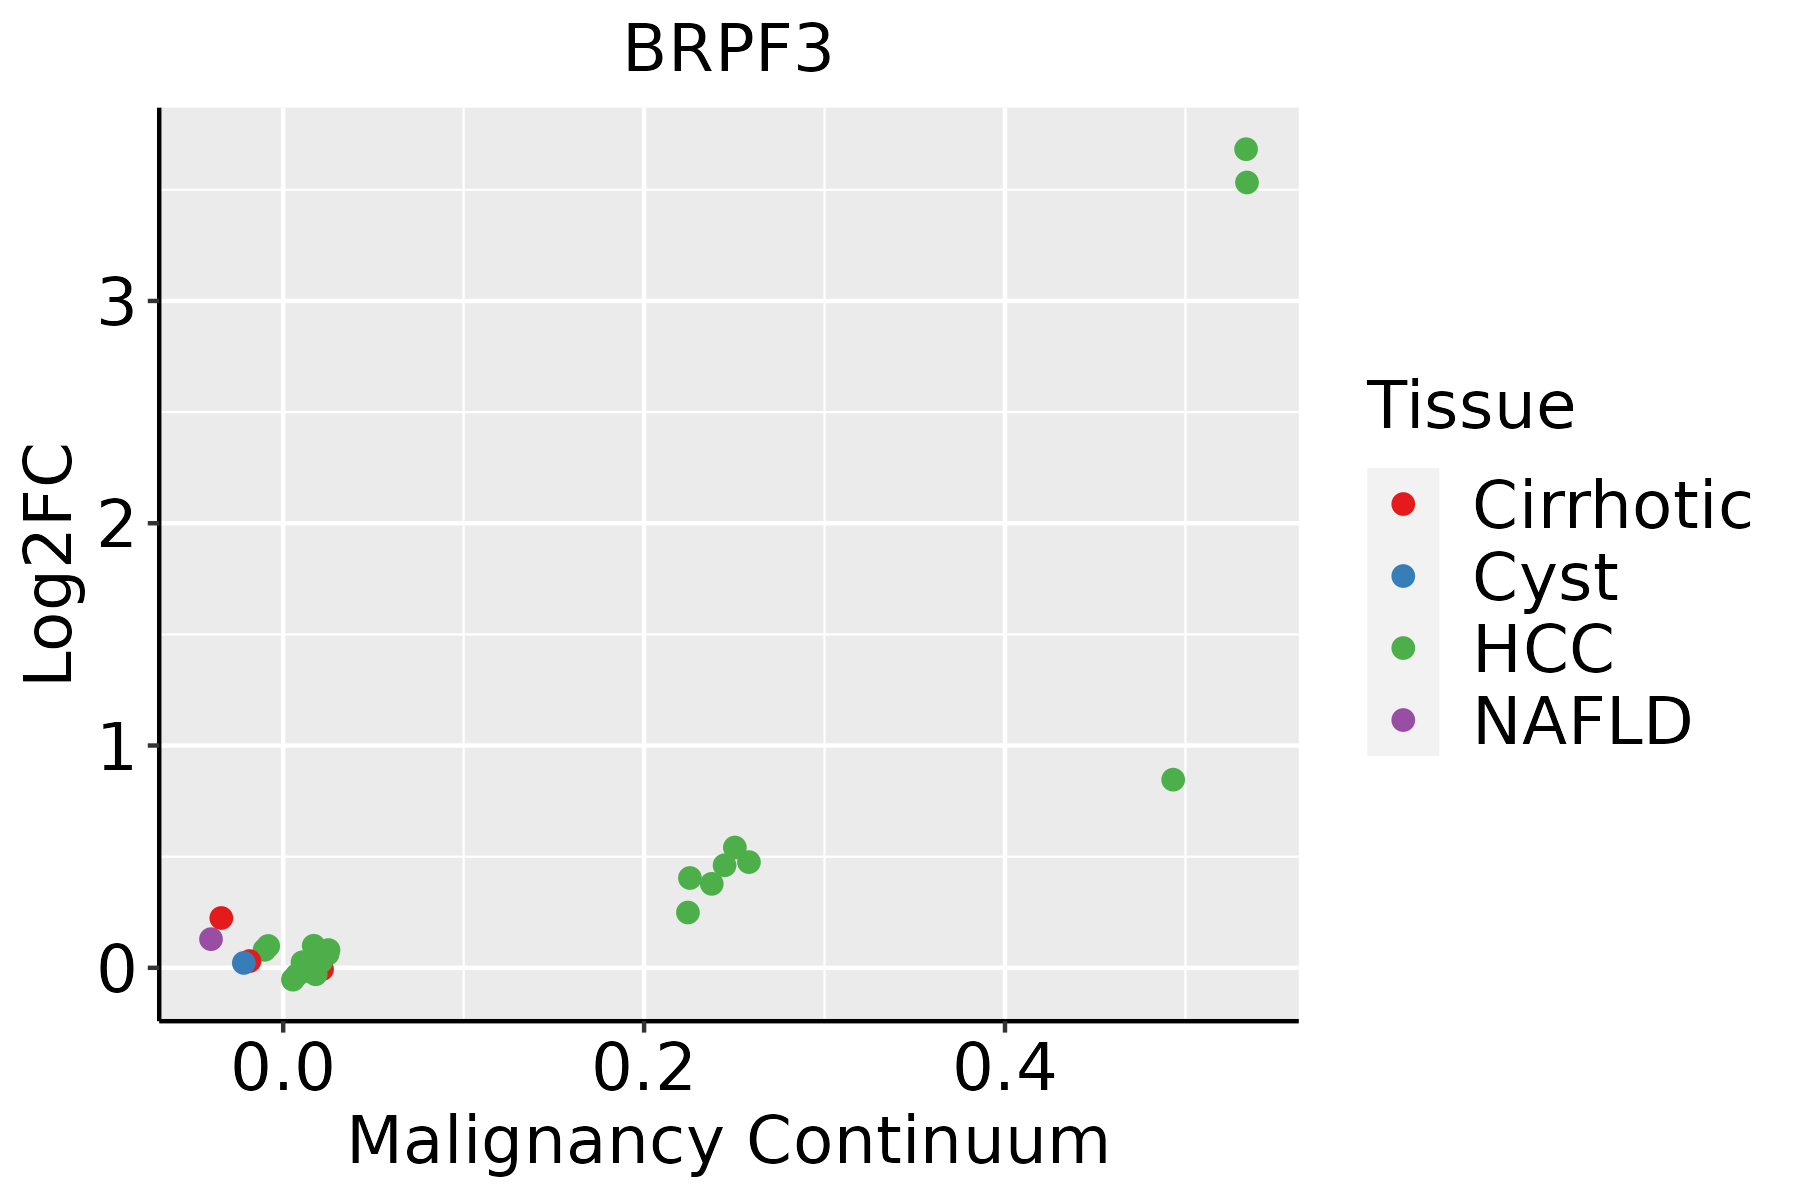 | HCC: Hepatocellular carcinoma |
| NAFLD: Non-alcoholic fatty liver disease | ||
| Thyroid | 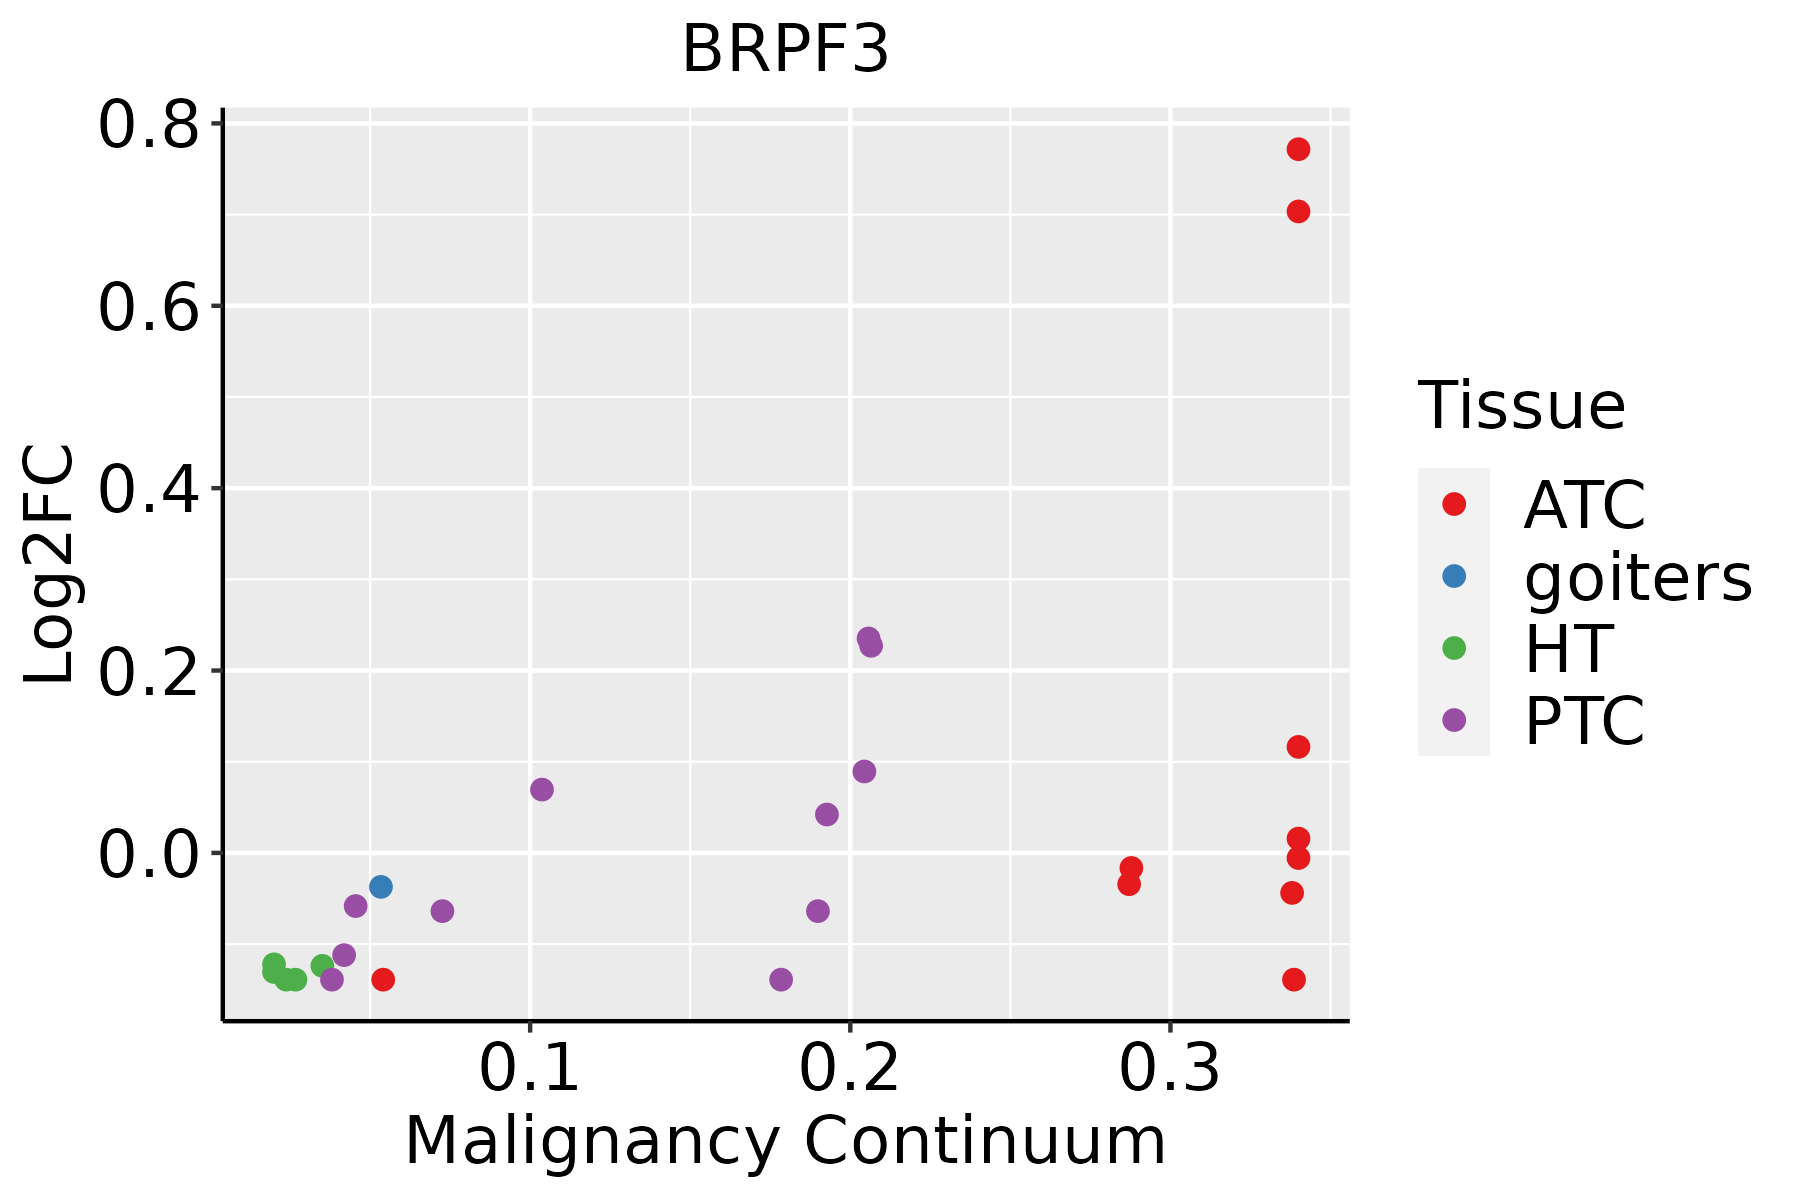 | ATC: Anaplastic thyroid cancer |
| HT: Hashimoto's thyroiditis | ||
| PTC: Papillary thyroid cancer |
| ∗log2FC in expression of this searched gene in stem-like cells from each diseased tissue sample relative to stem-like cells in normal samples in each tissue plotted against the malignancy continuum. Samples are colored based on if they are from different disease stage. |
Top |
Malignant transformation related pathway analysis |
| Find out the enriched GO biological processes and KEGG pathways involved in transition from healthy to precancer to cancer |
| Tissue | Disease Stage | Enriched GO biological Processes |
| Colorectum | AD |  |
| Colorectum | SER |  |
| Colorectum | MSS |  |
| Colorectum | MSI-H |  |
| Colorectum | FAP |  |
| ∗Top 15 enriched GO BP terms are showed in the bar plot of each disease state in each tissue. Each row represents a significant GO biological process which is colored according to the -log10(p.adjust). |
| Page: 1 2 3 4 5 6 7 8 9 |
| GO ID | Tissue | Disease Stage | Description | Gene Ratio | Bg Ratio | pvalue | p.adjust | Count |
| GO:001657021 | Liver | HCC | histone modification | 283/7958 | 463/18723 | 2.68e-16 | 2.33e-14 | 283 |
| GO:00182052 | Liver | HCC | peptidyl-lysine modification | 230/7958 | 376/18723 | 1.51e-13 | 8.32e-12 | 230 |
| GO:00064732 | Liver | HCC | protein acetylation | 135/7958 | 201/18723 | 1.20e-12 | 5.92e-11 | 135 |
| GO:00435432 | Liver | HCC | protein acylation | 157/7958 | 243/18723 | 2.40e-12 | 1.12e-10 | 157 |
| GO:00183942 | Liver | HCC | peptidyl-lysine acetylation | 116/7958 | 169/18723 | 5.11e-12 | 2.23e-10 | 116 |
| GO:00064752 | Liver | HCC | internal protein amino acid acetylation | 107/7958 | 160/18723 | 3.77e-10 | 1.23e-08 | 107 |
| GO:00183932 | Liver | HCC | internal peptidyl-lysine acetylation | 105/7958 | 158/18723 | 9.48e-10 | 2.90e-08 | 105 |
| GO:00165732 | Liver | HCC | histone acetylation | 101/7958 | 152/18723 | 1.99e-09 | 5.63e-08 | 101 |
| GO:00062601 | Liver | HCC | DNA replication | 146/7958 | 260/18723 | 5.68e-06 | 7.02e-05 | 146 |
| GO:00062751 | Liver | HCC | regulation of DNA replication | 60/7958 | 107/18723 | 3.15e-03 | 1.46e-02 | 60 |
| GO:0043966 | Liver | HCC | histone H3 acetylation | 37/7958 | 61/18723 | 3.21e-03 | 1.48e-02 | 37 |
| GO:001657010 | Thyroid | PTC | histone modification | 235/5968 | 463/18723 | 1.17e-17 | 1.15e-15 | 235 |
| GO:00064737 | Thyroid | PTC | protein acetylation | 116/5968 | 201/18723 | 3.05e-14 | 1.92e-12 | 116 |
| GO:00435437 | Thyroid | PTC | protein acylation | 134/5968 | 243/18723 | 4.22e-14 | 2.58e-12 | 134 |
| GO:00182059 | Thyroid | PTC | peptidyl-lysine modification | 188/5968 | 376/18723 | 1.34e-13 | 7.09e-12 | 188 |
| GO:00183947 | Thyroid | PTC | peptidyl-lysine acetylation | 99/5968 | 169/18723 | 6.54e-13 | 3.08e-11 | 99 |
| GO:00064757 | Thyroid | PTC | internal protein amino acid acetylation | 92/5968 | 160/18723 | 1.80e-11 | 7.06e-10 | 92 |
| GO:00183937 | Thyroid | PTC | internal peptidyl-lysine acetylation | 91/5968 | 158/18723 | 2.04e-11 | 7.91e-10 | 91 |
| GO:00165737 | Thyroid | PTC | histone acetylation | 88/5968 | 152/18723 | 2.97e-11 | 1.10e-09 | 88 |
| GO:00062606 | Thyroid | PTC | DNA replication | 114/5968 | 260/18723 | 3.09e-05 | 2.95e-04 | 114 |
| Page: 1 2 |
| Pathway ID | Tissue | Disease Stage | Description | Gene Ratio | Bg Ratio | pvalue | p.adjust | qvalue | Count |
| Page: 1 |
Top |
Cell-cell communication analysis |
| Identification of potential cell-cell interactions between two cell types and their ligand-receptor pairs for different disease states |
| Ligand | Receptor | LRpair | Pathway | Tissue | Disease Stage |
| Page: 1 |
Top |
Single-cell gene regulatory network inference analysis |
| Find out the significant the regulons (TFs) and the target genes of each regulon across cell types for different disease states |
| TF | Cell Type | Tissue | Disease Stage | Target Gene | RSS | Regulon Activity |
| ∗The dot plots of a searched regulon are shown for all cell subpopulations in each disease state of each tissue based on the regulon specific score inferred using pySCENIC and by calculating the average expression. |
| Page: 1 |
Top |
Somatic mutation of malignant transformation related genes |
| Annotation of somatic variants for genes involved in malignant transformation |
| Hugo Symbol | Variant Class | Variant Classification | dbSNP RS | HGVSc | HGVSp | HGVSp Short | SWISSPROT | BIOTYPE | SIFT | PolyPhen | Tumor Sample Barcode | Tissue | Histology | Sex | Age | Stage | Therapy Types | Drugs | Outcome |
| BRPF3 | SNV | Missense_Mutation | c.520N>C | p.Asp174His | p.D174H | Q9ULD4 | protein_coding | deleterious(0) | probably_damaging(0.987) | TCGA-A2-A0CX-01 | Breast | breast invasive carcinoma | Female | <65 | I/II | Chemotherapy | adriamycin | SD | |
| BRPF3 | SNV | Missense_Mutation | c.2023N>G | p.Phe675Val | p.F675V | Q9ULD4 | protein_coding | deleterious(0) | probably_damaging(0.942) | TCGA-AO-A0JM-01 | Breast | breast invasive carcinoma | Female | <65 | I/II | Chemotherapy | doxorubicin | SD | |
| BRPF3 | SNV | Missense_Mutation | c.1903G>A | p.Asp635Asn | p.D635N | Q9ULD4 | protein_coding | deleterious(0) | probably_damaging(0.999) | TCGA-AR-A1AY-01 | Breast | breast invasive carcinoma | Female | >=65 | I/II | Unspecific | Doxorubicin | SD | |
| BRPF3 | SNV | Missense_Mutation | c.1768N>C | p.Glu590Gln | p.E590Q | Q9ULD4 | protein_coding | tolerated(1) | benign(0.001) | TCGA-BH-A0BP-01 | Breast | breast invasive carcinoma | Female | >=65 | I/II | Unknown | Unknown | SD | |
| BRPF3 | SNV | Missense_Mutation | rs572446431 | c.2705N>G | p.Asn902Ser | p.N902S | Q9ULD4 | protein_coding | tolerated(1) | benign(0) | TCGA-BH-A0H3-01 | Breast | breast invasive carcinoma | Female | <65 | I/II | Unknown | Unknown | SD |
| BRPF3 | SNV | Missense_Mutation | novel | c.2957G>A | p.Gly986Glu | p.G986E | Q9ULD4 | protein_coding | tolerated(1) | benign(0.124) | TCGA-OL-A66J-01 | Breast | breast invasive carcinoma | Female | >=65 | I/II | Unknown | Unknown | SD |
| BRPF3 | insertion | Nonsense_Mutation | novel | c.2682_2683insATGTTTGGTACATAGGAAACAATAATAAAATAGTAGCTGTTGGTG | p.Pro894_Leu895insMetPheGlyThrTerGluThrIleIleLysTerTerLeuLeuVal | p.P894_L895insMFGT*ETIIK**LLV | Q9ULD4 | protein_coding | TCGA-A8-A095-01 | Breast | breast invasive carcinoma | Female | <65 | I/II | Chemotherapy | 5-fluorouracil | CR | ||
| BRPF3 | insertion | Frame_Shift_Ins | novel | c.2773_2774insTCCCCCTTTACCT | p.Arg925LeufsTer19 | p.R925Lfs*19 | Q9ULD4 | protein_coding | TCGA-B6-A0IB-01 | Breast | breast invasive carcinoma | Female | <65 | III/IV | Unknown | Unknown | PD | ||
| BRPF3 | insertion | Frame_Shift_Ins | novel | c.2774_2775insTTCTATTCTTTCTGTCTTTAAGTGTT | p.Arg926SerfsTer82 | p.R926Sfs*82 | Q9ULD4 | protein_coding | TCGA-B6-A0IB-01 | Breast | breast invasive carcinoma | Female | <65 | III/IV | Unknown | Unknown | PD | ||
| BRPF3 | deletion | Frame_Shift_Del | c.2421delN | p.Asp809MetfsTer51 | p.D809Mfs*51 | Q9ULD4 | protein_coding | TCGA-BH-A18G-01 | Breast | breast invasive carcinoma | Female | >=65 | I/II | Unknown | Unknown | SD |
| Page: 1 2 3 4 5 6 7 8 9 10 11 |
Top |
Related drugs of malignant transformation related genes |
| Identification of chemicals and drugs interact with genes involved in malignant transfromation |
| (DGIdb 4.0) |
| Entrez ID | Symbol | Category | Interaction Types | Drug Claim Name | Drug Name | PMIDs |
| 27154 | BRPF3 | DRUGGABLE GENOME | 336446909 | |||
| 27154 | BRPF3 | DRUGGABLE GENOME | 252166774 |
| Page: 1 |

Copyright 2023-Present -The University of Texas Health Science Center at Houston |