
|
|||||
|
 | |
| |
| |
| |
| |
| |
|
Gene: BRMS1 |
Gene summary for BRMS1 |
| Gene information | Species | Human | Gene symbol | BRMS1 | Gene ID | 25855 |
| Gene name | BRMS1 transcriptional repressor and anoikis regulator | |
| Gene Alias | BRMS1 | |
| Cytomap | 11q13.2 | |
| Gene Type | protein-coding | GO ID | GO:0000122 | UniProtAcc | G5E9I4 |
Top |
Malignant transformation analysis |
| Identification of the aberrant gene expression in precancerous and cancerous lesions by comparing the gene expression of stem-like cells in diseased tissues with normal stem cells |
| Entrez ID | Symbol | Replicates | Species | Organ | Tissue | Adj P-value | Log2FC | Malignancy |
| 25855 | BRMS1 | LZE2T | Human | Esophagus | ESCC | 1.34e-03 | 5.85e-01 | 0.082 |
| 25855 | BRMS1 | LZE4T | Human | Esophagus | ESCC | 2.10e-10 | 3.39e-01 | 0.0811 |
| 25855 | BRMS1 | LZE7T | Human | Esophagus | ESCC | 1.45e-10 | 5.50e-01 | 0.0667 |
| 25855 | BRMS1 | LZE8T | Human | Esophagus | ESCC | 1.92e-06 | 3.43e-01 | 0.067 |
| 25855 | BRMS1 | LZE20T | Human | Esophagus | ESCC | 7.86e-22 | 7.46e-01 | 0.0662 |
| 25855 | BRMS1 | LZE22D1 | Human | Esophagus | HGIN | 1.26e-02 | 9.09e-02 | 0.0595 |
| 25855 | BRMS1 | LZE22T | Human | Esophagus | ESCC | 1.58e-03 | 5.85e-01 | 0.068 |
| 25855 | BRMS1 | LZE24T | Human | Esophagus | ESCC | 4.56e-27 | 6.92e-01 | 0.0596 |
| 25855 | BRMS1 | LZE21T | Human | Esophagus | ESCC | 1.99e-02 | 2.77e-01 | 0.0655 |
| 25855 | BRMS1 | LZE6T | Human | Esophagus | ESCC | 6.14e-07 | 4.19e-01 | 0.0845 |
| 25855 | BRMS1 | P1T-E | Human | Esophagus | ESCC | 8.08e-14 | 6.40e-01 | 0.0875 |
| 25855 | BRMS1 | P2T-E | Human | Esophagus | ESCC | 5.04e-27 | 4.40e-01 | 0.1177 |
| 25855 | BRMS1 | P4T-E | Human | Esophagus | ESCC | 3.26e-30 | 7.56e-01 | 0.1323 |
| 25855 | BRMS1 | P5T-E | Human | Esophagus | ESCC | 8.58e-35 | 7.53e-01 | 0.1327 |
| 25855 | BRMS1 | P8T-E | Human | Esophagus | ESCC | 6.30e-36 | 7.35e-01 | 0.0889 |
| 25855 | BRMS1 | P9T-E | Human | Esophagus | ESCC | 1.92e-19 | 4.73e-01 | 0.1131 |
| 25855 | BRMS1 | P10T-E | Human | Esophagus | ESCC | 6.32e-22 | 2.84e-01 | 0.116 |
| 25855 | BRMS1 | P11T-E | Human | Esophagus | ESCC | 3.19e-25 | 9.16e-01 | 0.1426 |
| 25855 | BRMS1 | P12T-E | Human | Esophagus | ESCC | 2.34e-28 | 4.94e-01 | 0.1122 |
| 25855 | BRMS1 | P15T-E | Human | Esophagus | ESCC | 1.07e-27 | 6.31e-01 | 0.1149 |
| Page: 1 2 3 4 5 6 7 |
| Tissue | Expression Dynamics | Abbreviation |
| Esophagus |  | ESCC: Esophageal squamous cell carcinoma |
| HGIN: High-grade intraepithelial neoplasias | ||
| LGIN: Low-grade intraepithelial neoplasias | ||
| Liver | 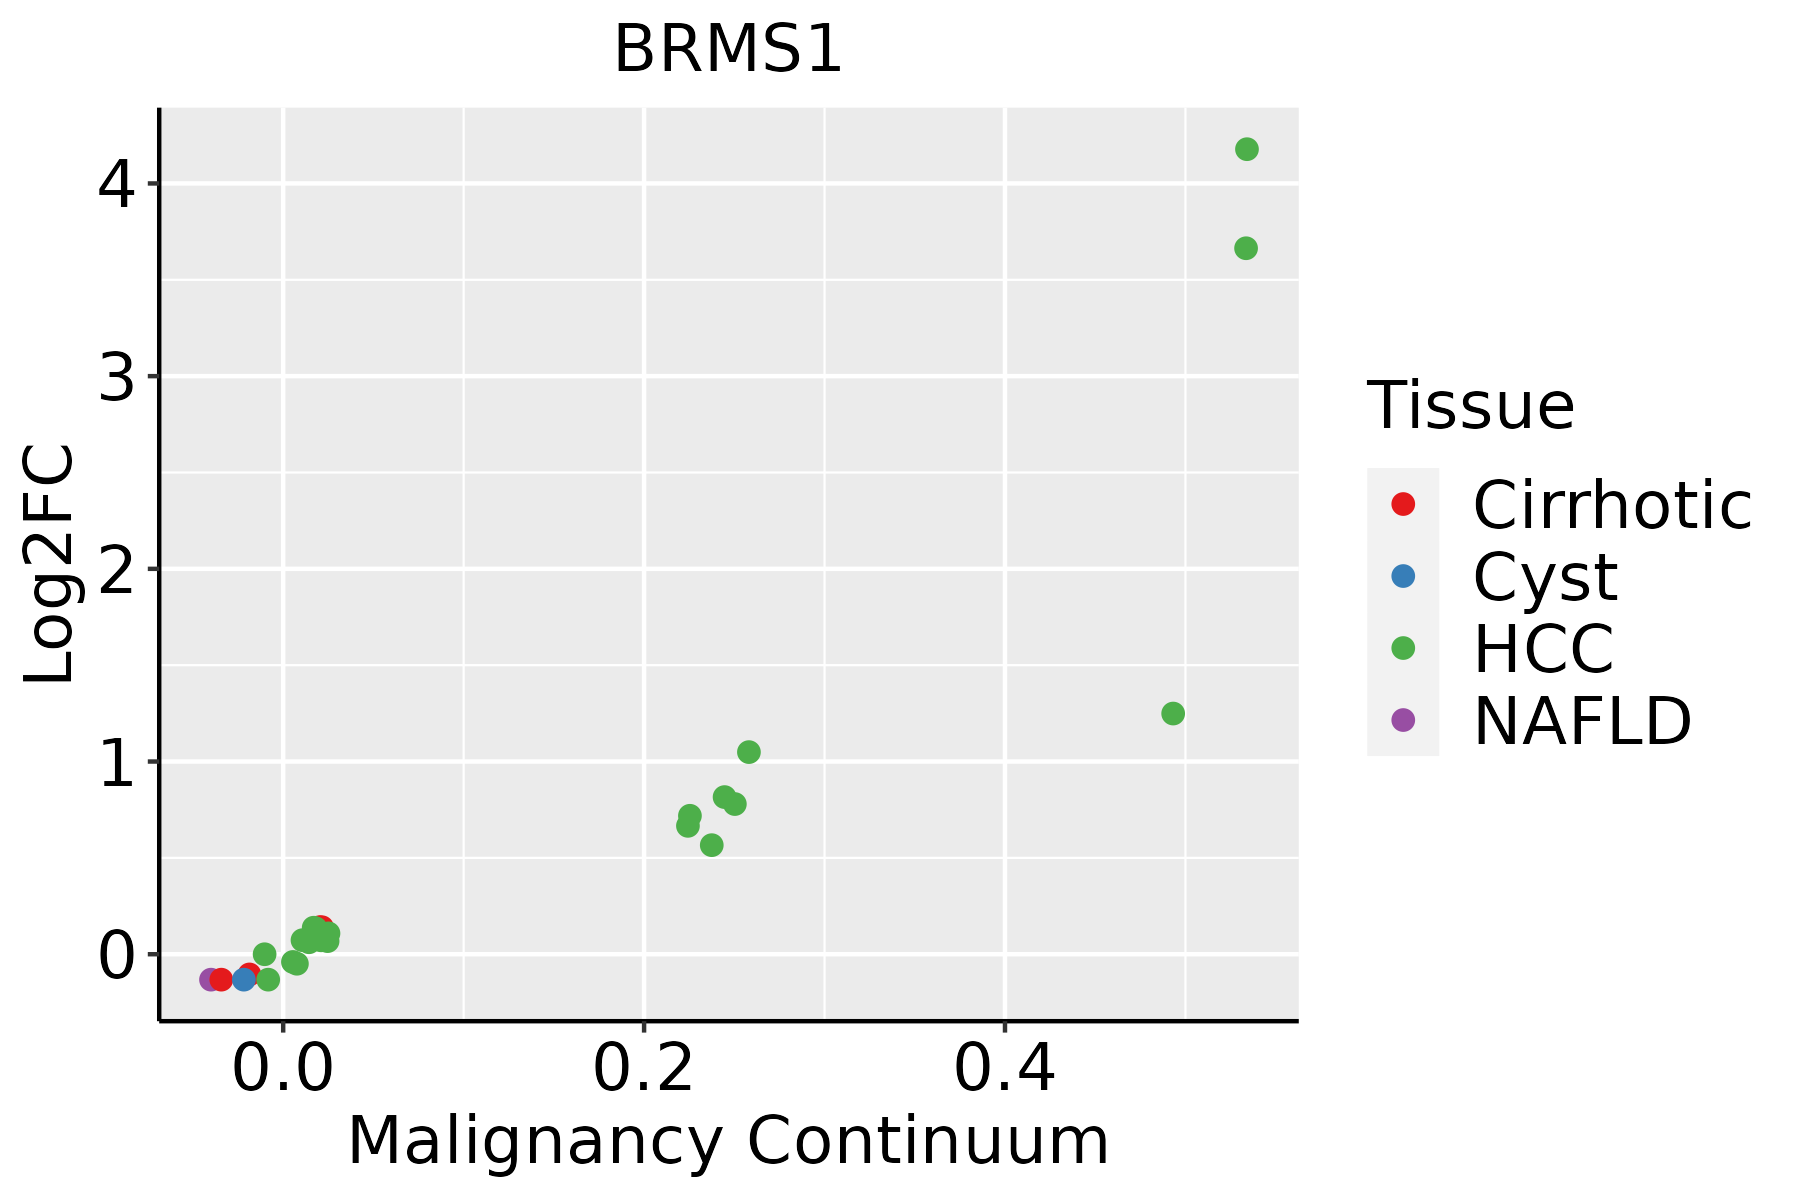 | HCC: Hepatocellular carcinoma |
| NAFLD: Non-alcoholic fatty liver disease | ||
| Oral Cavity | 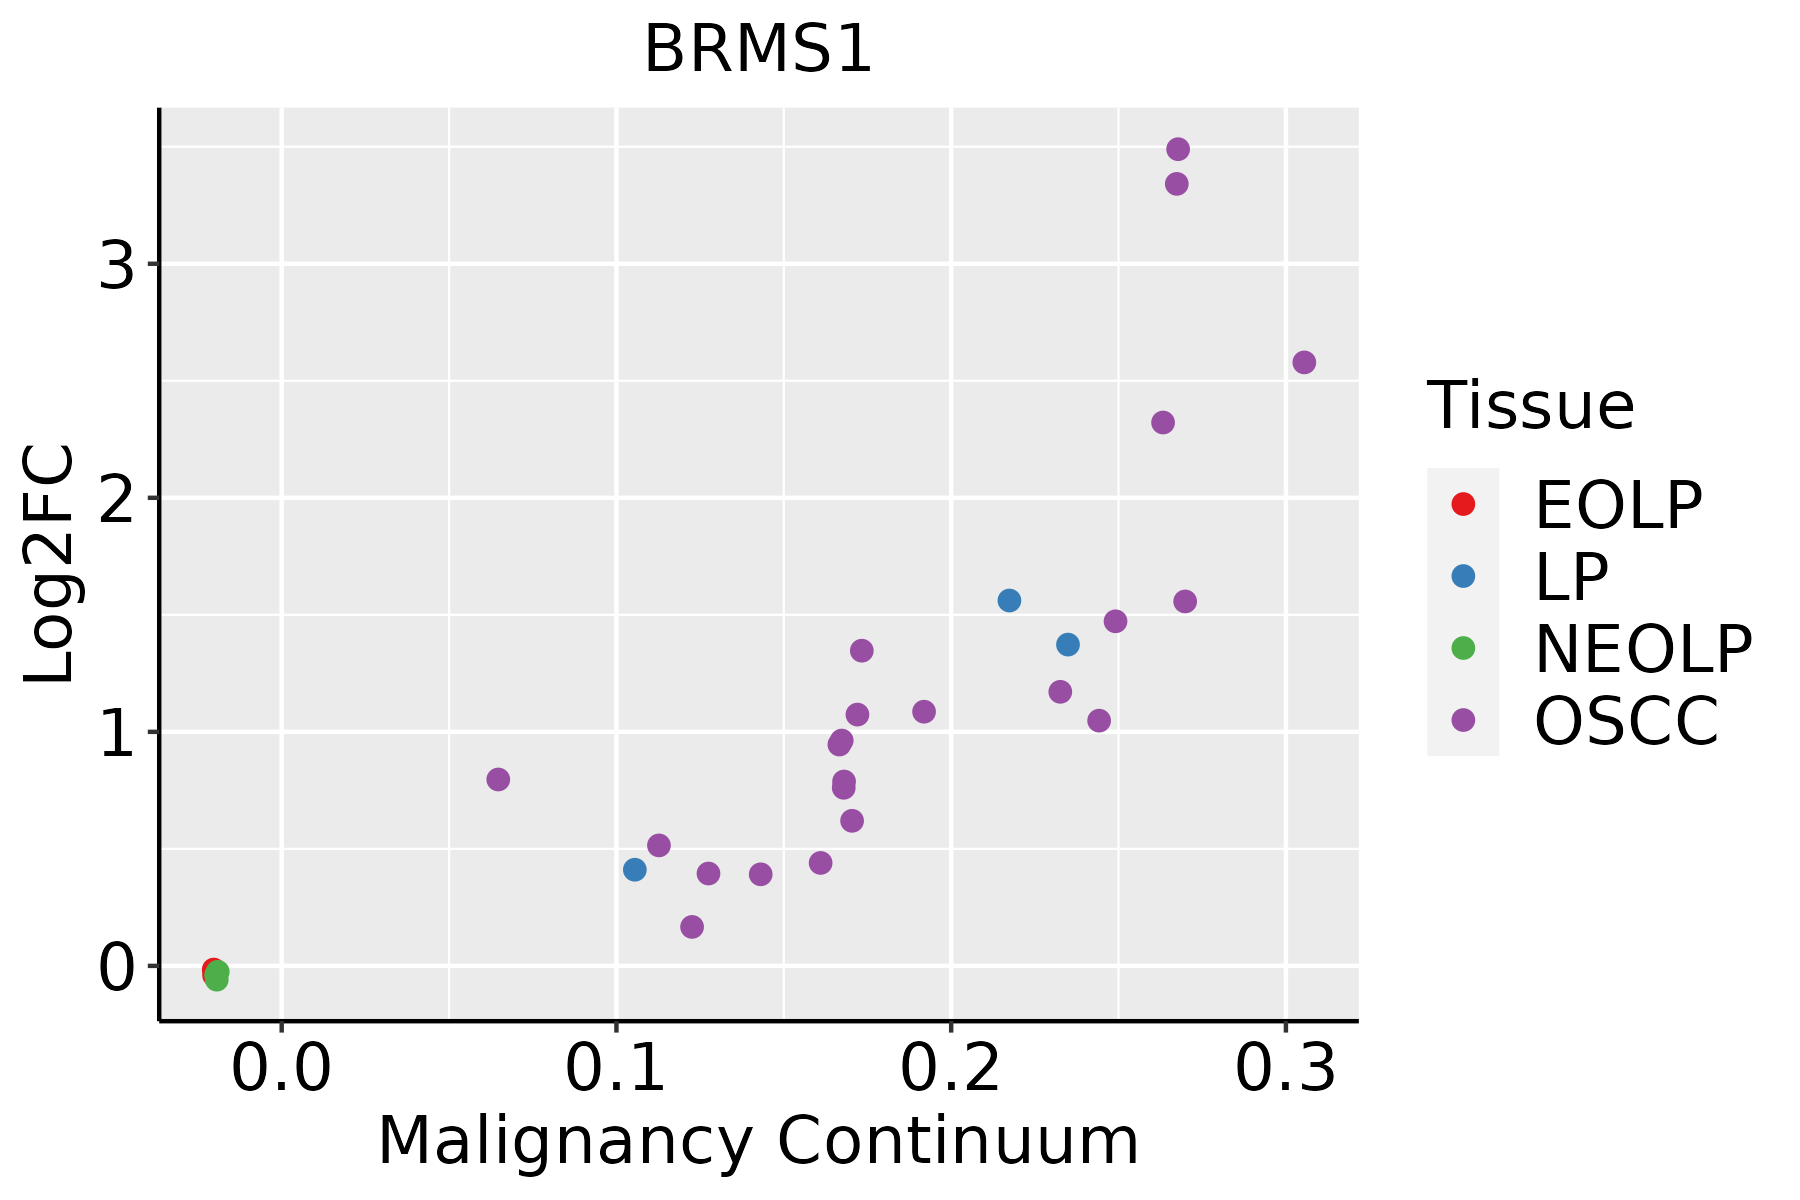 | EOLP: Erosive Oral lichen planus |
| LP: leukoplakia | ||
| NEOLP: Non-erosive oral lichen planus | ||
| OSCC: Oral squamous cell carcinoma | ||
| Skin |  | AK: Actinic keratosis |
| cSCC: Cutaneous squamous cell carcinoma | ||
| SCCIS:squamous cell carcinoma in situ | ||
| Thyroid | 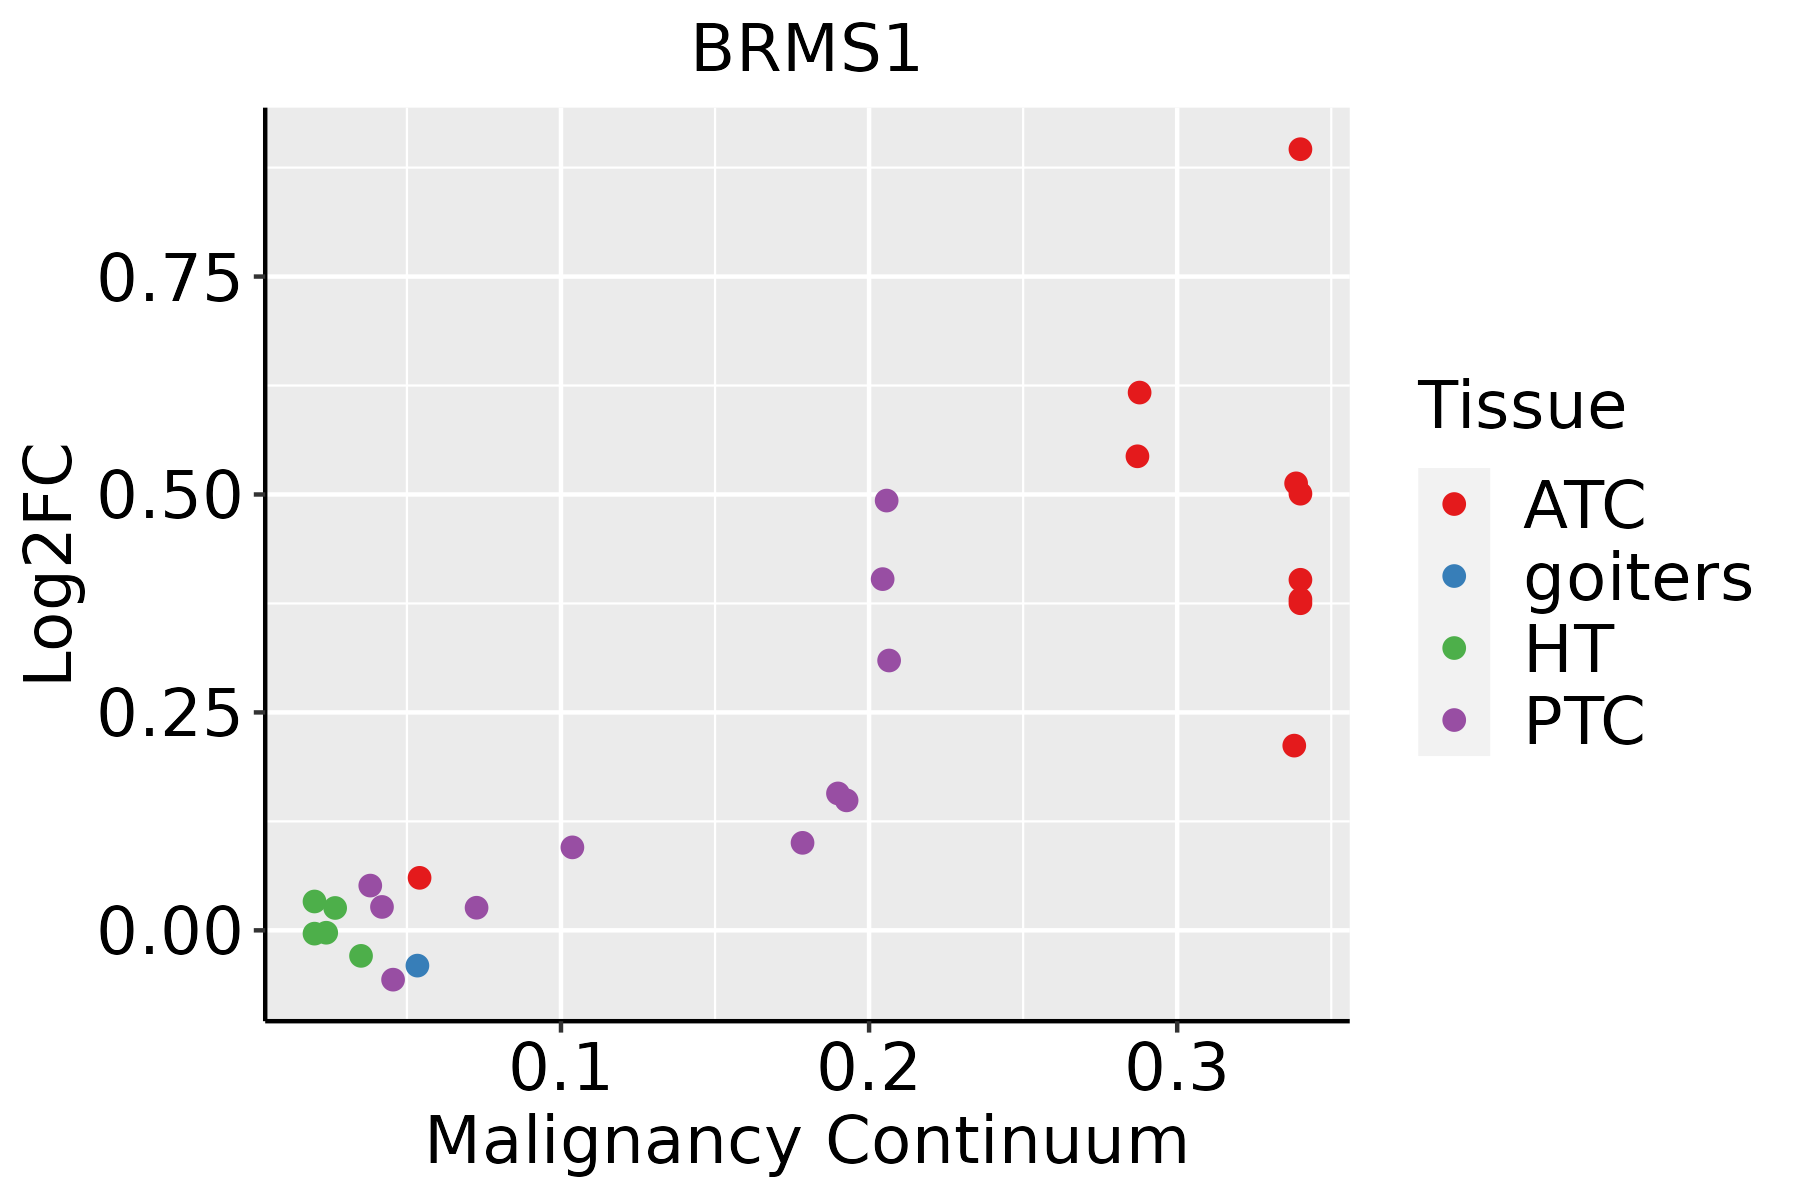 | ATC: Anaplastic thyroid cancer |
| HT: Hashimoto's thyroiditis | ||
| PTC: Papillary thyroid cancer |
| ∗log2FC in expression of this searched gene in stem-like cells from each diseased tissue sample relative to stem-like cells in normal samples in each tissue plotted against the malignancy continuum. Samples are colored based on if they are from different disease stage. |
Top |
Malignant transformation related pathway analysis |
| Find out the enriched GO biological processes and KEGG pathways involved in transition from healthy to precancer to cancer |
| Tissue | Disease Stage | Enriched GO biological Processes |
| Colorectum | AD |  |
| Colorectum | SER |  |
| Colorectum | MSS |  |
| Colorectum | MSI-H |  |
| Colorectum | FAP |  |
| ∗Top 15 enriched GO BP terms are showed in the bar plot of each disease state in each tissue. Each row represents a significant GO biological process which is colored according to the -log10(p.adjust). |
| Page: 1 2 3 4 5 6 7 8 9 |
| GO ID | Tissue | Disease Stage | Description | Gene Ratio | Bg Ratio | pvalue | p.adjust | Count |
| GO:00165708 | Esophagus | HGIN | histone modification | 92/2587 | 463/18723 | 1.70e-04 | 3.30e-03 | 92 |
| GO:001657015 | Esophagus | ESCC | histone modification | 323/8552 | 463/18723 | 2.61e-26 | 7.88e-24 | 323 |
| GO:00356015 | Esophagus | ESCC | protein deacylation | 79/8552 | 112/18723 | 8.30e-08 | 1.42e-06 | 79 |
| GO:00987325 | Esophagus | ESCC | macromolecule deacylation | 80/8552 | 116/18723 | 3.19e-07 | 4.50e-06 | 80 |
| GO:00165754 | Esophagus | ESCC | histone deacetylation | 60/8552 | 82/18723 | 3.85e-07 | 5.32e-06 | 60 |
| GO:00510908 | Esophagus | ESCC | regulation of DNA-binding transcription factor activity | 252/8552 | 440/18723 | 5.22e-07 | 6.97e-06 | 252 |
| GO:00064765 | Esophagus | ESCC | protein deacetylation | 70/8552 | 101/18723 | 1.29e-06 | 1.58e-05 | 70 |
| GO:20002093 | Esophagus | ESCC | regulation of anoikis | 20/8552 | 24/18723 | 1.69e-04 | 1.11e-03 | 20 |
| GO:00432761 | Esophagus | ESCC | anoikis | 26/8552 | 34/18723 | 2.53e-04 | 1.55e-03 | 26 |
| GO:00903122 | Esophagus | ESCC | positive regulation of protein deacetylation | 20/8552 | 25/18723 | 4.81e-04 | 2.69e-03 | 20 |
| GO:00434332 | Esophagus | ESCC | negative regulation of DNA-binding transcription factor activity | 103/8552 | 185/18723 | 3.86e-03 | 1.57e-02 | 103 |
| GO:00320882 | Esophagus | ESCC | negative regulation of NF-kappaB transcription factor activity | 54/8552 | 93/18723 | 1.08e-02 | 3.67e-02 | 54 |
| GO:00903114 | Esophagus | ESCC | regulation of protein deacetylation | 30/8552 | 48/18723 | 1.40e-02 | 4.57e-02 | 30 |
| GO:001657011 | Liver | Cirrhotic | histone modification | 154/4634 | 463/18723 | 1.92e-05 | 2.57e-04 | 154 |
| GO:0035601 | Liver | Cirrhotic | protein deacylation | 39/4634 | 112/18723 | 1.08e-02 | 4.75e-02 | 39 |
| GO:001657021 | Liver | HCC | histone modification | 283/7958 | 463/18723 | 2.68e-16 | 2.33e-14 | 283 |
| GO:0098732 | Liver | HCC | macromolecule deacylation | 67/7958 | 116/18723 | 6.46e-04 | 3.99e-03 | 67 |
| GO:00510902 | Liver | HCC | regulation of DNA-binding transcription factor activity | 220/7958 | 440/18723 | 8.04e-04 | 4.82e-03 | 220 |
| GO:00356011 | Liver | HCC | protein deacylation | 64/7958 | 112/18723 | 1.23e-03 | 6.83e-03 | 64 |
| GO:0090311 | Liver | HCC | regulation of protein deacetylation | 30/7958 | 48/18723 | 4.10e-03 | 1.78e-02 | 30 |
| Page: 1 2 3 4 |
| Pathway ID | Tissue | Disease Stage | Description | Gene Ratio | Bg Ratio | pvalue | p.adjust | qvalue | Count |
| Page: 1 |
Top |
Cell-cell communication analysis |
| Identification of potential cell-cell interactions between two cell types and their ligand-receptor pairs for different disease states |
| Ligand | Receptor | LRpair | Pathway | Tissue | Disease Stage |
| Page: 1 |
Top |
Single-cell gene regulatory network inference analysis |
| Find out the significant the regulons (TFs) and the target genes of each regulon across cell types for different disease states |
| TF | Cell Type | Tissue | Disease Stage | Target Gene | RSS | Regulon Activity |
| ∗The dot plots of a searched regulon are shown for all cell subpopulations in each disease state of each tissue based on the regulon specific score inferred using pySCENIC and by calculating the average expression. |
| Page: 1 |
Top |
Somatic mutation of malignant transformation related genes |
| Annotation of somatic variants for genes involved in malignant transformation |
| Hugo Symbol | Variant Class | Variant Classification | dbSNP RS | HGVSc | HGVSp | HGVSp Short | SWISSPROT | BIOTYPE | SIFT | PolyPhen | Tumor Sample Barcode | Tissue | Histology | Sex | Age | Stage | Therapy Types | Drugs | Outcome |
| BRMS1 | SNV | Missense_Mutation | novel | c.349C>G | p.Gln117Glu | p.Q117E | protein_coding | tolerated(0.64) | benign(0.043) | TCGA-XX-A89A-01 | Breast | breast invasive carcinoma | Female | >=65 | I/II | Unknown | Unknown | SD | |
| BRMS1 | SNV | Missense_Mutation | c.137C>G | p.Ser46Cys | p.S46C | protein_coding | deleterious(0) | probably_damaging(0.97) | TCGA-C5-A1BM-01 | Cervix | cervical & endocervical cancer | Female | >=65 | I/II | Unknown | Unknown | SD | ||
| BRMS1 | SNV | Missense_Mutation | rs756789967 | c.559G>A | p.Ala187Thr | p.A187T | protein_coding | tolerated(0.35) | benign(0.009) | TCGA-C5-A2M2-01 | Cervix | cervical & endocervical cancer | Female | <65 | I/II | Unknown | Unknown | SD | |
| BRMS1 | SNV | Missense_Mutation | c.742N>G | p.Thr248Ala | p.T248A | protein_coding | tolerated_low_confidence(0.71) | benign(0) | TCGA-C5-A7X3-01 | Cervix | cervical & endocervical cancer | Female | >=65 | III/IV | Chemotherapy | cisplatin | SD | ||
| BRMS1 | SNV | Missense_Mutation | rs768620232 | c.403N>A | p.Glu135Lys | p.E135K | protein_coding | deleterious(0.04) | probably_damaging(0.957) | TCGA-AA-3984-01 | Colorectum | colon adenocarcinoma | Female | <65 | I/II | Unknown | Unknown | SD | |
| BRMS1 | SNV | Missense_Mutation | c.728N>T | p.Ser243Leu | p.S243L | protein_coding | tolerated(0.11) | benign(0.051) | TCGA-AU-6004-01 | Colorectum | colon adenocarcinoma | Female | >=65 | I/II | Unknown | Unknown | SD | ||
| BRMS1 | SNV | Missense_Mutation | c.213N>A | p.Phe71Leu | p.F71L | protein_coding | deleterious(0) | probably_damaging(0.999) | TCGA-CA-6717-01 | Colorectum | colon adenocarcinoma | Male | <65 | I/II | Chemotherapy | oxaliplatin | CR | ||
| BRMS1 | SNV | Missense_Mutation | novel | c.106G>A | p.Gly36Ser | p.G36S | protein_coding | tolerated(0.54) | benign(0.122) | TCGA-CK-4951-01 | Colorectum | colon adenocarcinoma | Female | >=65 | I/II | Unknown | Unknown | PD | |
| BRMS1 | SNV | Missense_Mutation | c.710C>A | p.Ser237Tyr | p.S237Y | protein_coding | deleterious(0.03) | probably_damaging(0.93) | TCGA-A5-A0G1-01 | Endometrium | uterine corpus endometrioid carcinoma | Female | >=65 | I/II | Unknown | Unknown | SD | ||
| BRMS1 | SNV | Missense_Mutation | rs199579517 | c.640G>A | p.Val214Met | p.V214M | protein_coding | deleterious(0) | probably_damaging(0.961) | TCGA-A5-A0G1-01 | Endometrium | uterine corpus endometrioid carcinoma | Female | >=65 | I/II | Unknown | Unknown | SD |
| Page: 1 2 3 |
Top |
Related drugs of malignant transformation related genes |
| Identification of chemicals and drugs interact with genes involved in malignant transfromation |
| (DGIdb 4.0) |
| Entrez ID | Symbol | Category | Interaction Types | Drug Claim Name | Drug Name | PMIDs |
| Page: 1 |

Copyright 2023-Present -The University of Texas Health Science Center at Houston |