
|
|||||
|
 | |
| |
| |
| |
| |
| |
|
Gene: BRINP1 |
Gene summary for BRINP1 |
| Gene information | Species | Human | Gene symbol | BRINP1 | Gene ID | 1620 |
| Gene name | BMP/retinoic acid inducible neural specific 1 | |
| Gene Alias | DBC1 | |
| Cytomap | 9q33.1 | |
| Gene Type | protein-coding | GO ID | GO:0000003 | UniProtAcc | O60477 |
Top |
Malignant transformation analysis |
| Identification of the aberrant gene expression in precancerous and cancerous lesions by comparing the gene expression of stem-like cells in diseased tissues with normal stem cells |
| Entrez ID | Symbol | Replicates | Species | Organ | Tissue | Adj P-value | Log2FC | Malignancy |
| 1620 | BRINP1 | RNA-P3T-P3T-1 | Human | Lung | IAC | 1.19e-15 | 1.00e+00 | 0.1829 |
| 1620 | BRINP1 | RNA-P3T-P3T-2 | Human | Lung | IAC | 4.53e-15 | 9.84e-01 | 0.1835 |
| 1620 | BRINP1 | RNA-P3T-P3T-3 | Human | Lung | IAC | 4.38e-04 | 9.59e-01 | 0.1745 |
| 1620 | BRINP1 | RNA-P3T-P3T-4 | Human | Lung | IAC | 4.27e-23 | 1.21e+00 | 0.1859 |
| Page: 1 |
| Tissue | Expression Dynamics | Abbreviation |
| Lung | 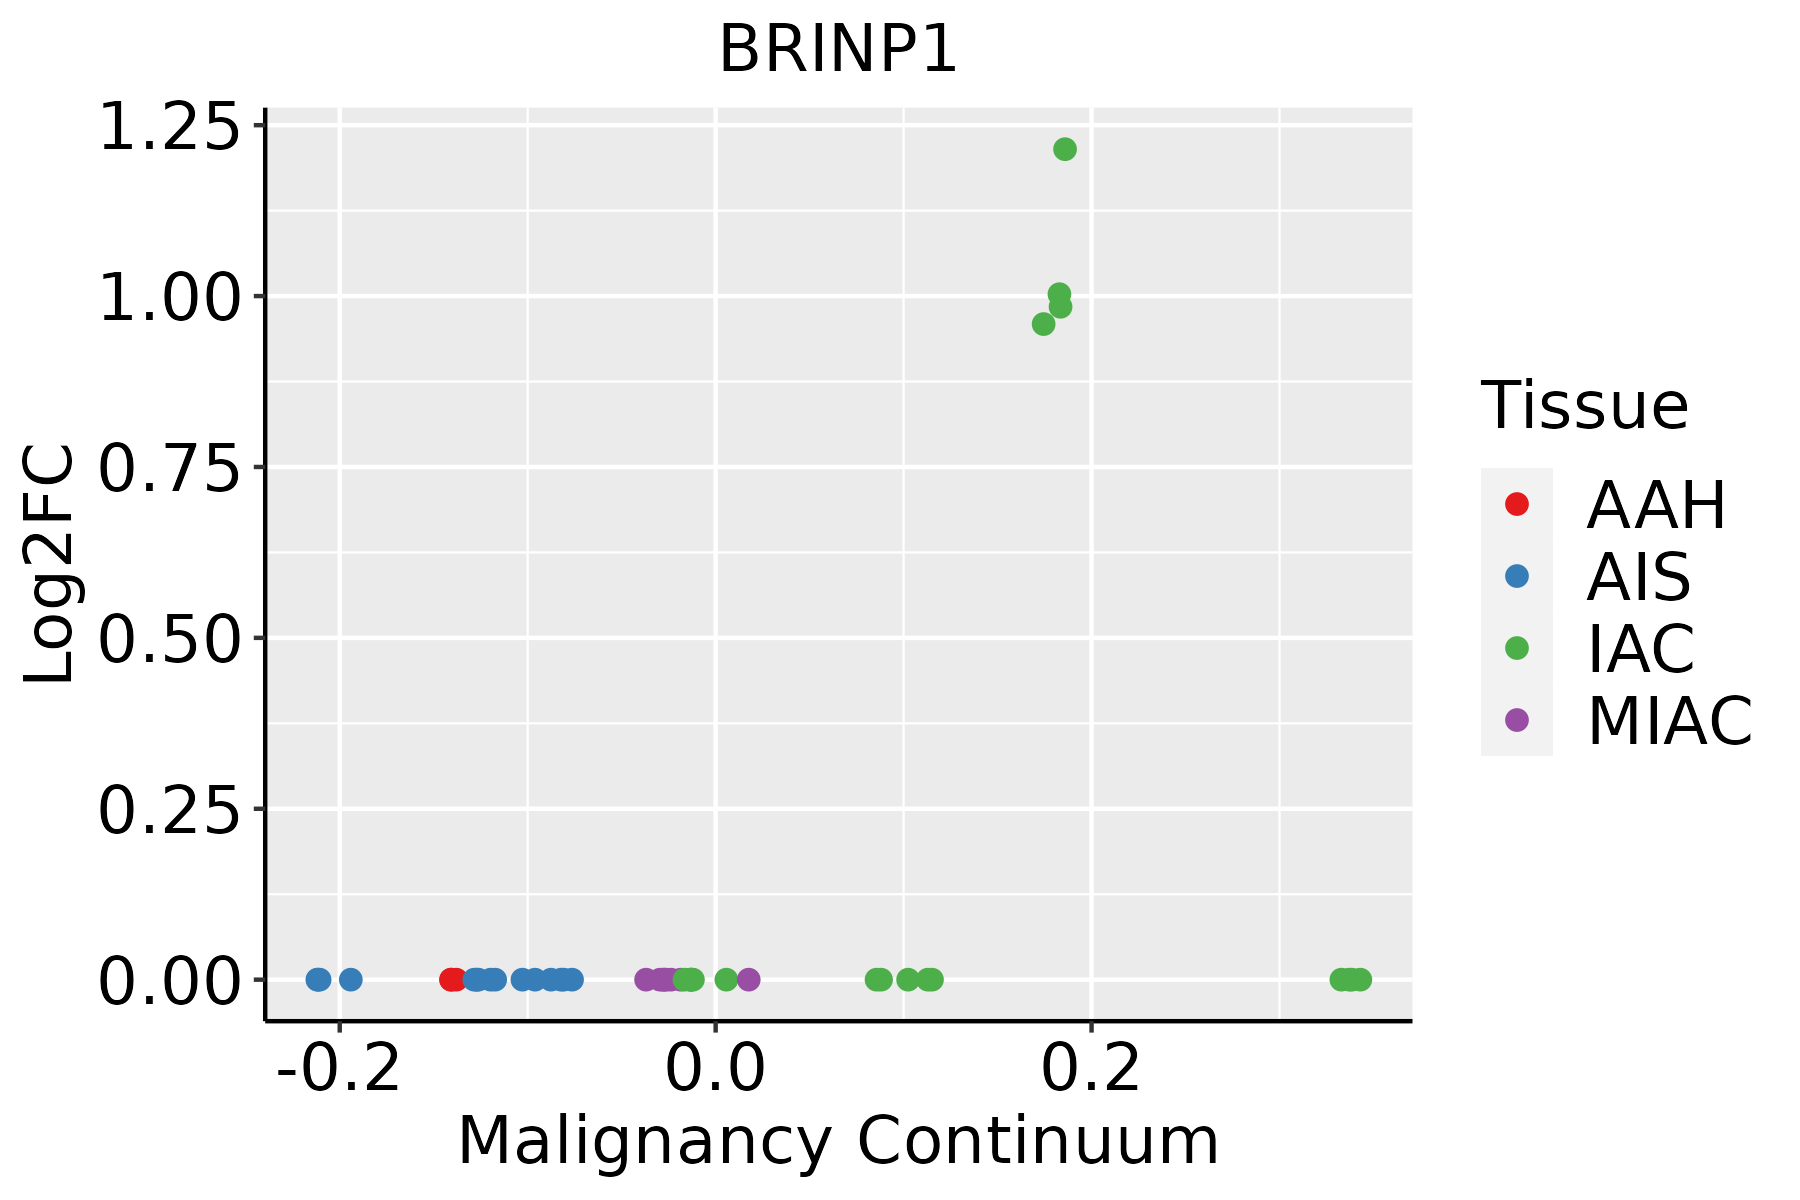 | AAH: Atypical adenomatous hyperplasia |
| AIS: Adenocarcinoma in situ | ||
| IAC: Invasive lung adenocarcinoma | ||
| MIA: Minimally invasive adenocarcinoma |
| ∗log2FC in expression of this searched gene in stem-like cells from each diseased tissue sample relative to stem-like cells in normal samples in each tissue plotted against the malignancy continuum. Samples are colored based on if they are from different disease stage. |
Top |
Malignant transformation related pathway analysis |
| Find out the enriched GO biological processes and KEGG pathways involved in transition from healthy to precancer to cancer |
| Tissue | Disease Stage | Enriched GO biological Processes |
| Colorectum | AD |  |
| Colorectum | SER |  |
| Colorectum | MSS |  |
| Colorectum | MSI-H |  |
| Colorectum | FAP |  |
| ∗Top 15 enriched GO BP terms are showed in the bar plot of each disease state in each tissue. Each row represents a significant GO biological process which is colored according to the -log10(p.adjust). |
| Page: 1 2 3 4 5 6 7 8 9 |
| GO ID | Tissue | Disease Stage | Description | Gene Ratio | Bg Ratio | pvalue | p.adjust | Count |
| GO:00073464 | Lung | IAC | regulation of mitotic cell cycle | 78/2061 | 457/18723 | 5.37e-05 | 1.21e-03 | 78 |
| GO:00457861 | Lung | IAC | negative regulation of cell cycle | 67/2061 | 385/18723 | 9.74e-05 | 1.93e-03 | 67 |
| GO:00459301 | Lung | IAC | negative regulation of mitotic cell cycle | 45/2061 | 235/18723 | 1.49e-04 | 2.73e-03 | 45 |
| GO:00507675 | Lung | IAC | regulation of neurogenesis | 57/2061 | 364/18723 | 3.92e-03 | 3.24e-02 | 57 |
| Page: 1 |
| Pathway ID | Tissue | Disease Stage | Description | Gene Ratio | Bg Ratio | pvalue | p.adjust | qvalue | Count |
| Page: 1 |
Top |
Cell-cell communication analysis |
| Identification of potential cell-cell interactions between two cell types and their ligand-receptor pairs for different disease states |
| Ligand | Receptor | LRpair | Pathway | Tissue | Disease Stage |
| Page: 1 |
Top |
Single-cell gene regulatory network inference analysis |
| Find out the significant the regulons (TFs) and the target genes of each regulon across cell types for different disease states |
| TF | Cell Type | Tissue | Disease Stage | Target Gene | RSS | Regulon Activity |
| ∗The dot plots of a searched regulon are shown for all cell subpopulations in each disease state of each tissue based on the regulon specific score inferred using pySCENIC and by calculating the average expression. |
| Page: 1 |
Top |
Somatic mutation of malignant transformation related genes |
| Annotation of somatic variants for genes involved in malignant transformation |
| Hugo Symbol | Variant Class | Variant Classification | dbSNP RS | HGVSc | HGVSp | HGVSp Short | SWISSPROT | BIOTYPE | SIFT | PolyPhen | Tumor Sample Barcode | Tissue | Histology | Sex | Age | Stage | Therapy Types | Drugs | Outcome |
| BRINP1 | SNV | Missense_Mutation | rs540545974 | c.1072N>T | p.Arg358Cys | p.R358C | O60477 | protein_coding | deleterious(0) | possibly_damaging(0.454) | TCGA-A2-A0D0-01 | Breast | breast invasive carcinoma | Female | <65 | I/II | Chemotherapy | cytoxan | SD |
| BRINP1 | SNV | Missense_Mutation | c.1576C>A | p.Leu526Ile | p.L526I | O60477 | protein_coding | deleterious(0.04) | possibly_damaging(0.899) | TCGA-A2-A0YG-01 | Breast | breast invasive carcinoma | Female | <65 | III/IV | Chemotherapy | cytoxan | SD | |
| BRINP1 | SNV | Missense_Mutation | c.155G>T | p.Arg52Met | p.R52M | O60477 | protein_coding | tolerated(0.06) | possibly_damaging(0.756) | TCGA-A8-A097-01 | Breast | breast invasive carcinoma | Female | >=65 | I/II | Hormone Therapy | tamoxiphen | SD | |
| BRINP1 | SNV | Missense_Mutation | novel | c.995G>T | p.Trp332Leu | p.W332L | O60477 | protein_coding | deleterious(0) | possibly_damaging(0.901) | TCGA-AC-A5EH-01 | Breast | breast invasive carcinoma | Female | >=65 | I/II | Unknown | Unknown | SD |
| BRINP1 | SNV | Missense_Mutation | c.1202G>A | p.Gly401Glu | p.G401E | O60477 | protein_coding | tolerated(0.35) | probably_damaging(0.998) | TCGA-AN-A0AK-01 | Breast | breast invasive carcinoma | Female | >=65 | I/II | Unknown | Unknown | SD | |
| BRINP1 | SNV | Missense_Mutation | rs763444329 | c.1601G>A | p.Arg534His | p.R534H | O60477 | protein_coding | deleterious(0.01) | probably_damaging(0.964) | TCGA-B6-A0IE-01 | Breast | breast invasive carcinoma | Female | <65 | III/IV | Unknown | Unknown | PD |
| BRINP1 | SNV | Missense_Mutation | rs1473785 | c.662N>T | p.Thr221Met | p.T221M | O60477 | protein_coding | deleterious(0.04) | benign(0.005) | TCGA-BH-A0BZ-01 | Breast | breast invasive carcinoma | Female | <65 | III/IV | Chemotherapy | doxorubicin | CR |
| BRINP1 | SNV | Missense_Mutation | c.704N>T | p.Pro235Leu | p.P235L | O60477 | protein_coding | deleterious(0) | probably_damaging(0.981) | TCGA-D8-A1J8-01 | Breast | breast invasive carcinoma | Female | >=65 | I/II | Hormone Therapy | nolvadex | SD | |
| BRINP1 | SNV | Missense_Mutation | rs151314025 | c.1409N>A | p.Arg470Gln | p.R470Q | O60477 | protein_coding | tolerated(0.38) | possibly_damaging(0.539) | TCGA-D8-A1XQ-01 | Breast | breast invasive carcinoma | Female | >=65 | I/II | Unknown | Unknown | SD |
| BRINP1 | SNV | Missense_Mutation | rs866443418 | c.1819C>T | p.Arg607Trp | p.R607W | O60477 | protein_coding | deleterious(0) | possibly_damaging(0.639) | TCGA-E2-A14R-01 | Breast | breast invasive carcinoma | Female | <65 | I/II | Chemotherapy | doxorubicin | PD |
| Page: 1 2 3 4 5 6 7 8 9 10 11 12 13 14 15 16 17 18 19 |
Top |
Related drugs of malignant transformation related genes |
| Identification of chemicals and drugs interact with genes involved in malignant transfromation |
| (DGIdb 4.0) |
| Entrez ID | Symbol | Category | Interaction Types | Drug Claim Name | Drug Name | PMIDs |
| Page: 1 |

Copyright 2023-Present -The University of Texas Health Science Center at Houston |