
|
|||||
|
 | |
| |
| |
| |
| |
| |
|
Gene: BRF2 |
Gene summary for BRF2 |
| Gene information | Species | Human | Gene symbol | BRF2 | Gene ID | 55290 |
| Gene name | BRF2 RNA polymerase III transcription initiation factor subunit | |
| Gene Alias | BRFU | |
| Cytomap | 8p11.23 | |
| Gene Type | protein-coding | GO ID | GO:0006139 | UniProtAcc | Q9HAW0 |
Top |
Malignant transformation analysis |
| Identification of the aberrant gene expression in precancerous and cancerous lesions by comparing the gene expression of stem-like cells in diseased tissues with normal stem cells |
| Entrez ID | Symbol | Replicates | Species | Organ | Tissue | Adj P-value | Log2FC | Malignancy |
| 55290 | BRF2 | LZE4T | Human | Esophagus | ESCC | 2.12e-07 | 1.83e-01 | 0.0811 |
| 55290 | BRF2 | LZE7T | Human | Esophagus | ESCC | 2.44e-04 | 1.37e-01 | 0.0667 |
| 55290 | BRF2 | LZE24T | Human | Esophagus | ESCC | 3.49e-07 | 1.31e-01 | 0.0596 |
| 55290 | BRF2 | P2T-E | Human | Esophagus | ESCC | 4.40e-19 | 3.36e-01 | 0.1177 |
| 55290 | BRF2 | P4T-E | Human | Esophagus | ESCC | 1.24e-19 | 3.92e-01 | 0.1323 |
| 55290 | BRF2 | P5T-E | Human | Esophagus | ESCC | 1.11e-08 | 8.04e-02 | 0.1327 |
| 55290 | BRF2 | P8T-E | Human | Esophagus | ESCC | 8.69e-19 | 1.80e-01 | 0.0889 |
| 55290 | BRF2 | P9T-E | Human | Esophagus | ESCC | 4.70e-05 | 4.73e-02 | 0.1131 |
| 55290 | BRF2 | P10T-E | Human | Esophagus | ESCC | 1.58e-15 | 2.25e-01 | 0.116 |
| 55290 | BRF2 | P11T-E | Human | Esophagus | ESCC | 5.13e-09 | 3.49e-01 | 0.1426 |
| 55290 | BRF2 | P12T-E | Human | Esophagus | ESCC | 3.54e-19 | 1.98e-01 | 0.1122 |
| 55290 | BRF2 | P15T-E | Human | Esophagus | ESCC | 4.51e-28 | 4.68e-01 | 0.1149 |
| 55290 | BRF2 | P16T-E | Human | Esophagus | ESCC | 6.50e-32 | 2.77e-01 | 0.1153 |
| 55290 | BRF2 | P17T-E | Human | Esophagus | ESCC | 3.65e-05 | 1.67e-01 | 0.1278 |
| 55290 | BRF2 | P19T-E | Human | Esophagus | ESCC | 4.51e-06 | 3.95e-01 | 0.1662 |
| 55290 | BRF2 | P20T-E | Human | Esophagus | ESCC | 2.08e-14 | 1.69e-01 | 0.1124 |
| 55290 | BRF2 | P21T-E | Human | Esophagus | ESCC | 4.64e-16 | 2.71e-01 | 0.1617 |
| 55290 | BRF2 | P22T-E | Human | Esophagus | ESCC | 1.81e-20 | 1.50e-01 | 0.1236 |
| 55290 | BRF2 | P23T-E | Human | Esophagus | ESCC | 7.29e-12 | 3.03e-01 | 0.108 |
| 55290 | BRF2 | P24T-E | Human | Esophagus | ESCC | 1.72e-10 | 1.87e-01 | 0.1287 |
| Page: 1 2 3 4 |
| Tissue | Expression Dynamics | Abbreviation |
| Esophagus | 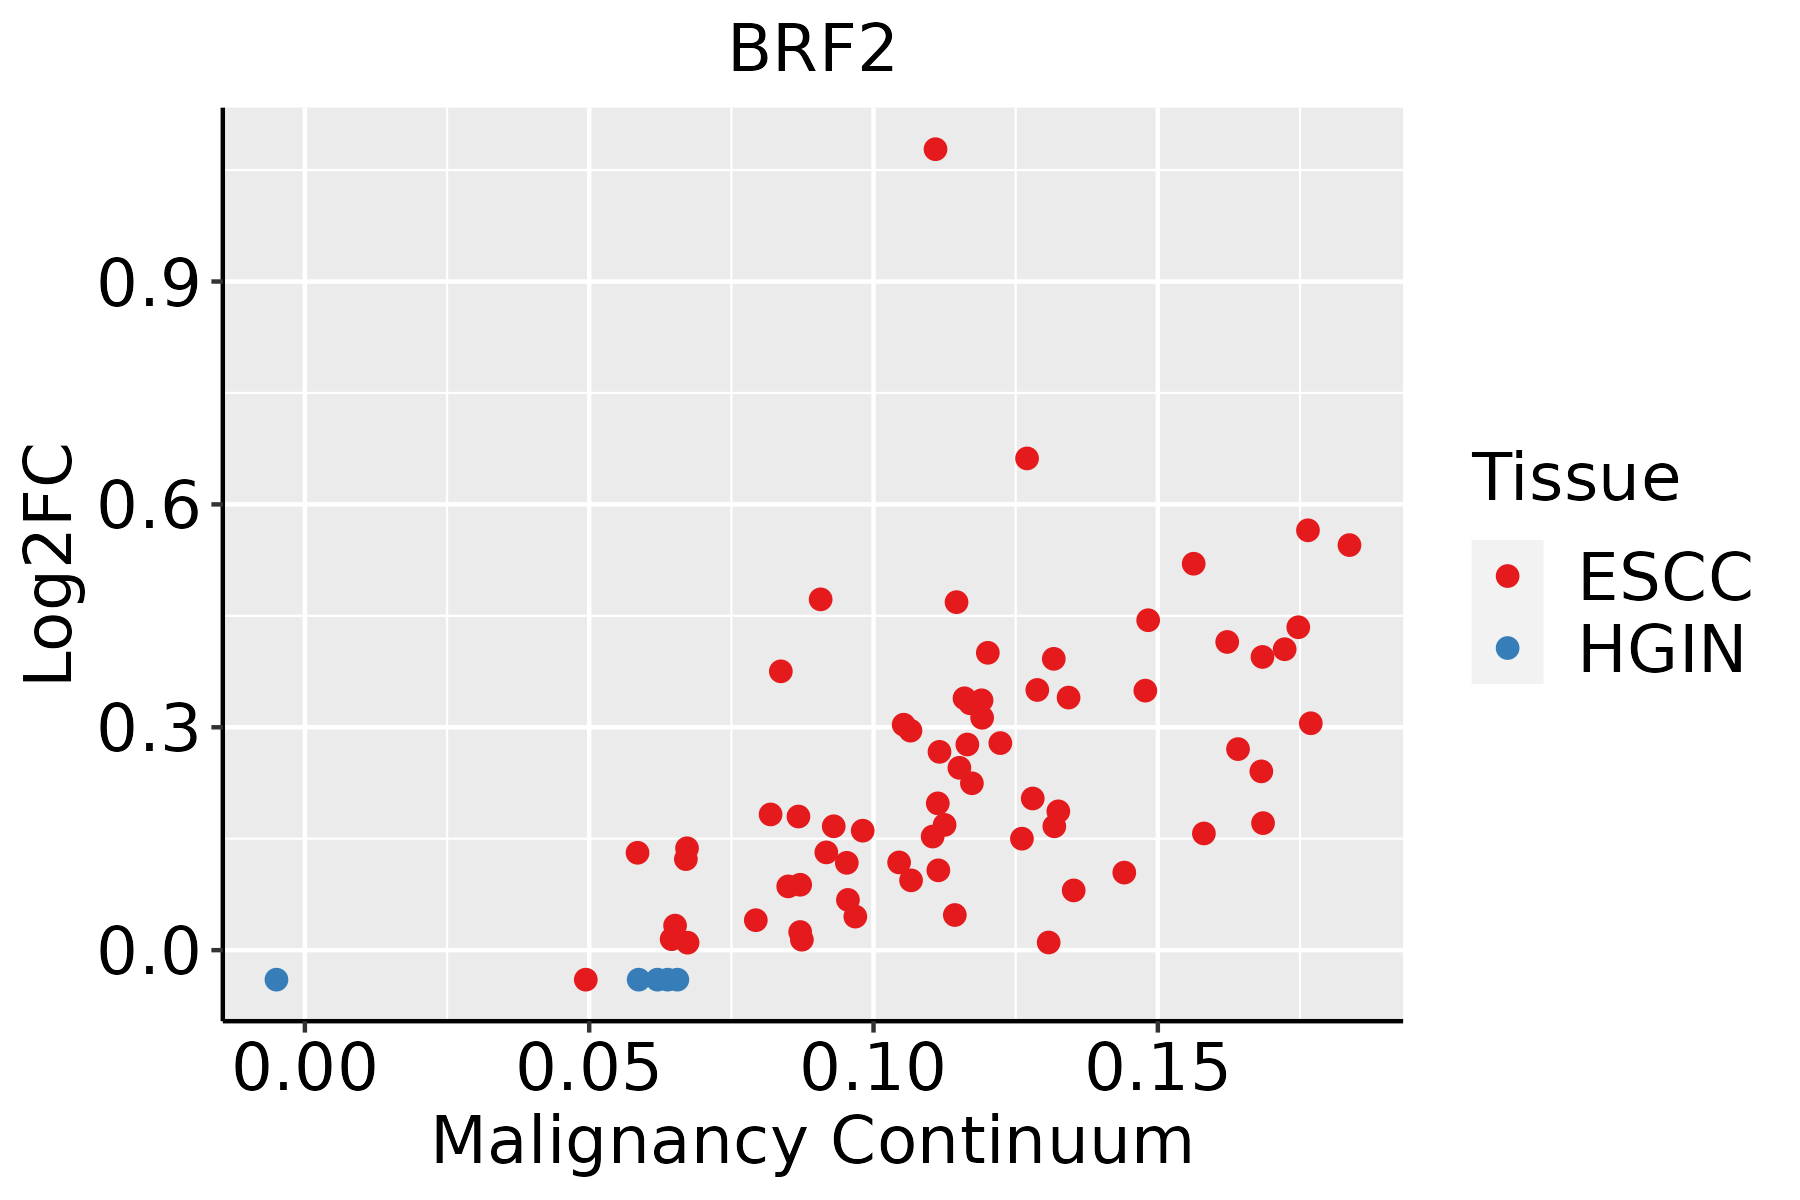 | ESCC: Esophageal squamous cell carcinoma |
| HGIN: High-grade intraepithelial neoplasias | ||
| LGIN: Low-grade intraepithelial neoplasias | ||
| Oral Cavity | 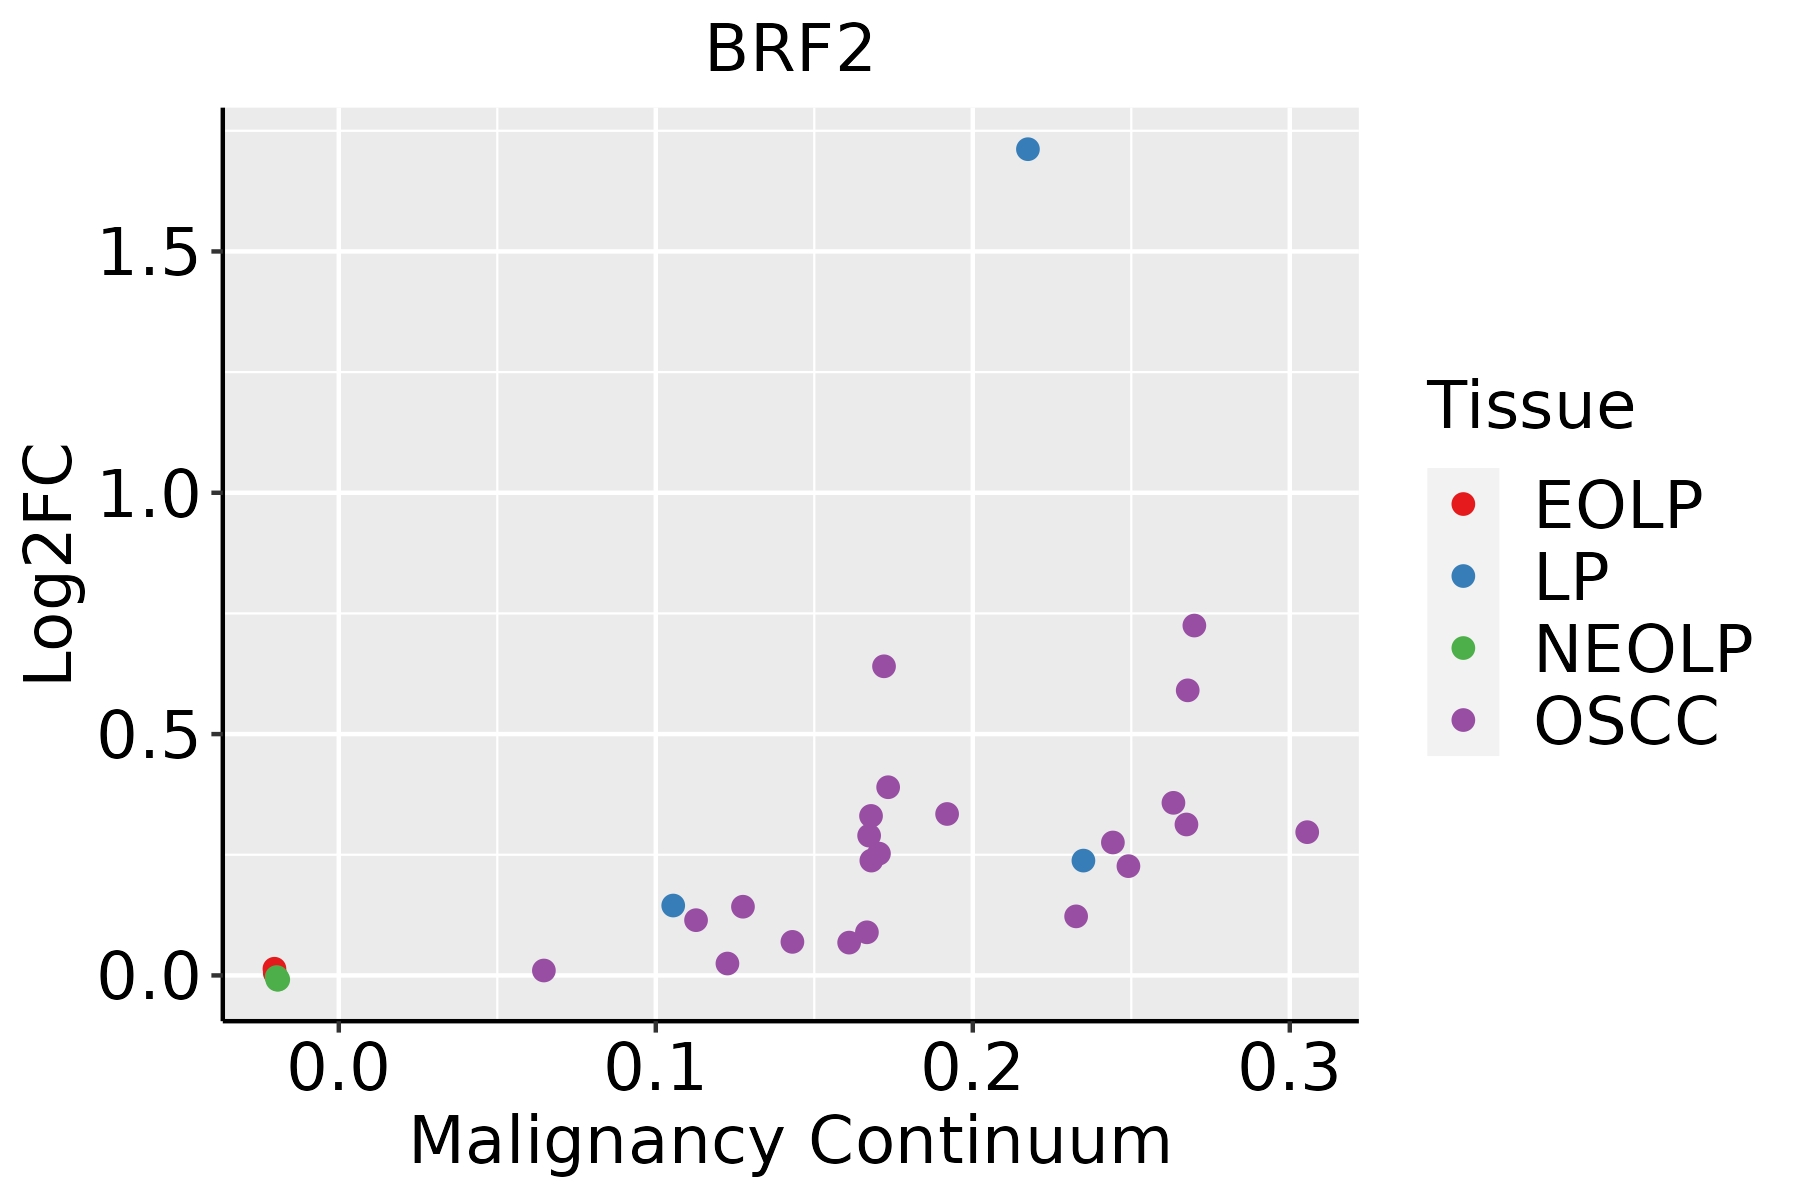 | EOLP: Erosive Oral lichen planus |
| LP: leukoplakia | ||
| NEOLP: Non-erosive oral lichen planus | ||
| OSCC: Oral squamous cell carcinoma |
| ∗log2FC in expression of this searched gene in stem-like cells from each diseased tissue sample relative to stem-like cells in normal samples in each tissue plotted against the malignancy continuum. Samples are colored based on if they are from different disease stage. |
Top |
Malignant transformation related pathway analysis |
| Find out the enriched GO biological processes and KEGG pathways involved in transition from healthy to precancer to cancer |
| Tissue | Disease Stage | Enriched GO biological Processes |
| Colorectum | AD |  |
| Colorectum | SER |  |
| Colorectum | MSS |  |
| Colorectum | MSI-H |  |
| Colorectum | FAP |  |
| ∗Top 15 enriched GO BP terms are showed in the bar plot of each disease state in each tissue. Each row represents a significant GO biological process which is colored according to the -log10(p.adjust). |
| Page: 1 2 3 4 5 6 7 8 9 |
| GO ID | Tissue | Disease Stage | Description | Gene Ratio | Bg Ratio | pvalue | p.adjust | Count |
| GO:0006979111 | Esophagus | ESCC | response to oxidative stress | 303/8552 | 446/18723 | 7.15e-22 | 1.30e-19 | 303 |
| GO:0062197111 | Esophagus | ESCC | cellular response to chemical stress | 234/8552 | 337/18723 | 5.37e-19 | 5.97e-17 | 234 |
| GO:0034599111 | Esophagus | ESCC | cellular response to oxidative stress | 197/8552 | 288/18723 | 3.76e-15 | 2.15e-13 | 197 |
| GO:00063833 | Esophagus | ESCC | transcription by RNA polymerase III | 41/8552 | 46/18723 | 7.69e-10 | 1.90e-08 | 41 |
| GO:000635211 | Esophagus | ESCC | DNA-templated transcription, initiation | 86/8552 | 130/18723 | 1.88e-06 | 2.19e-05 | 86 |
| GO:00708973 | Esophagus | ESCC | transcription preinitiation complex assembly | 30/8552 | 36/18723 | 3.60e-06 | 3.95e-05 | 30 |
| GO:0006359 | Esophagus | ESCC | regulation of transcription by RNA polymerase III | 19/8552 | 22/18723 | 9.52e-05 | 6.78e-04 | 19 |
| GO:000697920 | Oral cavity | OSCC | response to oxidative stress | 273/7305 | 446/18723 | 8.35e-22 | 1.65e-19 | 273 |
| GO:006219720 | Oral cavity | OSCC | cellular response to chemical stress | 204/7305 | 337/18723 | 6.89e-16 | 5.19e-14 | 204 |
| GO:003459920 | Oral cavity | OSCC | cellular response to oxidative stress | 173/7305 | 288/18723 | 2.90e-13 | 1.43e-11 | 173 |
| GO:00063832 | Oral cavity | OSCC | transcription by RNA polymerase III | 34/7305 | 46/18723 | 1.61e-06 | 2.11e-05 | 34 |
| GO:00063522 | Oral cavity | OSCC | DNA-templated transcription, initiation | 74/7305 | 130/18723 | 2.56e-05 | 2.39e-04 | 74 |
| GO:00708972 | Oral cavity | OSCC | transcription preinitiation complex assembly | 24/7305 | 36/18723 | 7.18e-04 | 3.95e-03 | 24 |
| GO:0006979110 | Oral cavity | LP | response to oxidative stress | 181/4623 | 446/18723 | 5.74e-14 | 6.10e-12 | 181 |
| GO:0062197110 | Oral cavity | LP | cellular response to chemical stress | 130/4623 | 337/18723 | 8.94e-09 | 3.52e-07 | 130 |
| GO:0034599110 | Oral cavity | LP | cellular response to oxidative stress | 110/4623 | 288/18723 | 2.19e-07 | 6.65e-06 | 110 |
| GO:007089711 | Oral cavity | LP | transcription preinitiation complex assembly | 17/4623 | 36/18723 | 2.74e-03 | 1.92e-02 | 17 |
| GO:00063831 | Oral cavity | LP | transcription by RNA polymerase III | 20/4623 | 46/18723 | 4.03e-03 | 2.61e-02 | 20 |
| GO:00063521 | Oral cavity | LP | DNA-templated transcription, initiation | 45/4623 | 130/18723 | 7.03e-03 | 3.96e-02 | 45 |
| Page: 1 |
| Pathway ID | Tissue | Disease Stage | Description | Gene Ratio | Bg Ratio | pvalue | p.adjust | qvalue | Count |
| Page: 1 |
Top |
Cell-cell communication analysis |
| Identification of potential cell-cell interactions between two cell types and their ligand-receptor pairs for different disease states |
| Ligand | Receptor | LRpair | Pathway | Tissue | Disease Stage |
| Page: 1 |
Top |
Single-cell gene regulatory network inference analysis |
| Find out the significant the regulons (TFs) and the target genes of each regulon across cell types for different disease states |
| TF | Cell Type | Tissue | Disease Stage | Target Gene | RSS | Regulon Activity |
| BRF2 | SMC | Oral cavity | ADJ | ENOX2,FASTKD1,TIMM8A, etc. | 3.06e-01 |  |
| BRF2 | SMC | Stomach | ADJ | AC098829.1,KCNE4,TIMM9, etc. | 1.20e-01 |  |
| ∗The dot plots of a searched regulon are shown for all cell subpopulations in each disease state of each tissue based on the regulon specific score inferred using pySCENIC and by calculating the average expression. |
| Page: 1 |
Top |
Somatic mutation of malignant transformation related genes |
| Annotation of somatic variants for genes involved in malignant transformation |
| Hugo Symbol | Variant Class | Variant Classification | dbSNP RS | HGVSc | HGVSp | HGVSp Short | SWISSPROT | BIOTYPE | SIFT | PolyPhen | Tumor Sample Barcode | Tissue | Histology | Sex | Age | Stage | Therapy Types | Drugs | Outcome |
| BRF2 | SNV | Missense_Mutation | novel | c.746G>A | p.Arg249Gln | p.R249Q | Q9HAW0 | protein_coding | tolerated(0.14) | benign(0) | TCGA-A7-A5ZX-01 | Breast | breast invasive carcinoma | Female | <65 | III/IV | Chemotherapy | doxorubicin | CR |
| BRF2 | SNV | Missense_Mutation | c.877G>T | p.Val293Leu | p.V293L | Q9HAW0 | protein_coding | deleterious(0) | possibly_damaging(0.625) | TCGA-A8-A09I-01 | Breast | breast invasive carcinoma | Female | >=65 | I/II | Hormone Therapy | anastrozole | SD | |
| BRF2 | insertion | Frame_Shift_Ins | novel | c.158_159insC | p.Thr54AsnfsTer13 | p.T54Nfs*13 | Q9HAW0 | protein_coding | TCGA-A7-A0CJ-01 | Breast | breast invasive carcinoma | Female | <65 | I/II | Chemotherapy | cytoxan | SD | ||
| BRF2 | insertion | Frame_Shift_Ins | novel | c.157_158insGAGGCGGAGCTTGCAGTGAGCCGAGA | p.Val53GlyfsTer10 | p.V53Gfs*10 | Q9HAW0 | protein_coding | TCGA-A7-A0CJ-01 | Breast | breast invasive carcinoma | Female | <65 | I/II | Chemotherapy | cytoxan | SD | ||
| BRF2 | insertion | In_Frame_Ins | novel | c.707_708insTTCTAATATGTCTGT | p.Ser236_Leu237insSerAsnMetSerVal | p.S236_L237insSNMSV | Q9HAW0 | protein_coding | TCGA-A8-A08H-01 | Breast | breast invasive carcinoma | Female | >=65 | I/II | Unknown | Unknown | SD | ||
| BRF2 | insertion | Frame_Shift_Ins | novel | c.259_260insATGTAAAAGGATGTGGG | p.Pro87HisfsTer43 | p.P87Hfs*43 | Q9HAW0 | protein_coding | TCGA-BH-A0AW-01 | Breast | breast invasive carcinoma | Female | <65 | I/II | Chemotherapy | carboplatin | SD | ||
| BRF2 | insertion | Frame_Shift_Ins | novel | c.258_259insTCTCTTTTTTACCAAAGCC | p.Pro87SerfsTer10 | p.P87Sfs*10 | Q9HAW0 | protein_coding | TCGA-BH-A0AW-01 | Breast | breast invasive carcinoma | Female | <65 | I/II | Chemotherapy | carboplatin | SD | ||
| BRF2 | SNV | Missense_Mutation | c.247N>A | p.Leu83Met | p.L83M | Q9HAW0 | protein_coding | deleterious(0) | possibly_damaging(0.729) | TCGA-IR-A3LA-01 | Cervix | cervical & endocervical cancer | Female | <65 | I/II | Chemotherapy | cisplatin | CR | |
| BRF2 | SNV | Missense_Mutation | c.994G>A | p.Gly332Arg | p.G332R | Q9HAW0 | protein_coding | tolerated(0.47) | benign(0.003) | TCGA-A6-6781-01 | Colorectum | colon adenocarcinoma | Male | <65 | III/IV | Chemotherapy | oxaliplatin | SD | |
| BRF2 | SNV | Missense_Mutation | rs140725525 | c.497C>T | p.Ser166Phe | p.S166F | Q9HAW0 | protein_coding | tolerated(0.06) | possibly_damaging(0.553) | TCGA-AA-A010-01 | Colorectum | colon adenocarcinoma | Female | <65 | I/II | Chemotherapy | folinic | CR |
| Page: 1 2 3 4 |
Top |
Related drugs of malignant transformation related genes |
| Identification of chemicals and drugs interact with genes involved in malignant transfromation |
| (DGIdb 4.0) |
| Entrez ID | Symbol | Category | Interaction Types | Drug Claim Name | Drug Name | PMIDs |
| Page: 1 |

Copyright 2023-Present -The University of Texas Health Science Center at Houston |