
|
|||||
|
 | |
| |
| |
| |
| |
| |
|
Gene: BRF1 |
Gene summary for BRF1 |
| Gene information | Species | Human | Gene symbol | BRF1 | Gene ID | 2972 |
| Gene name | BRF1 RNA polymerase III transcription initiation factor subunit | |
| Gene Alias | BRF | |
| Cytomap | 14q32.33 | |
| Gene Type | protein-coding | GO ID | GO:0006139 | UniProtAcc | Q92994 |
Top |
Malignant transformation analysis |
| Identification of the aberrant gene expression in precancerous and cancerous lesions by comparing the gene expression of stem-like cells in diseased tissues with normal stem cells |
| Entrez ID | Symbol | Replicates | Species | Organ | Tissue | Adj P-value | Log2FC | Malignancy |
| 2972 | BRF1 | LZE5T | Human | Esophagus | ESCC | 5.06e-03 | 2.20e-01 | 0.0514 |
| 2972 | BRF1 | LZE20T | Human | Esophagus | ESCC | 2.86e-05 | 1.10e-01 | 0.0662 |
| 2972 | BRF1 | LZE24T | Human | Esophagus | ESCC | 8.89e-06 | 1.39e-01 | 0.0596 |
| 2972 | BRF1 | LZE21T | Human | Esophagus | ESCC | 1.22e-04 | 2.22e-01 | 0.0655 |
| 2972 | BRF1 | P1T-E | Human | Esophagus | ESCC | 2.17e-06 | 2.81e-01 | 0.0875 |
| 2972 | BRF1 | P2T-E | Human | Esophagus | ESCC | 7.54e-13 | 2.39e-01 | 0.1177 |
| 2972 | BRF1 | P4T-E | Human | Esophagus | ESCC | 8.96e-16 | 2.78e-01 | 0.1323 |
| 2972 | BRF1 | P5T-E | Human | Esophagus | ESCC | 2.67e-16 | 2.68e-01 | 0.1327 |
| 2972 | BRF1 | P8T-E | Human | Esophagus | ESCC | 2.62e-09 | 1.92e-01 | 0.0889 |
| 2972 | BRF1 | P9T-E | Human | Esophagus | ESCC | 3.22e-05 | 8.32e-02 | 0.1131 |
| 2972 | BRF1 | P10T-E | Human | Esophagus | ESCC | 6.57e-27 | 4.73e-01 | 0.116 |
| 2972 | BRF1 | P11T-E | Human | Esophagus | ESCC | 3.80e-09 | 1.91e-01 | 0.1426 |
| 2972 | BRF1 | P12T-E | Human | Esophagus | ESCC | 1.73e-23 | 4.20e-01 | 0.1122 |
| 2972 | BRF1 | P15T-E | Human | Esophagus | ESCC | 2.92e-26 | 4.63e-01 | 0.1149 |
| 2972 | BRF1 | P16T-E | Human | Esophagus | ESCC | 3.62e-17 | 2.33e-01 | 0.1153 |
| 2972 | BRF1 | P17T-E | Human | Esophagus | ESCC | 3.25e-09 | 2.06e-01 | 0.1278 |
| 2972 | BRF1 | P19T-E | Human | Esophagus | ESCC | 5.08e-03 | 1.85e-01 | 0.1662 |
| 2972 | BRF1 | P20T-E | Human | Esophagus | ESCC | 3.88e-13 | 1.77e-01 | 0.1124 |
| 2972 | BRF1 | P21T-E | Human | Esophagus | ESCC | 2.55e-05 | 1.05e-01 | 0.1617 |
| 2972 | BRF1 | P22T-E | Human | Esophagus | ESCC | 9.31e-05 | 9.61e-02 | 0.1236 |
| Page: 1 2 3 |
| Tissue | Expression Dynamics | Abbreviation |
| Esophagus | 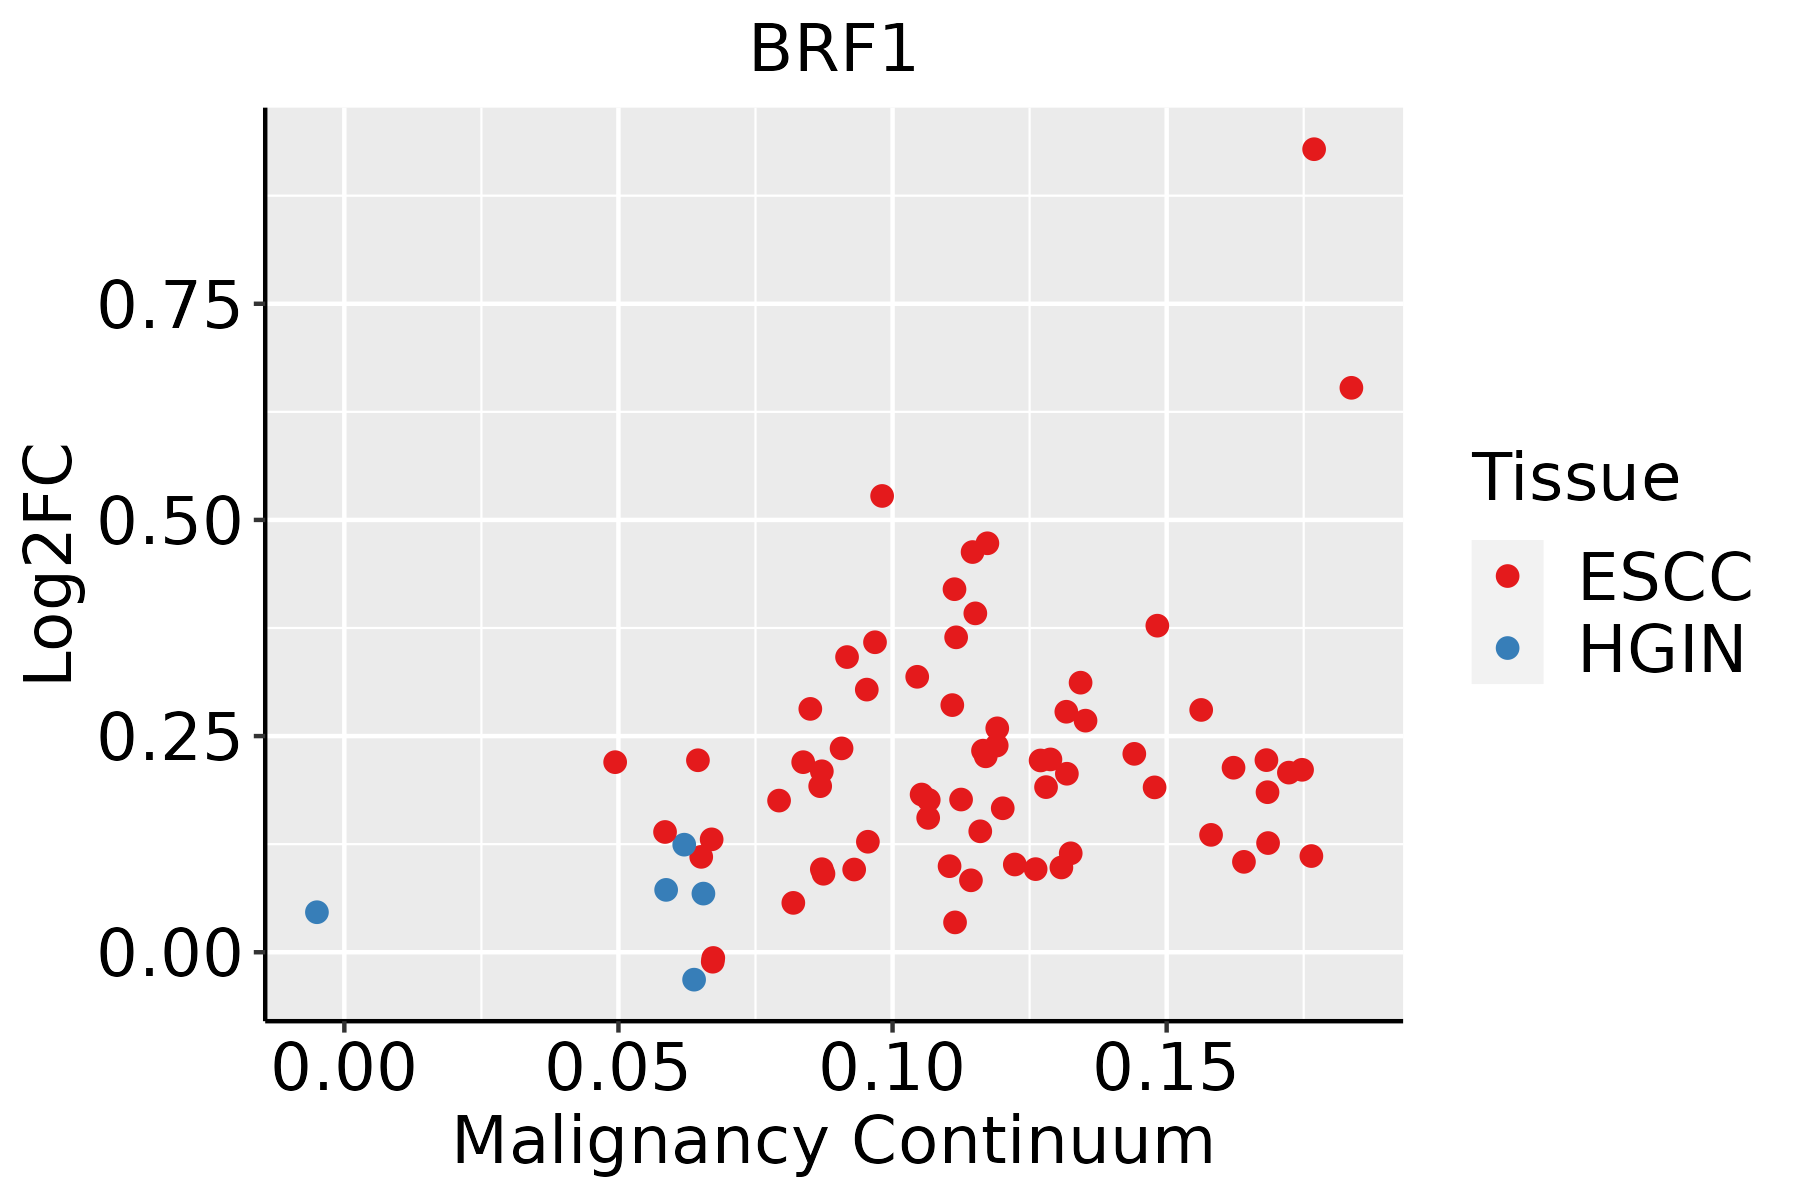 | ESCC: Esophageal squamous cell carcinoma |
| HGIN: High-grade intraepithelial neoplasias | ||
| LGIN: Low-grade intraepithelial neoplasias |
| ∗log2FC in expression of this searched gene in stem-like cells from each diseased tissue sample relative to stem-like cells in normal samples in each tissue plotted against the malignancy continuum. Samples are colored based on if they are from different disease stage. |
Top |
Malignant transformation related pathway analysis |
| Find out the enriched GO biological processes and KEGG pathways involved in transition from healthy to precancer to cancer |
| Tissue | Disease Stage | Enriched GO biological Processes |
| Colorectum | AD |  |
| Colorectum | SER |  |
| Colorectum | MSS |  |
| Colorectum | MSI-H |  |
| Colorectum | FAP |  |
| ∗Top 15 enriched GO BP terms are showed in the bar plot of each disease state in each tissue. Each row represents a significant GO biological process which is colored according to the -log10(p.adjust). |
| Page: 1 2 3 4 5 6 7 8 9 |
| GO ID | Tissue | Disease Stage | Description | Gene Ratio | Bg Ratio | pvalue | p.adjust | Count |
| GO:00063833 | Esophagus | ESCC | transcription by RNA polymerase III | 41/8552 | 46/18723 | 7.69e-10 | 1.90e-08 | 41 |
| GO:00987812 | Esophagus | ESCC | ncRNA transcription | 45/8552 | 56/18723 | 1.05e-07 | 1.72e-06 | 45 |
| GO:000635211 | Esophagus | ESCC | DNA-templated transcription, initiation | 86/8552 | 130/18723 | 1.88e-06 | 2.19e-05 | 86 |
| GO:00708973 | Esophagus | ESCC | transcription preinitiation complex assembly | 30/8552 | 36/18723 | 3.60e-06 | 3.95e-05 | 30 |
| GO:00093032 | Esophagus | ESCC | rRNA transcription | 28/8552 | 34/18723 | 1.21e-05 | 1.12e-04 | 28 |
| GO:0006359 | Esophagus | ESCC | regulation of transcription by RNA polymerase III | 19/8552 | 22/18723 | 9.52e-05 | 6.78e-04 | 19 |
| GO:0045945 | Esophagus | ESCC | positive regulation of transcription by RNA polymerase III | 10/8552 | 11/18723 | 2.54e-03 | 1.08e-02 | 10 |
| Page: 1 |
| Pathway ID | Tissue | Disease Stage | Description | Gene Ratio | Bg Ratio | pvalue | p.adjust | qvalue | Count |
| Page: 1 |
Top |
Cell-cell communication analysis |
| Identification of potential cell-cell interactions between two cell types and their ligand-receptor pairs for different disease states |
| Ligand | Receptor | LRpair | Pathway | Tissue | Disease Stage |
| Page: 1 |
Top |
Single-cell gene regulatory network inference analysis |
| Find out the significant the regulons (TFs) and the target genes of each regulon across cell types for different disease states |
| TF | Cell Type | Tissue | Disease Stage | Target Gene | RSS | Regulon Activity |
| BRF1 | NK | Endometrium | ADJ | CPT1A,FAM222A,EIF4ENIF1, etc. | 3.77e-01 |  |
| BRF1 | MAST | Pancreas | PanIN | PDP2,C11orf71,B3GNT7, etc. | 1.82e-01 |  |
| BRF1 | CD8TEREX | Pancreas | PDAC | PDP2,C11orf71,B3GNT7, etc. | 9.33e-03 |  |
| BRF1 | GDT | Pancreas | PDAC | PDP2,C11orf71,B3GNT7, etc. | 9.99e-02 | |
| BRF1 | NUER | Prostate | BPH | MMP2,APOD,KCTD6, etc. | 1.89e-03 |  |
| BRF1 | CD4TN | Thyroid | goiters | AP005482.1,TAF1A,AL135999.1, etc. | 8.30e-02 |  |
| BRF1 | PLA | Thyroid | PTC | AP005482.1,TAF1A,AL135999.1, etc. | 1.40e-01 |  |
| BRF1 | BMEM | Thyroid | PTC | AP005482.1,TAF1A,AL135999.1, etc. | 5.35e-01 | |
| ∗The dot plots of a searched regulon are shown for all cell subpopulations in each disease state of each tissue based on the regulon specific score inferred using pySCENIC and by calculating the average expression. |
| Page: 1 |
Top |
Somatic mutation of malignant transformation related genes |
| Annotation of somatic variants for genes involved in malignant transformation |
| Hugo Symbol | Variant Class | Variant Classification | dbSNP RS | HGVSc | HGVSp | HGVSp Short | SWISSPROT | BIOTYPE | SIFT | PolyPhen | Tumor Sample Barcode | Tissue | Histology | Sex | Age | Stage | Therapy Types | Drugs | Outcome |
| BRF1 | SNV | Missense_Mutation | novel | c.894N>C | p.Gln298His | p.Q298H | Q92994 | protein_coding | tolerated(0.07) | possibly_damaging(0.862) | TCGA-A2-A0YK-01 | Breast | breast invasive carcinoma | Female | <65 | I/II | Chemotherapy | cytoxan | SD |
| BRF1 | SNV | Missense_Mutation | rs758735678 | c.695N>T | p.Ala232Val | p.A232V | Q92994 | protein_coding | deleterious(0) | probably_damaging(1) | TCGA-AN-A0FJ-01 | Breast | breast invasive carcinoma | Female | <65 | III/IV | Unknown | Unknown | SD |
| BRF1 | SNV | Missense_Mutation | c.1667G>A | p.Arg556Lys | p.R556K | Q92994 | protein_coding | tolerated(0.6) | benign(0.001) | TCGA-AR-A1AR-01 | Breast | breast invasive carcinoma | Female | <65 | III/IV | Unspecific | Docetaxel | PD | |
| BRF1 | SNV | Missense_Mutation | rs777141032 | c.566G>A | p.Arg189His | p.R189H | Q92994 | protein_coding | deleterious(0) | probably_damaging(0.999) | TCGA-D8-A1J8-01 | Breast | breast invasive carcinoma | Female | >=65 | I/II | Hormone Therapy | nolvadex | SD |
| BRF1 | SNV | Missense_Mutation | rs754797281 | c.425N>T | p.Thr142Met | p.T142M | Q92994 | protein_coding | deleterious(0.04) | possibly_damaging(0.782) | TCGA-D8-A1XQ-01 | Breast | breast invasive carcinoma | Female | >=65 | I/II | Unknown | Unknown | SD |
| BRF1 | SNV | Missense_Mutation | novel | c.1682C>T | p.Pro561Leu | p.P561L | Q92994 | protein_coding | tolerated(0.08) | benign(0.001) | TCGA-E9-A1NF-01 | Breast | breast invasive carcinoma | Female | <65 | I/II | Chemotherapy | doxorubicin | PD |
| BRF1 | insertion | Frame_Shift_Ins | novel | c.807_808insCTTCA | p.Thr270LeufsTer8 | p.T270Lfs*8 | Q92994 | protein_coding | TCGA-A8-A07L-01 | Breast | breast invasive carcinoma | Female | <65 | III/IV | Chemotherapy | CR | |||
| BRF1 | deletion | Frame_Shift_Del | c.1025delN | p.Gly342AlafsTer36 | p.G342Afs*36 | Q92994 | protein_coding | TCGA-D8-A27V-01 | Breast | breast invasive carcinoma | Female | <65 | I/II | Hormone Therapy | tamoxiphen | SD | |||
| BRF1 | deletion | Frame_Shift_Del | novel | c.1876delN | p.Ala626ArgfsTer36 | p.A626Rfs*36 | Q92994 | protein_coding | TCGA-EW-A2FV-01 | Breast | breast invasive carcinoma | Female | <65 | III/IV | Chemotherapy | docetaxel | SD | ||
| BRF1 | SNV | Missense_Mutation | novel | c.1682N>T | p.Pro561Leu | p.P561L | Q92994 | protein_coding | tolerated(0.08) | benign(0.001) | TCGA-2W-A8YY-01 | Cervix | cervical & endocervical cancer | Female | <65 | I/II | Chemotherapy | cisplatin | CR |
| Page: 1 2 3 4 5 6 7 8 9 |
Top |
Related drugs of malignant transformation related genes |
| Identification of chemicals and drugs interact with genes involved in malignant transfromation |
| (DGIdb 4.0) |
| Entrez ID | Symbol | Category | Interaction Types | Drug Claim Name | Drug Name | PMIDs |
| Page: 1 |

Copyright 2023-Present -The University of Texas Health Science Center at Houston |