
|
|||||
|
 | |
| |
| |
| |
| |
| |
|
Gene: BRE |
Gene summary for BRE |
| Gene information | Species | Human | Gene symbol | BRE | Gene ID | 9577 |
| Gene name | BRISC and BRCA1 A complex member 2 | |
| Gene Alias | BRCC4 | |
| Cytomap | 2p23.2 | |
| Gene Type | protein-coding | GO ID | GO:0000075 | UniProtAcc | Q9NXR7 |
Top |
Malignant transformation analysis |
| Identification of the aberrant gene expression in precancerous and cancerous lesions by comparing the gene expression of stem-like cells in diseased tissues with normal stem cells |
| Entrez ID | Symbol | Replicates | Species | Organ | Tissue | Adj P-value | Log2FC | Malignancy |
| 9577 | BRE | HTA11_99999970781_79442 | Human | Colorectum | MSS | 1.94e-44 | 7.60e-01 | 0.294 |
| 9577 | BRE | HTA11_99999965062_69753 | Human | Colorectum | MSI-H | 5.11e-13 | 1.29e+00 | 0.3487 |
| 9577 | BRE | HTA11_99999965104_69814 | Human | Colorectum | MSS | 5.00e-45 | 1.20e+00 | 0.281 |
| 9577 | BRE | HTA11_99999971662_82457 | Human | Colorectum | MSS | 2.48e-66 | 1.28e+00 | 0.3859 |
| 9577 | BRE | HTA11_99999973899_84307 | Human | Colorectum | MSS | 3.46e-22 | 6.60e-01 | 0.2585 |
| 9577 | BRE | HTA11_99999974143_84620 | Human | Colorectum | MSS | 9.08e-52 | 9.19e-01 | 0.3005 |
| 9577 | BRE | AEH-subject1 | Human | Endometrium | AEH | 1.89e-07 | -1.95e-01 | -0.3059 |
| 9577 | BRE | AEH-subject2 | Human | Endometrium | AEH | 2.49e-08 | -1.95e-01 | -0.2525 |
| 9577 | BRE | AEH-subject3 | Human | Endometrium | AEH | 4.07e-08 | -1.95e-01 | -0.2576 |
| 9577 | BRE | AEH-subject4 | Human | Endometrium | AEH | 6.90e-06 | -1.95e-01 | -0.2657 |
| 9577 | BRE | AEH-subject5 | Human | Endometrium | AEH | 4.07e-08 | -1.95e-01 | -0.2953 |
| 9577 | BRE | EEC-subject1 | Human | Endometrium | EEC | 1.85e-09 | -1.95e-01 | -0.2682 |
| 9577 | BRE | EEC-subject2 | Human | Endometrium | EEC | 8.77e-08 | -1.95e-01 | -0.2607 |
| 9577 | BRE | EEC-subject3 | Human | Endometrium | EEC | 1.88e-08 | -1.95e-01 | -0.2525 |
| 9577 | BRE | EEC-subject4 | Human | Endometrium | EEC | 4.01e-09 | -1.95e-01 | -0.2571 |
| 9577 | BRE | EEC-subject5 | Human | Endometrium | EEC | 8.71e-07 | -1.95e-01 | -0.249 |
| 9577 | BRE | GSM5276934 | Human | Endometrium | EEC | 3.89e-10 | -1.95e-01 | -0.0913 |
| 9577 | BRE | GSM5276935 | Human | Endometrium | EEC | 8.49e-10 | -1.95e-01 | -0.123 |
| 9577 | BRE | GSM5276937 | Human | Endometrium | EEC | 1.10e-07 | -1.95e-01 | -0.0897 |
| 9577 | BRE | GSM6177620_NYU_UCEC1_lib1_lib1 | Human | Endometrium | EEC | 2.30e-06 | -1.95e-01 | -0.1869 |
| Page: 1 2 3 4 5 6 |
| Tissue | Expression Dynamics | Abbreviation |
| Colorectum (GSE201348) |  | FAP: Familial adenomatous polyposis |
| CRC: Colorectal cancer | ||
| Colorectum (HTA11) |  | AD: Adenomas |
| SER: Sessile serrated lesions | ||
| MSI-H: Microsatellite-high colorectal cancer | ||
| MSS: Microsatellite stable colorectal cancer | ||
| Endometrium | 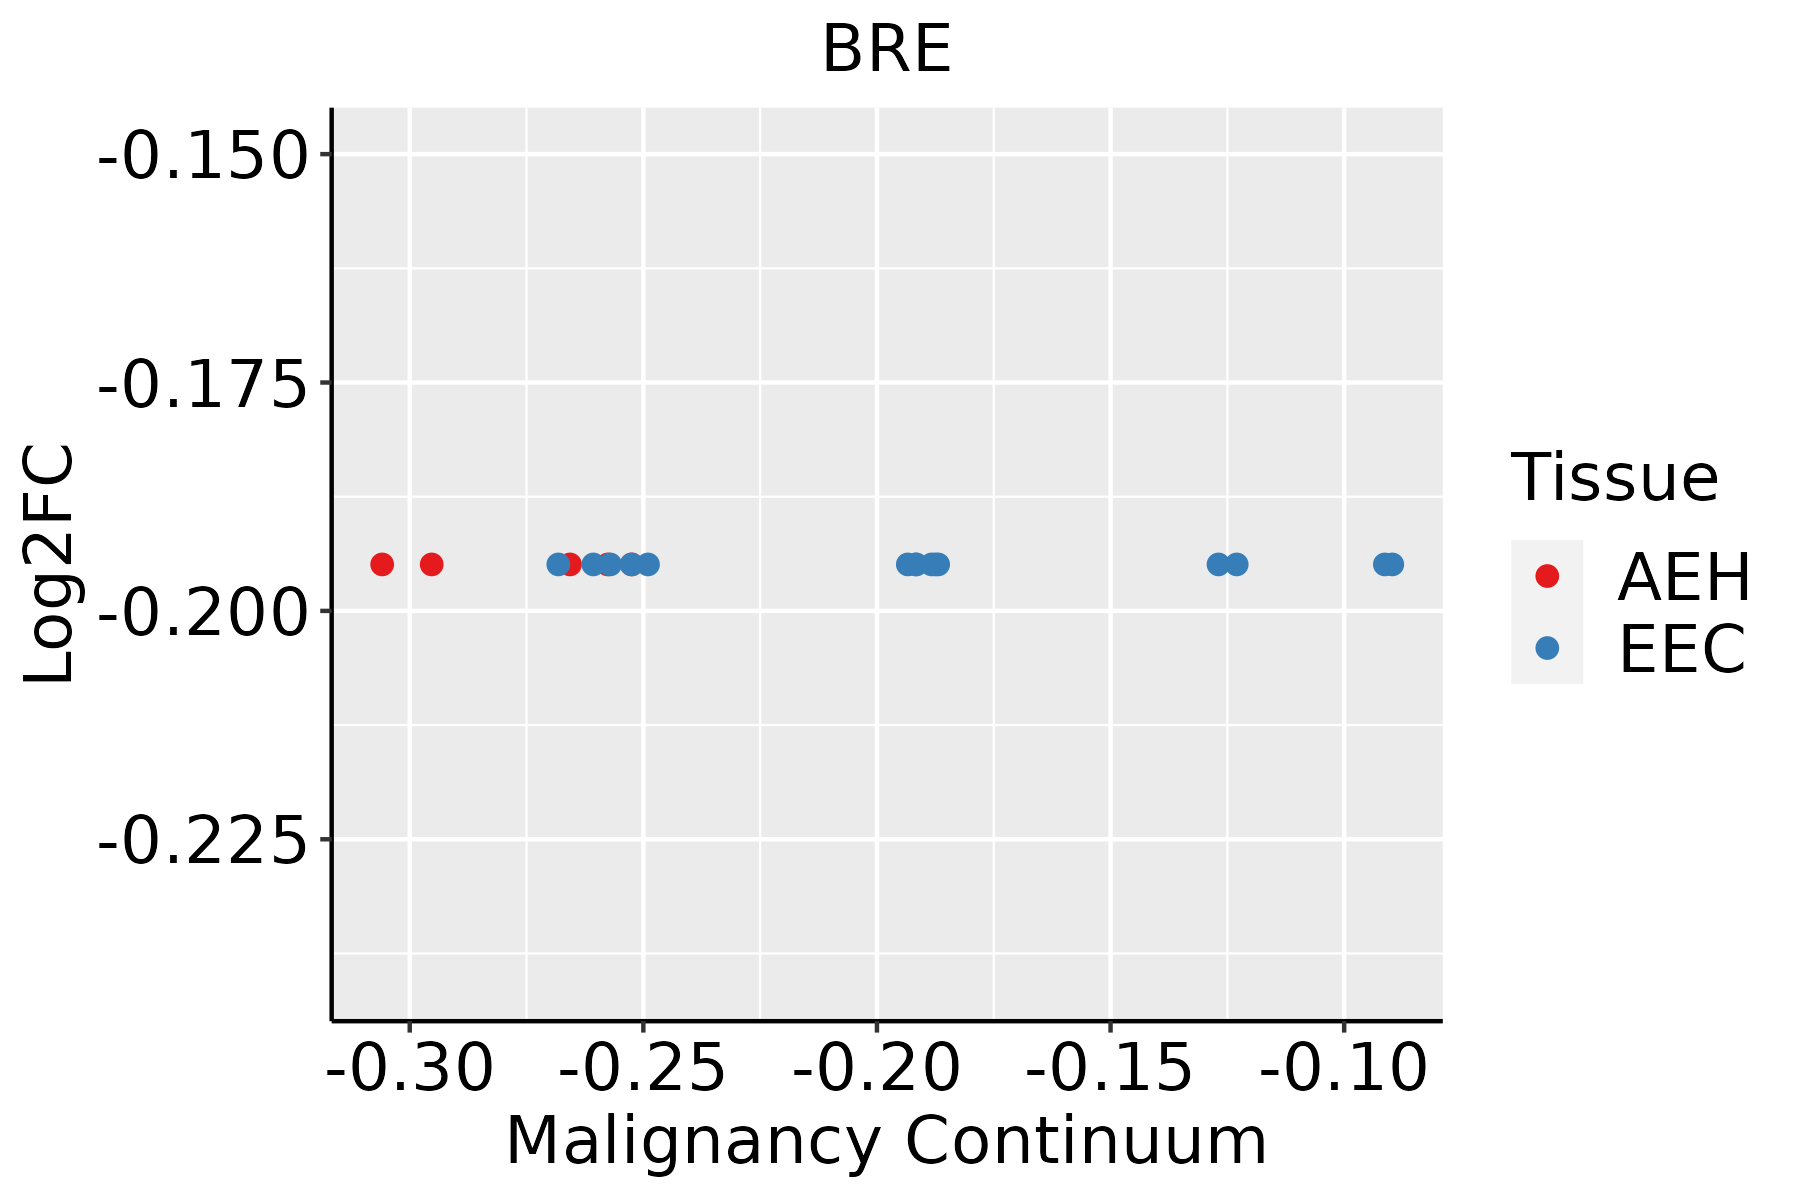 | AEH: Atypical endometrial hyperplasia |
| EEC: Endometrioid Cancer | ||
| Esophagus |  | ESCC: Esophageal squamous cell carcinoma |
| HGIN: High-grade intraepithelial neoplasias | ||
| LGIN: Low-grade intraepithelial neoplasias | ||
| Liver | 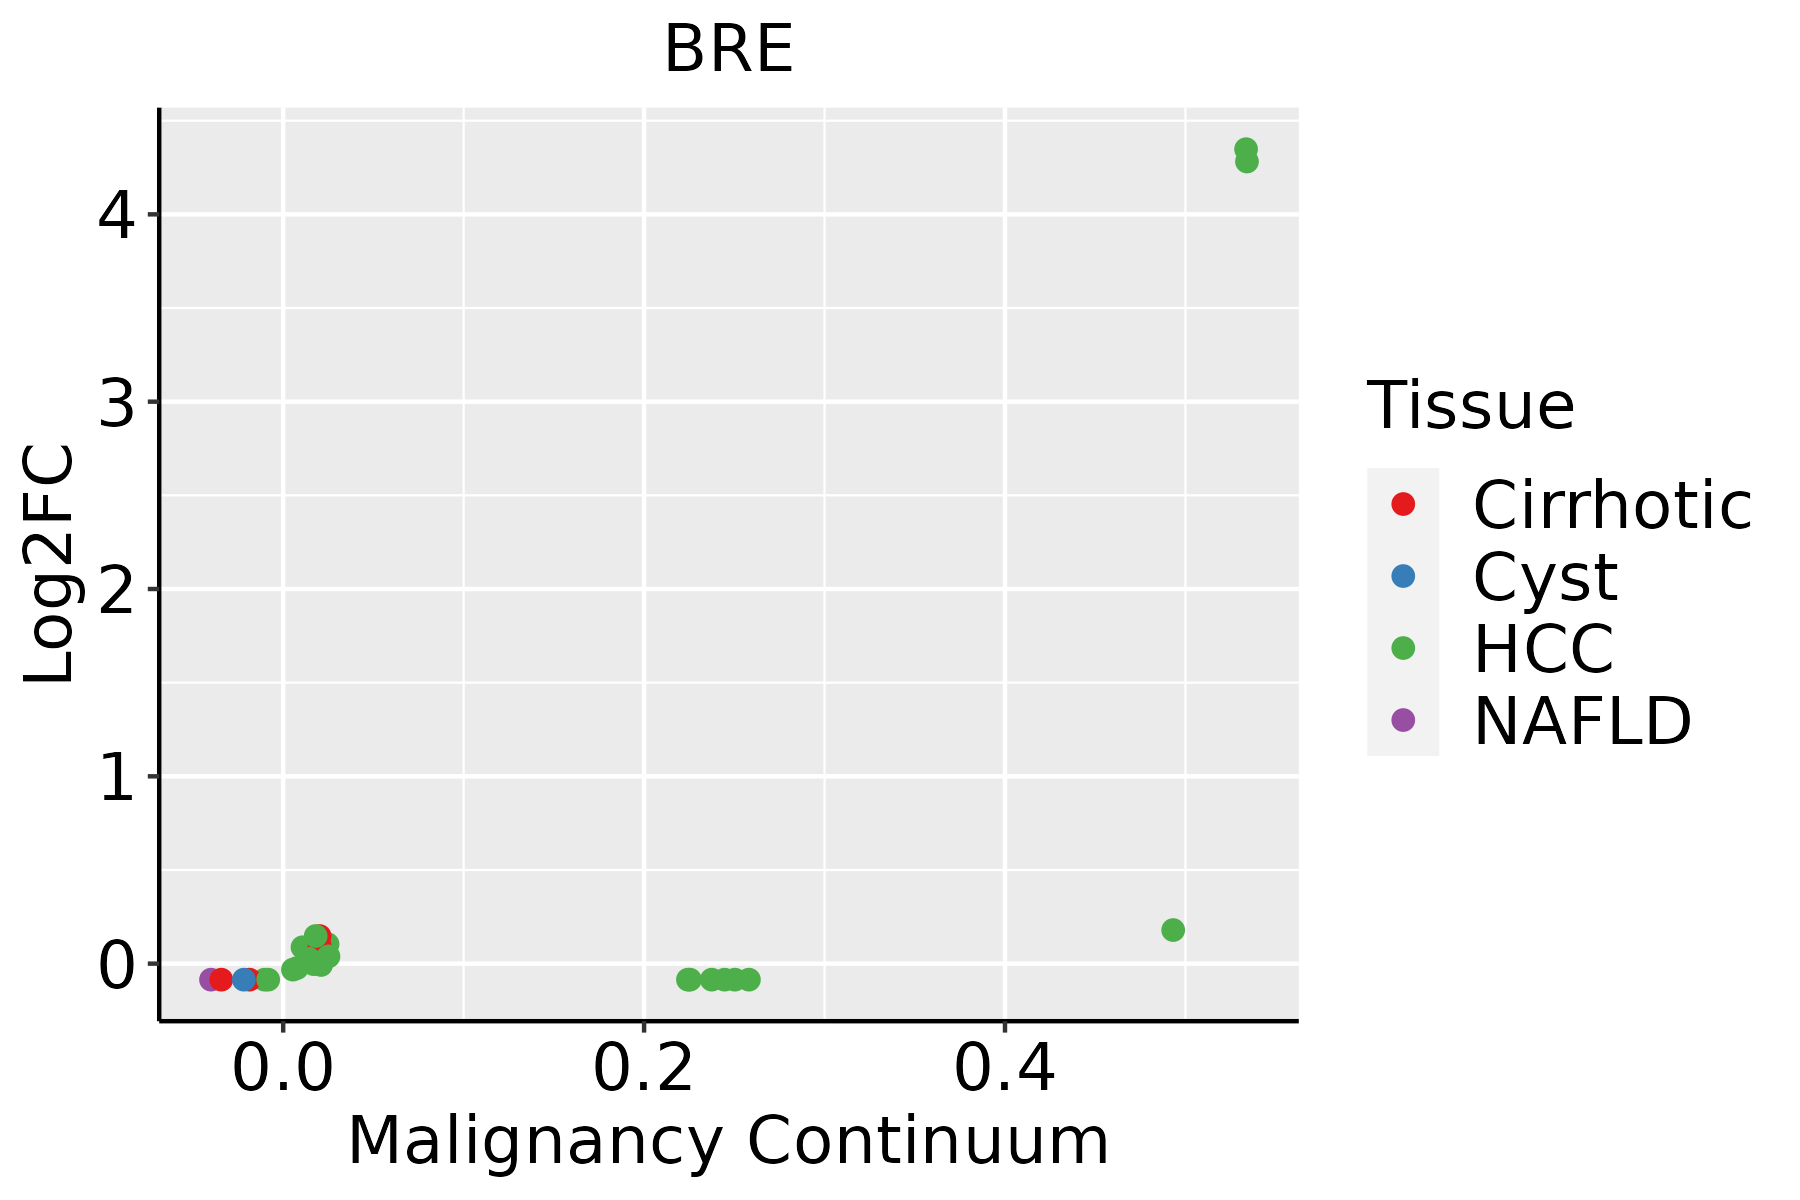 | HCC: Hepatocellular carcinoma |
| NAFLD: Non-alcoholic fatty liver disease | ||
| Oral Cavity | 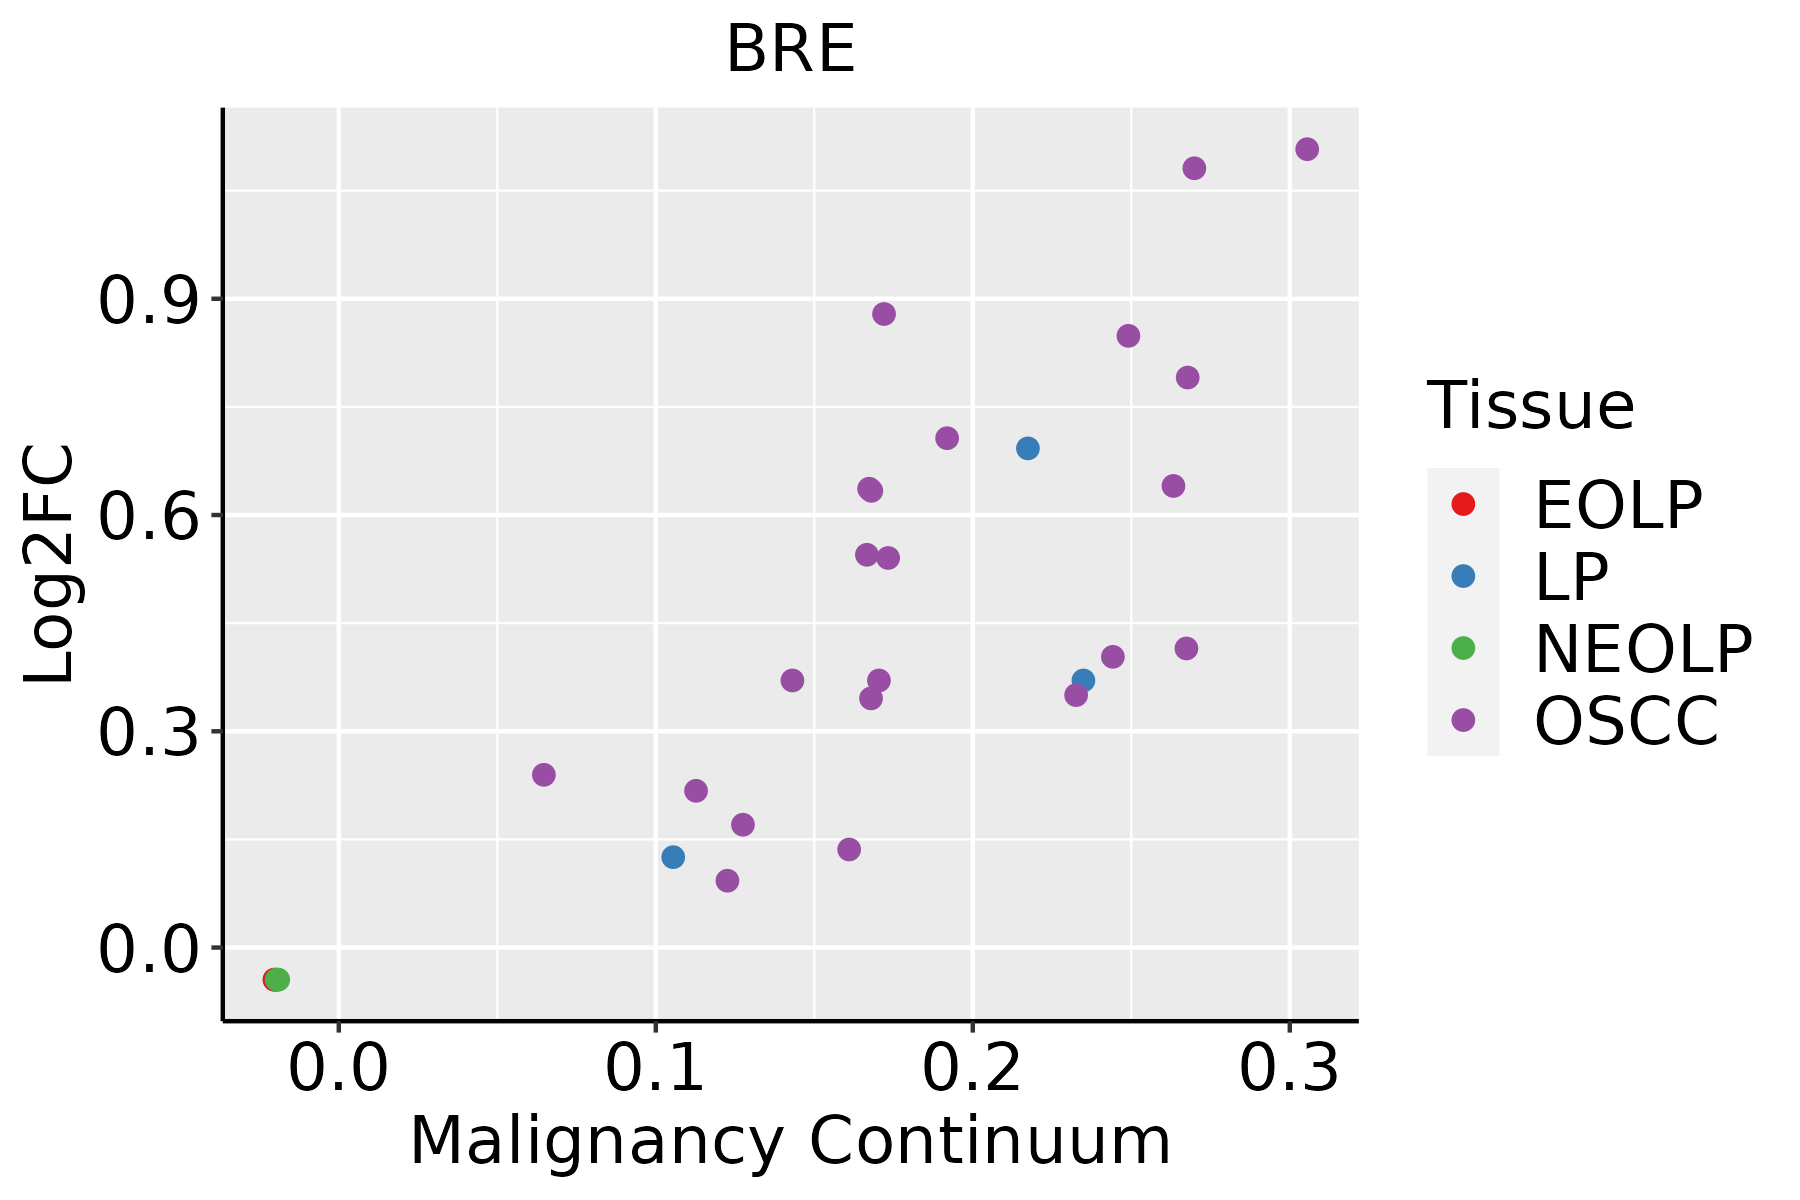 | EOLP: Erosive Oral lichen planus |
| LP: leukoplakia | ||
| NEOLP: Non-erosive oral lichen planus | ||
| OSCC: Oral squamous cell carcinoma | ||
| Skin | 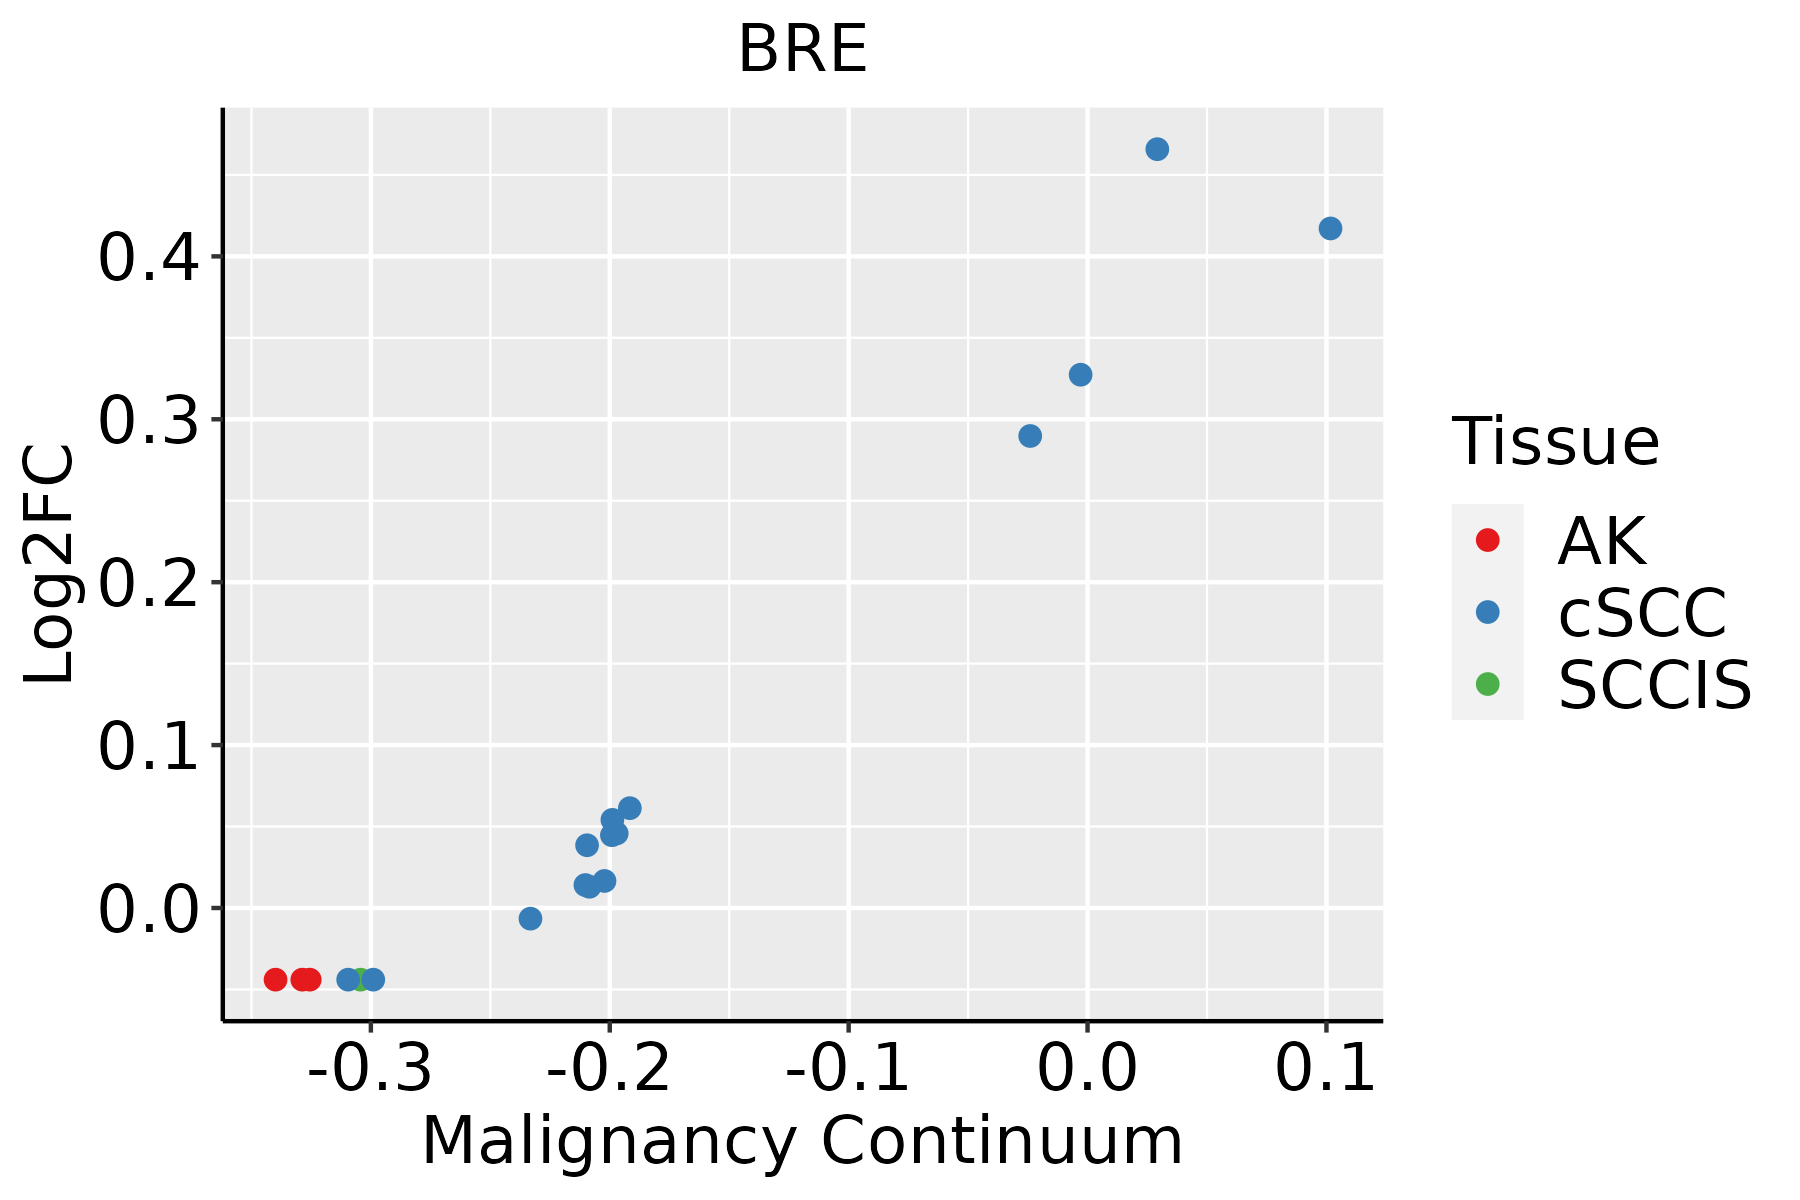 | AK: Actinic keratosis |
| cSCC: Cutaneous squamous cell carcinoma | ||
| SCCIS:squamous cell carcinoma in situ |
| ∗log2FC in expression of this searched gene in stem-like cells from each diseased tissue sample relative to stem-like cells in normal samples in each tissue plotted against the malignancy continuum. Samples are colored based on if they are from different disease stage. |
Top |
Malignant transformation related pathway analysis |
| Find out the enriched GO biological processes and KEGG pathways involved in transition from healthy to precancer to cancer |
| Tissue | Disease Stage | Enriched GO biological Processes |
| Colorectum | AD |  |
| Colorectum | SER |  |
| Colorectum | MSS |  |
| Colorectum | MSI-H |  |
| Colorectum | FAP |  |
| ∗Top 15 enriched GO BP terms are showed in the bar plot of each disease state in each tissue. Each row represents a significant GO biological process which is colored according to the -log10(p.adjust). |
| Page: 1 2 3 4 5 6 7 8 9 |
| GO ID | Tissue | Disease Stage | Description | Gene Ratio | Bg Ratio | pvalue | p.adjust | Count |
| Page: 1 |
| Pathway ID | Tissue | Disease Stage | Description | Gene Ratio | Bg Ratio | pvalue | p.adjust | qvalue | Count |
| Page: 1 |
Top |
Cell-cell communication analysis |
| Identification of potential cell-cell interactions between two cell types and their ligand-receptor pairs for different disease states |
| Ligand | Receptor | LRpair | Pathway | Tissue | Disease Stage |
| Page: 1 |
Top |
Single-cell gene regulatory network inference analysis |
| Find out the significant the regulons (TFs) and the target genes of each regulon across cell types for different disease states |
| TF | Cell Type | Tissue | Disease Stage | Target Gene | RSS | Regulon Activity |
| ∗The dot plots of a searched regulon are shown for all cell subpopulations in each disease state of each tissue based on the regulon specific score inferred using pySCENIC and by calculating the average expression. |
| Page: 1 |
Top |
Somatic mutation of malignant transformation related genes |
| Annotation of somatic variants for genes involved in malignant transformation |
| Hugo Symbol | Variant Class | Variant Classification | dbSNP RS | HGVSc | HGVSp | HGVSp Short | SWISSPROT | BIOTYPE | SIFT | PolyPhen | Tumor Sample Barcode | Tissue | Histology | Sex | Age | Stage | Therapy Types | Drugs | Outcome |
| BRE | SNV | Missense_Mutation | c.61N>A | p.Val21Met | p.V21M | Q9NXR7 | protein_coding | deleterious(0.04) | benign(0.033) | TCGA-AC-A8OQ-01 | Breast | breast invasive carcinoma | Female | >=65 | I/II | Unknown | Unknown | SD | |
| BRE | SNV | Missense_Mutation | c.481N>G | p.Lys161Glu | p.K161E | Q9NXR7 | protein_coding | tolerated(0.48) | benign(0.415) | TCGA-AN-A046-01 | Breast | breast invasive carcinoma | Female | >=65 | I/II | Unknown | Unknown | SD | |
| BRE | SNV | Missense_Mutation | c.514N>G | p.Arg172Gly | p.R172G | Q9NXR7 | protein_coding | deleterious(0.02) | probably_damaging(0.979) | TCGA-BH-A1F8-01 | Breast | breast invasive carcinoma | Female | >=65 | III/IV | Unknown | Unknown | PD | |
| BRE | SNV | Missense_Mutation | c.61G>A | p.Val21Met | p.V21M | Q9NXR7 | protein_coding | deleterious(0.04) | benign(0.033) | TCGA-D8-A1JG-01 | Breast | breast invasive carcinoma | Female | <65 | I/II | Chemotherapy | doxorubicin | SD | |
| BRE | SNV | Missense_Mutation | c.1060G>A | p.Asp354Asn | p.D354N | Q9NXR7 | protein_coding | tolerated(0.14) | probably_damaging(0.991) | TCGA-E9-A22D-01 | Breast | breast invasive carcinoma | Female | <65 | I/II | Chemotherapy | 5-fluorouracil | SD | |
| BRE | insertion | Frame_Shift_Ins | novel | c.1111_1112insAGTTT | p.Ala371GlufsTer79 | p.A371Efs*79 | Q9NXR7 | protein_coding | TCGA-A2-A0CT-01 | Breast | breast invasive carcinoma | Female | >=65 | I/II | Chemotherapy | cytoxan | SD | ||
| BRE | insertion | Frame_Shift_Ins | novel | c.1113_1114insTTTTTCCTTCTATTACAACA | p.Cys372PhefsTer83 | p.C372Ffs*83 | Q9NXR7 | protein_coding | TCGA-A2-A0CT-01 | Breast | breast invasive carcinoma | Female | >=65 | I/II | Chemotherapy | cytoxan | SD | ||
| BRE | insertion | Nonsense_Mutation | novel | c.1152_1153insGTAGATGCGTGCATACATCTGTGATGAACGCC | p.Lys385ValfsTer8 | p.K385Vfs*8 | Q9NXR7 | protein_coding | TCGA-AQ-A04J-01 | Breast | breast invasive carcinoma | Female | <65 | I/II | Chemotherapy | cytoxan | SD | ||
| BRE | insertion | Nonsense_Mutation | novel | c.1210_1211insTATGTGTAGATGCGTGCATACATCTGTGATGAACGCCAGAGAAAGAAG | p.Pro404delinsLeuCysValAspAlaCysIleHisLeuTerTerThrProGluLysGluAla | p.P404delinsLCVDACIHL**TPEKEA | Q9NXR7 | protein_coding | TCGA-AR-A0TY-01 | Breast | breast invasive carcinoma | Female | <65 | I/II | Unspecific | Paclitaxel | PD | ||
| BRE | SNV | Missense_Mutation | novel | c.1046A>G | p.Tyr349Cys | p.Y349C | Q9NXR7 | protein_coding | deleterious(0) | probably_damaging(0.997) | TCGA-2W-A8YY-01 | Cervix | cervical & endocervical cancer | Female | <65 | I/II | Chemotherapy | cisplatin | CR |
| Page: 1 2 3 4 5 6 |
Top |
Related drugs of malignant transformation related genes |
| Identification of chemicals and drugs interact with genes involved in malignant transfromation |
| (DGIdb 4.0) |
| Entrez ID | Symbol | Category | Interaction Types | Drug Claim Name | Drug Name | PMIDs |
| Page: 1 |

Copyright 2023-Present -The University of Texas Health Science Center at Houston |