
|
|||||
|
 | |
| |
| |
| |
| |
| |
|
Gene: BRD9 |
Gene summary for BRD9 |
| Gene information | Species | Human | Gene symbol | BRD9 | Gene ID | 65980 |
| Gene name | bromodomain containing 9 | |
| Gene Alias | LAVS3040 | |
| Cytomap | 5p15.33 | |
| Gene Type | protein-coding | GO ID | GO:0006139 | UniProtAcc | B4DXI2 |
Top |
Malignant transformation analysis |
| Identification of the aberrant gene expression in precancerous and cancerous lesions by comparing the gene expression of stem-like cells in diseased tissues with normal stem cells |
| Entrez ID | Symbol | Replicates | Species | Organ | Tissue | Adj P-value | Log2FC | Malignancy |
| 65980 | BRD9 | LZE5T | Human | Esophagus | ESCC | 3.20e-09 | 5.76e-01 | 0.0514 |
| 65980 | BRD9 | LZE7T | Human | Esophagus | ESCC | 2.31e-04 | 1.37e-01 | 0.0667 |
| 65980 | BRD9 | LZE8T | Human | Esophagus | ESCC | 1.47e-03 | 1.02e-01 | 0.067 |
| 65980 | BRD9 | LZE20T | Human | Esophagus | ESCC | 4.15e-11 | 4.32e-01 | 0.0662 |
| 65980 | BRD9 | LZE21D1 | Human | Esophagus | HGIN | 2.30e-08 | 5.76e-01 | 0.0632 |
| 65980 | BRD9 | LZE22D1 | Human | Esophagus | HGIN | 7.91e-07 | 3.17e-01 | 0.0595 |
| 65980 | BRD9 | LZE22T | Human | Esophagus | ESCC | 1.22e-11 | 7.98e-01 | 0.068 |
| 65980 | BRD9 | LZE24T | Human | Esophagus | ESCC | 1.20e-12 | 2.72e-01 | 0.0596 |
| 65980 | BRD9 | LZE22D3 | Human | Esophagus | HGIN | 1.31e-04 | 5.76e-01 | 0.0653 |
| 65980 | BRD9 | LZE21T | Human | Esophagus | ESCC | 1.97e-12 | 4.90e-01 | 0.0655 |
| 65980 | BRD9 | P1T-E | Human | Esophagus | ESCC | 1.94e-26 | 1.06e+00 | 0.0875 |
| 65980 | BRD9 | P2T-E | Human | Esophagus | ESCC | 2.69e-25 | 4.98e-01 | 0.1177 |
| 65980 | BRD9 | P4T-E | Human | Esophagus | ESCC | 1.74e-24 | 5.82e-01 | 0.1323 |
| 65980 | BRD9 | P5T-E | Human | Esophagus | ESCC | 6.75e-29 | 6.13e-01 | 0.1327 |
| 65980 | BRD9 | P8T-E | Human | Esophagus | ESCC | 9.70e-35 | 5.77e-01 | 0.0889 |
| 65980 | BRD9 | P9T-E | Human | Esophagus | ESCC | 1.11e-26 | 5.84e-01 | 0.1131 |
| 65980 | BRD9 | P10T-E | Human | Esophagus | ESCC | 2.12e-60 | 1.04e+00 | 0.116 |
| 65980 | BRD9 | P11T-E | Human | Esophagus | ESCC | 1.03e-12 | 4.26e-01 | 0.1426 |
| 65980 | BRD9 | P12T-E | Human | Esophagus | ESCC | 7.77e-26 | 4.52e-01 | 0.1122 |
| 65980 | BRD9 | P15T-E | Human | Esophagus | ESCC | 3.95e-13 | 3.24e-01 | 0.1149 |
| Page: 1 2 3 4 5 6 7 |
| Tissue | Expression Dynamics | Abbreviation |
| Esophagus | 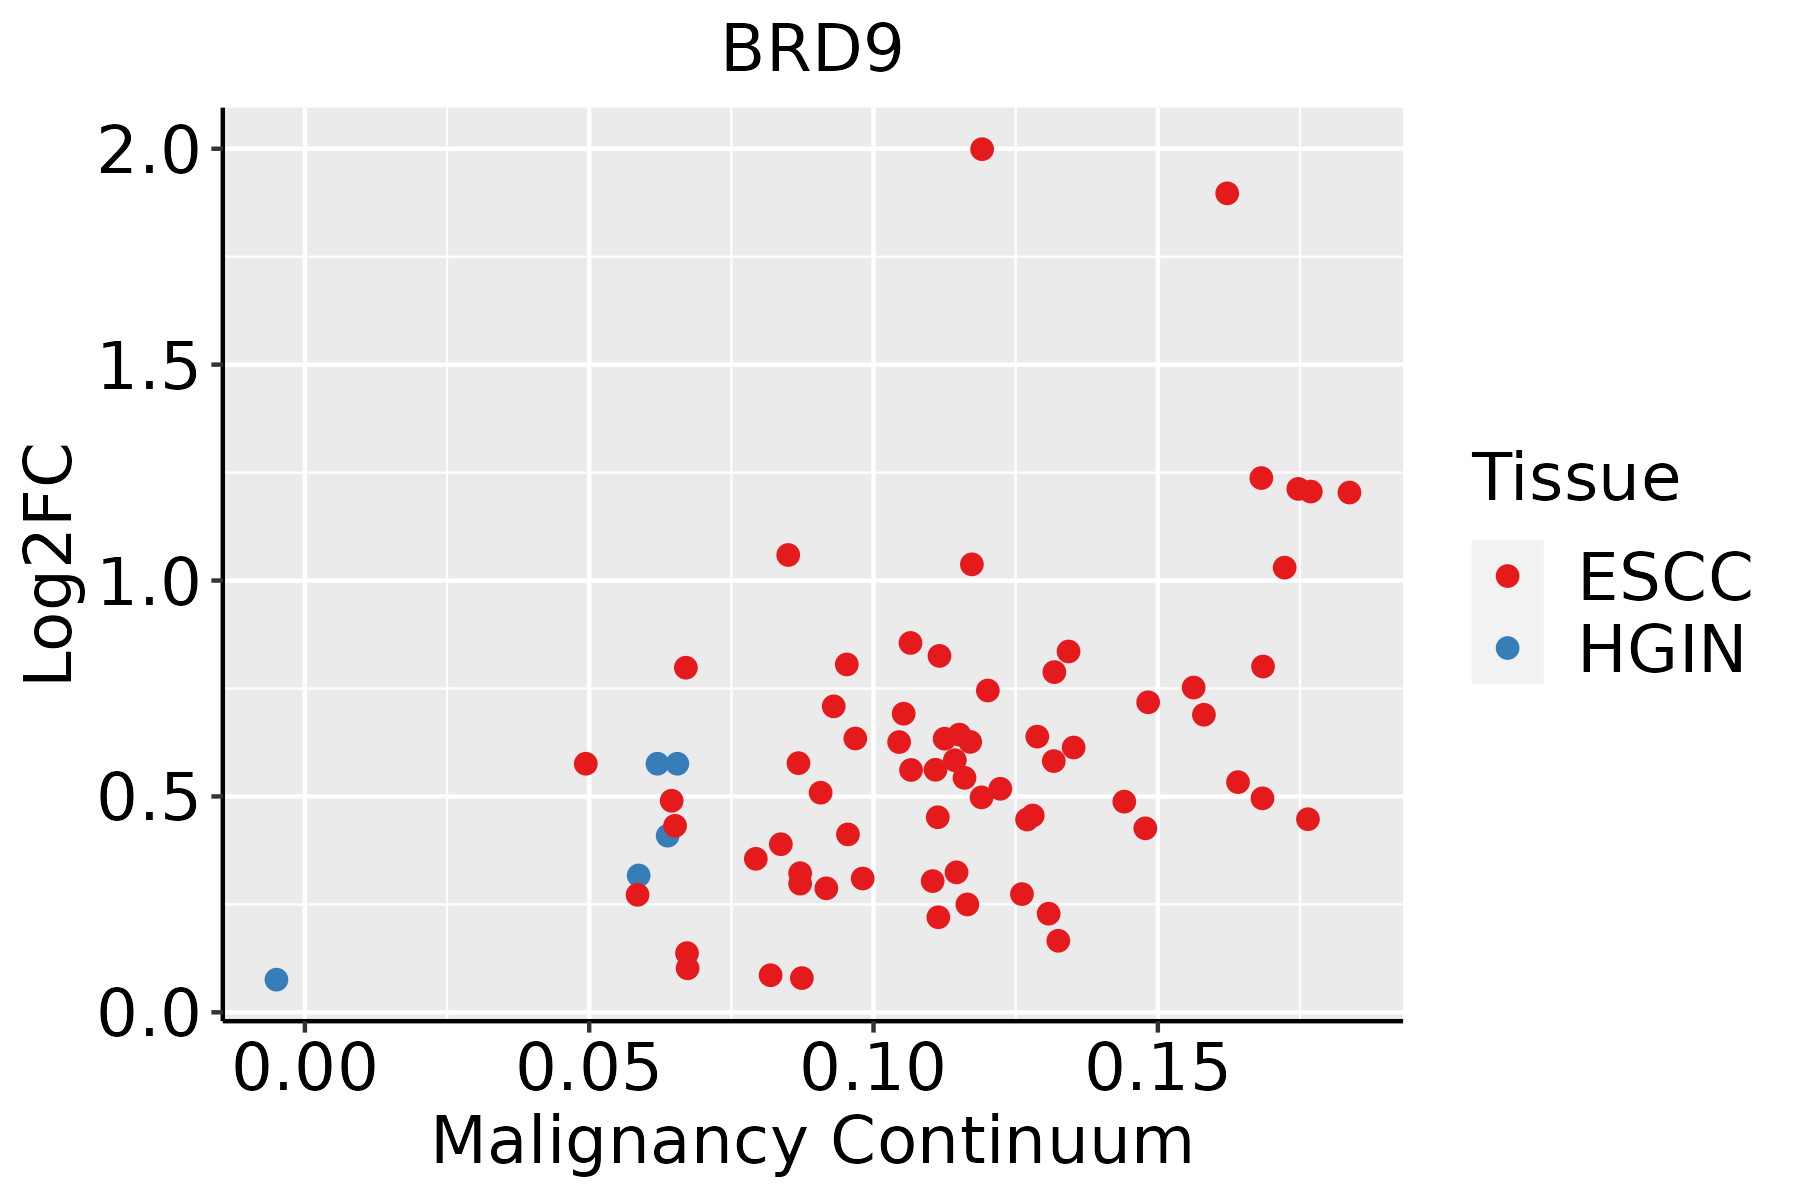 | ESCC: Esophageal squamous cell carcinoma |
| HGIN: High-grade intraepithelial neoplasias | ||
| LGIN: Low-grade intraepithelial neoplasias | ||
| Liver | 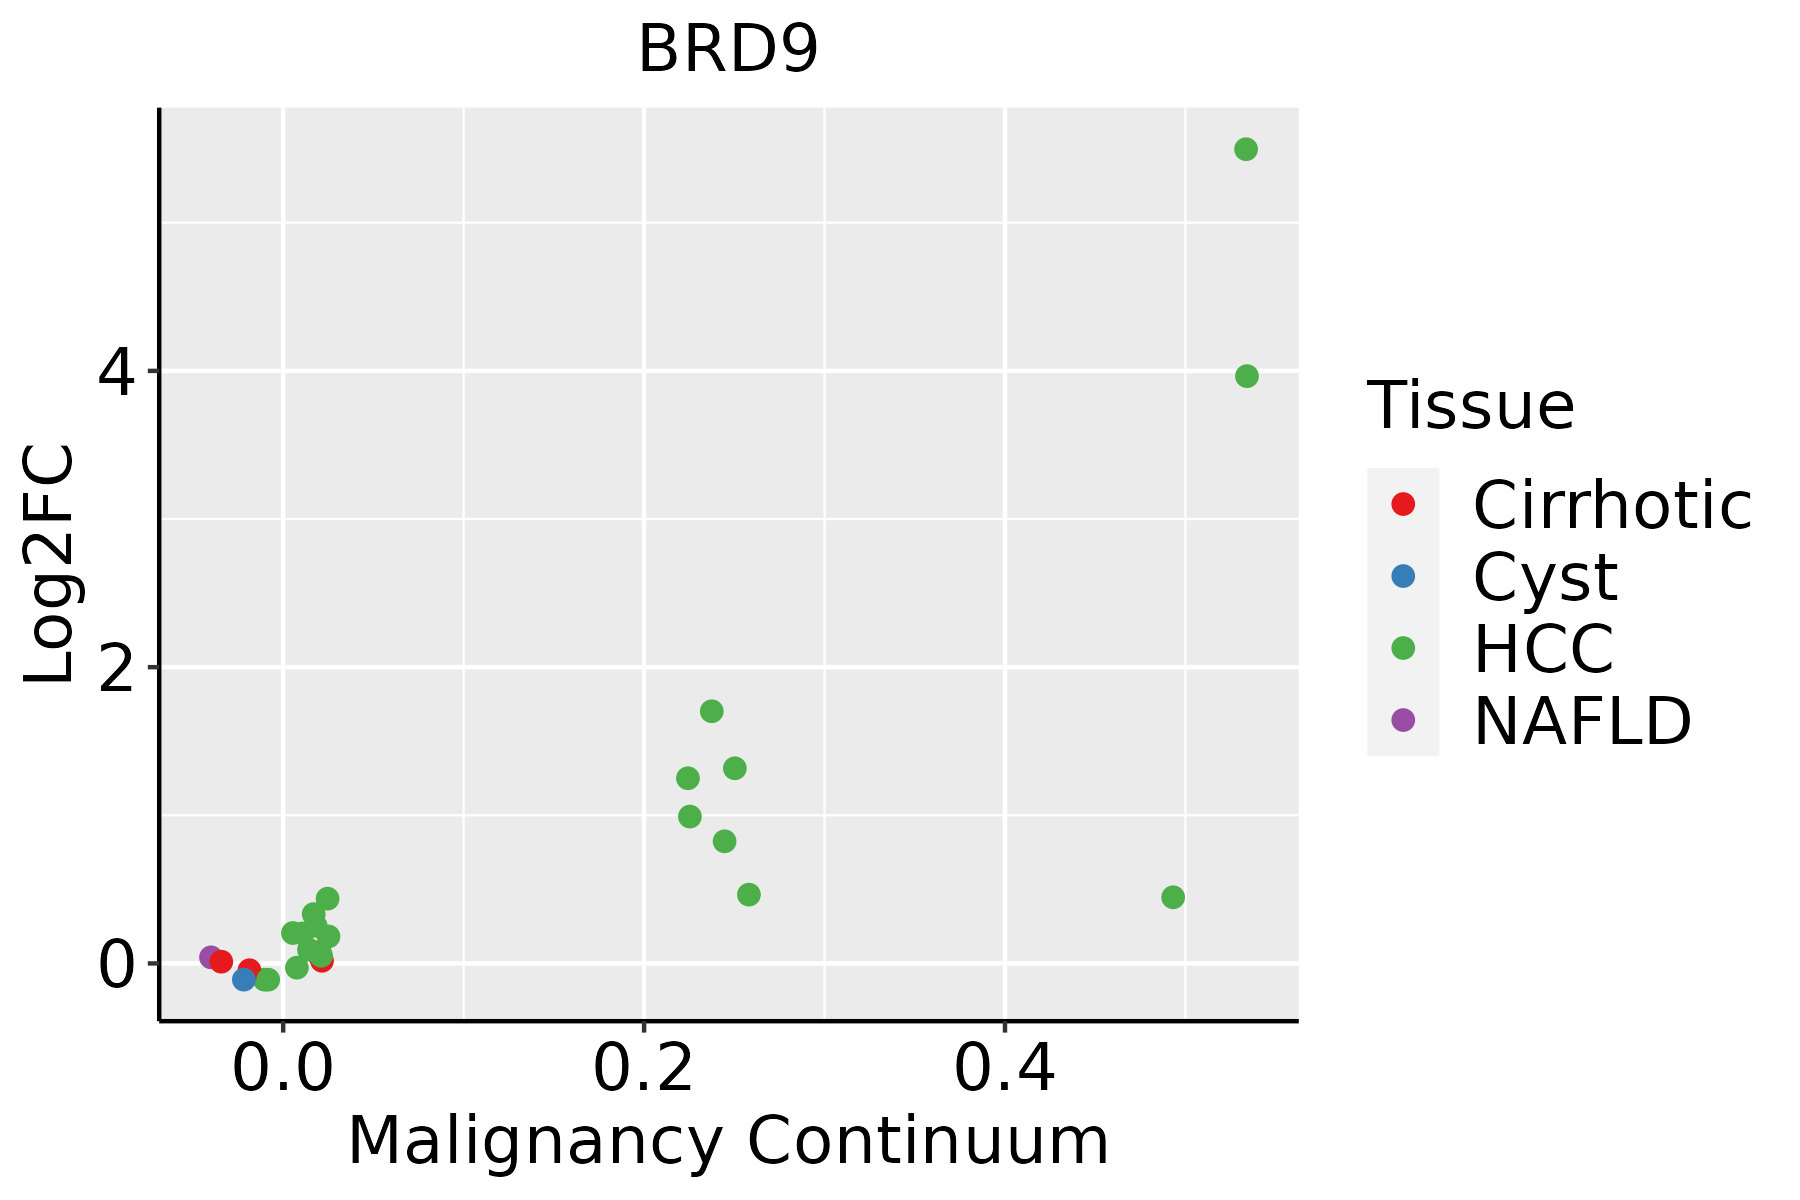 | HCC: Hepatocellular carcinoma |
| NAFLD: Non-alcoholic fatty liver disease | ||
| Oral Cavity | 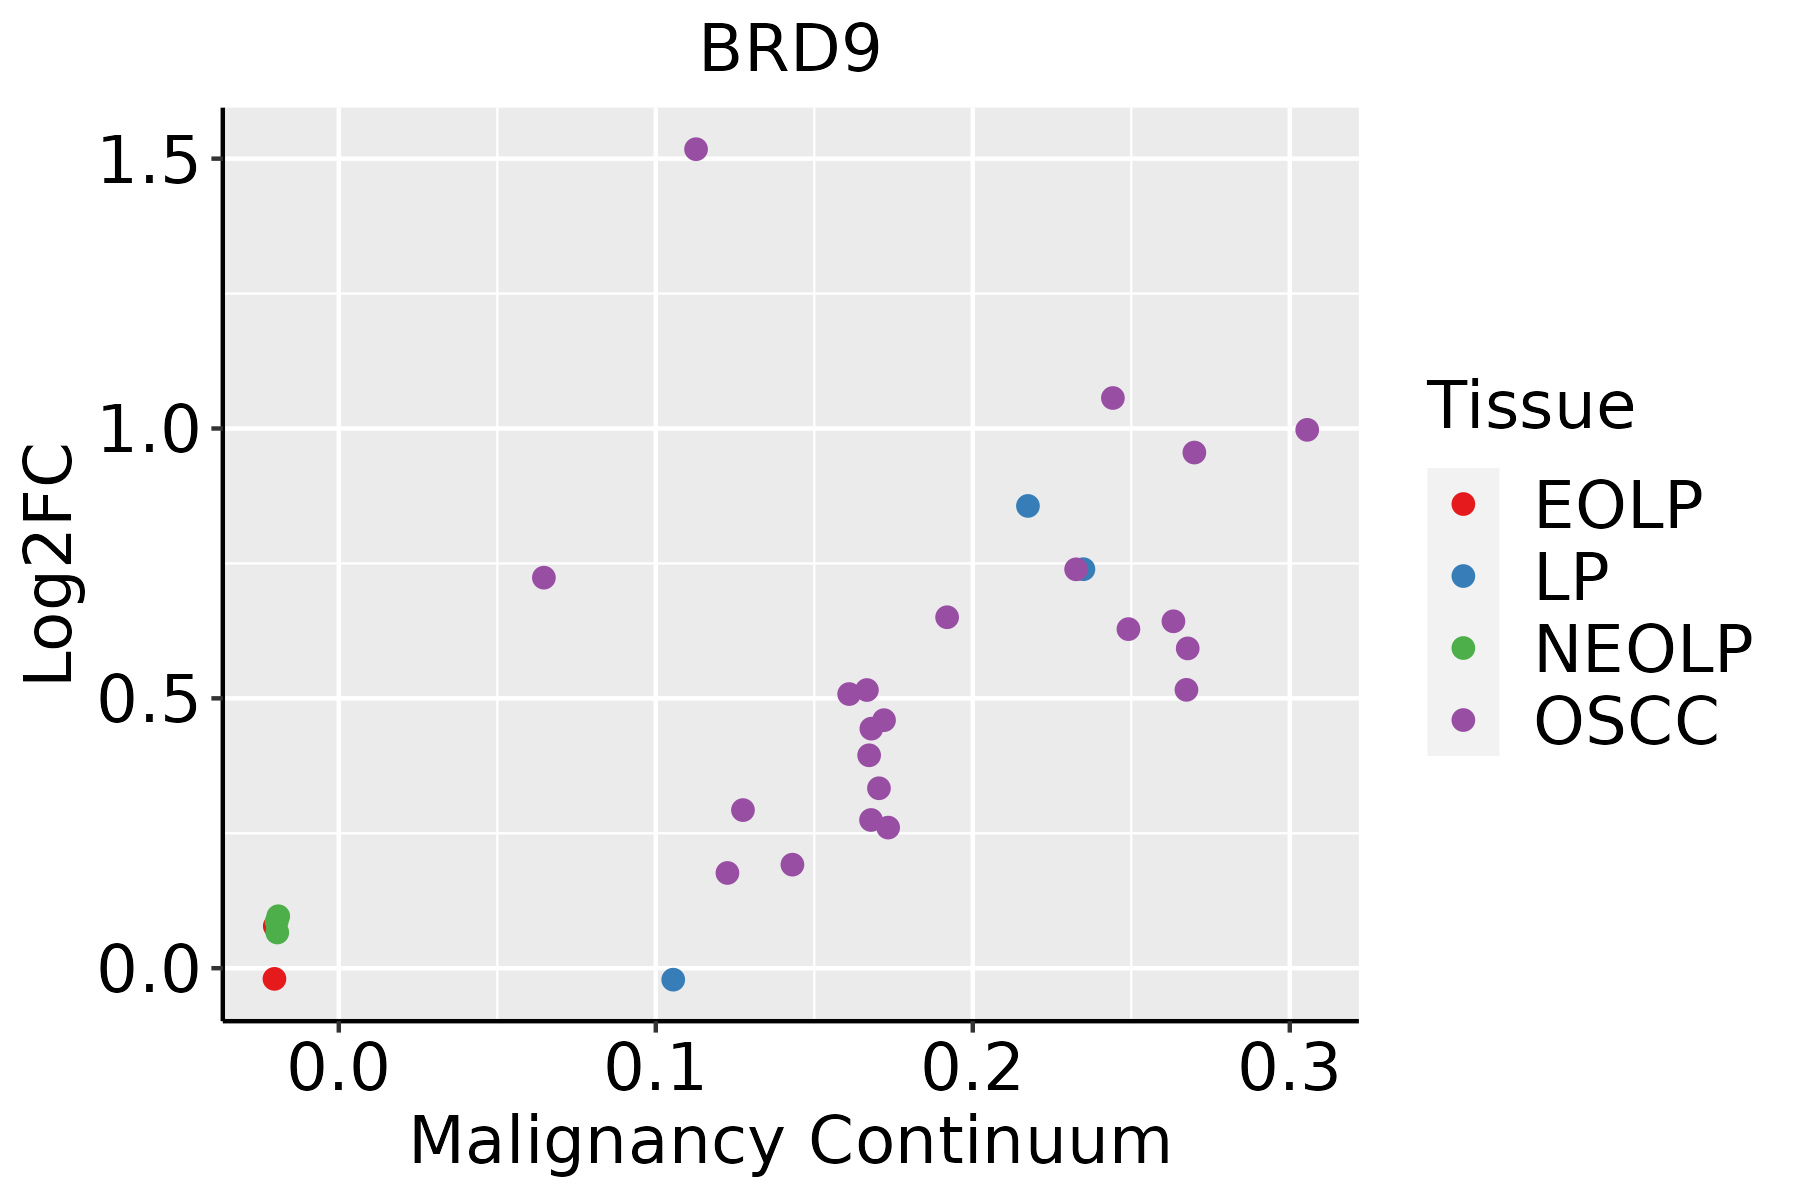 | EOLP: Erosive Oral lichen planus |
| LP: leukoplakia | ||
| NEOLP: Non-erosive oral lichen planus | ||
| OSCC: Oral squamous cell carcinoma | ||
| Prostate | 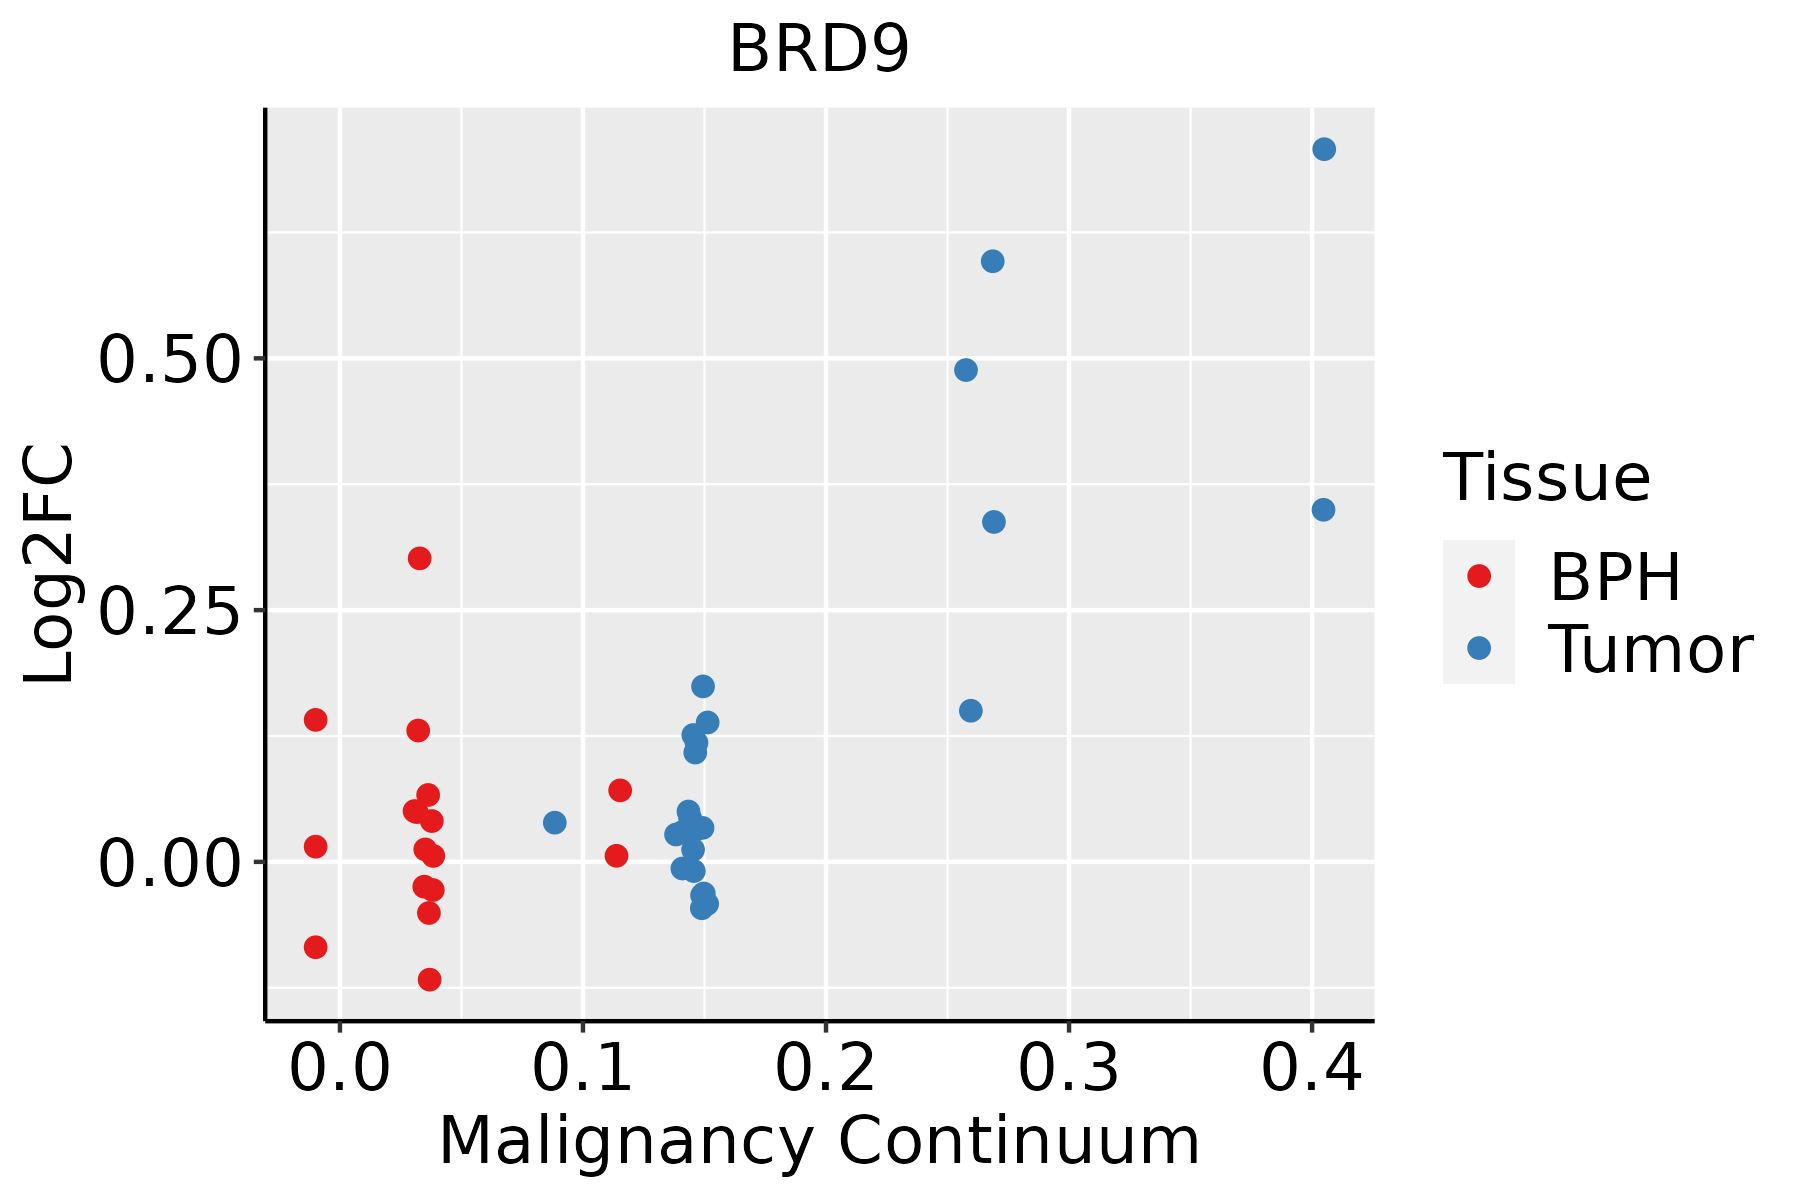 | BPH: Benign Prostatic Hyperplasia |
| Skin | 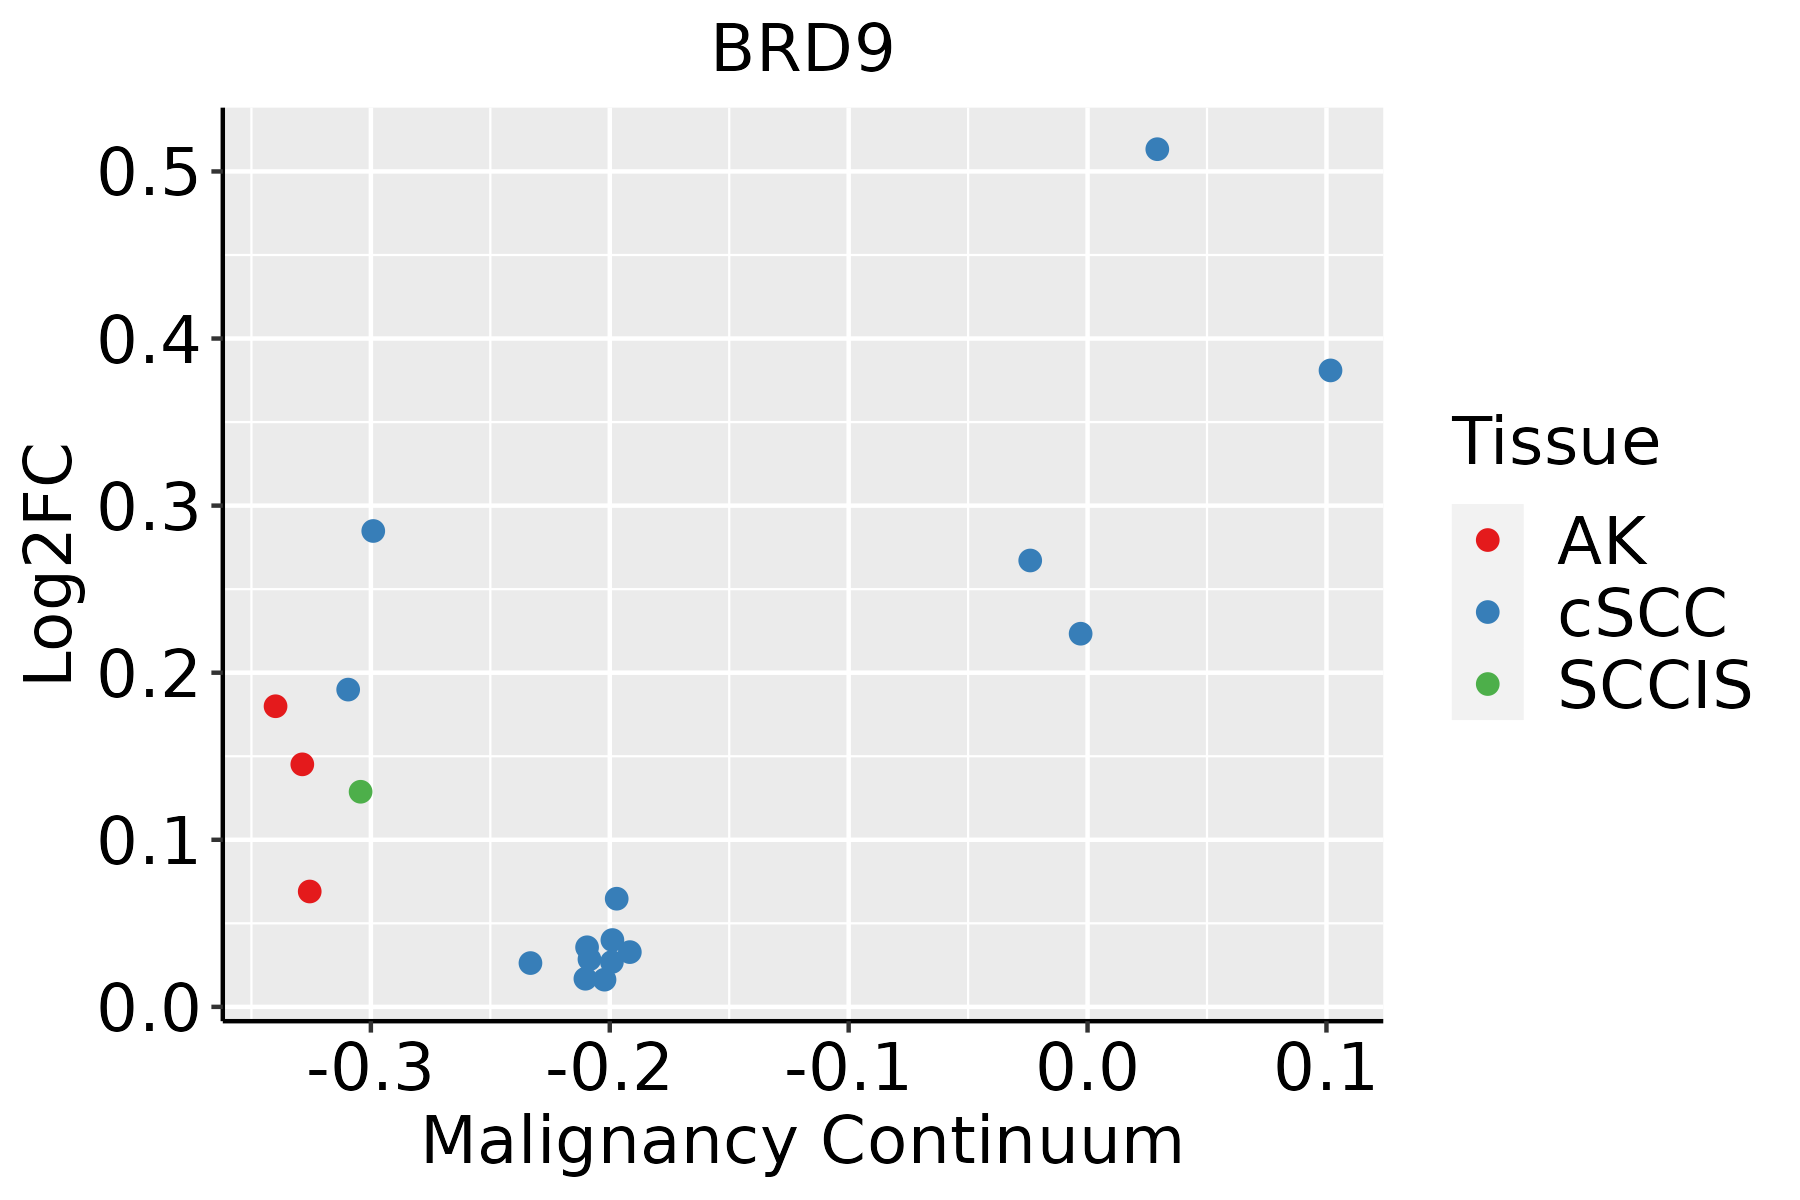 | AK: Actinic keratosis |
| cSCC: Cutaneous squamous cell carcinoma | ||
| SCCIS:squamous cell carcinoma in situ | ||
| Thyroid | 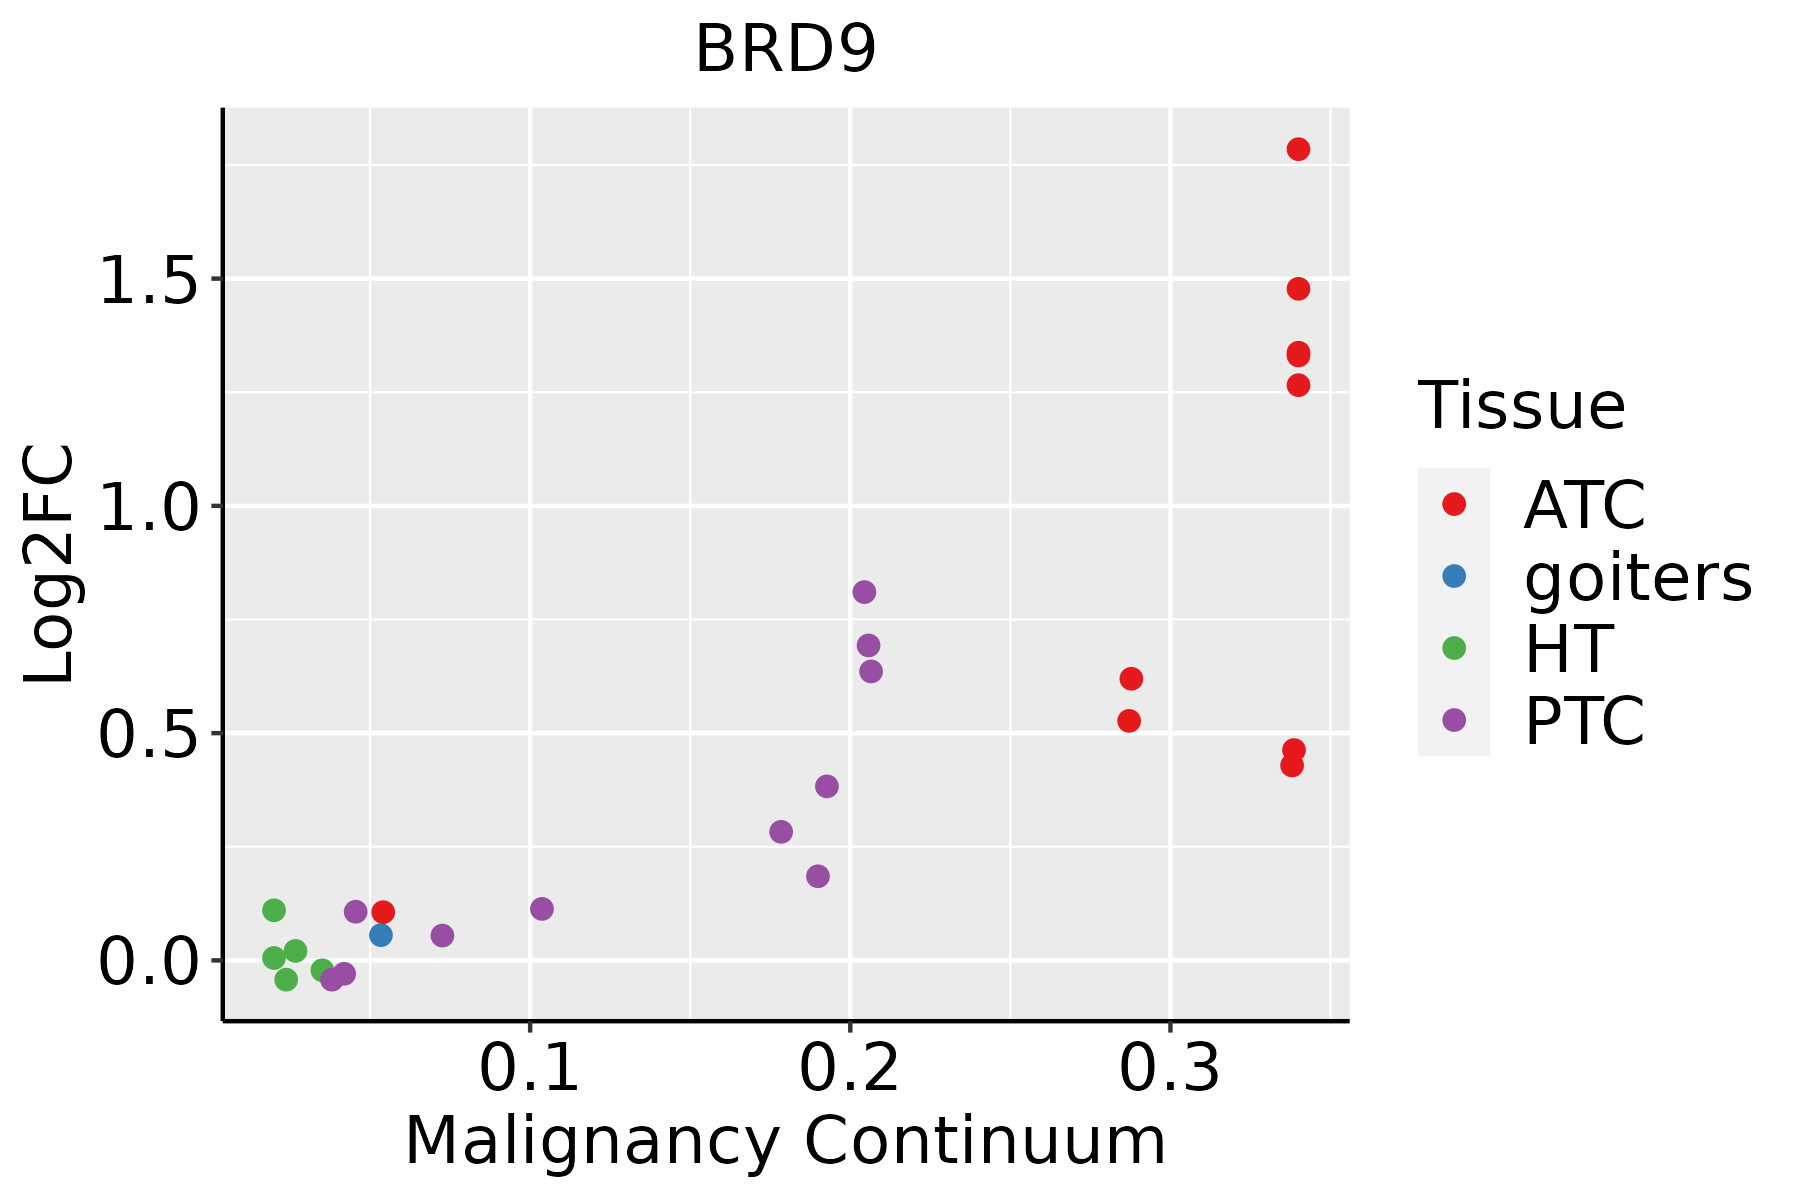 | ATC: Anaplastic thyroid cancer |
| HT: Hashimoto's thyroiditis | ||
| PTC: Papillary thyroid cancer |
| ∗log2FC in expression of this searched gene in stem-like cells from each diseased tissue sample relative to stem-like cells in normal samples in each tissue plotted against the malignancy continuum. Samples are colored based on if they are from different disease stage. |
Top |
Malignant transformation related pathway analysis |
| Find out the enriched GO biological processes and KEGG pathways involved in transition from healthy to precancer to cancer |
| Tissue | Disease Stage | Enriched GO biological Processes |
| Colorectum | AD |  |
| Colorectum | SER |  |
| Colorectum | MSS |  |
| Colorectum | MSI-H |  |
| Colorectum | FAP |  |
| ∗Top 15 enriched GO BP terms are showed in the bar plot of each disease state in each tissue. Each row represents a significant GO biological process which is colored according to the -log10(p.adjust). |
| Page: 1 2 3 4 5 6 7 8 9 |
| GO ID | Tissue | Disease Stage | Description | Gene Ratio | Bg Ratio | pvalue | p.adjust | Count |
| GO:000632516 | Esophagus | HGIN | chromatin organization | 92/2587 | 409/18723 | 1.05e-06 | 4.16e-05 | 92 |
| GO:000632517 | Esophagus | ESCC | chromatin organization | 240/8552 | 409/18723 | 6.52e-08 | 1.14e-06 | 240 |
| GO:000632511 | Liver | HCC | chromatin organization | 206/7958 | 409/18723 | 7.23e-04 | 4.41e-03 | 206 |
| GO:000632510 | Oral cavity | OSCC | chromatin organization | 190/7305 | 409/18723 | 1.17e-03 | 5.97e-03 | 190 |
| GO:000632514 | Prostate | Tumor | chromatin organization | 104/3246 | 409/18723 | 2.02e-05 | 2.62e-04 | 104 |
| GO:000632518 | Skin | AK | chromatin organization | 73/1910 | 409/18723 | 1.40e-06 | 4.26e-05 | 73 |
| GO:000632519 | Skin | cSCC | chromatin organization | 147/4864 | 409/18723 | 4.41e-06 | 6.52e-05 | 147 |
| GO:000632520 | Thyroid | PTC | chromatin organization | 183/5968 | 409/18723 | 2.55e-08 | 5.70e-07 | 183 |
| GO:0006325110 | Thyroid | ATC | chromatin organization | 189/6293 | 409/18723 | 6.40e-08 | 1.13e-06 | 189 |
| Page: 1 |
| Pathway ID | Tissue | Disease Stage | Description | Gene Ratio | Bg Ratio | pvalue | p.adjust | qvalue | Count |
| Page: 1 |
Top |
Cell-cell communication analysis |
| Identification of potential cell-cell interactions between two cell types and their ligand-receptor pairs for different disease states |
| Ligand | Receptor | LRpair | Pathway | Tissue | Disease Stage |
| Page: 1 |
Top |
Single-cell gene regulatory network inference analysis |
| Find out the significant the regulons (TFs) and the target genes of each regulon across cell types for different disease states |
| TF | Cell Type | Tissue | Disease Stage | Target Gene | RSS | Regulon Activity |
| ∗The dot plots of a searched regulon are shown for all cell subpopulations in each disease state of each tissue based on the regulon specific score inferred using pySCENIC and by calculating the average expression. |
| Page: 1 |
Top |
Somatic mutation of malignant transformation related genes |
| Annotation of somatic variants for genes involved in malignant transformation |
| Hugo Symbol | Variant Class | Variant Classification | dbSNP RS | HGVSc | HGVSp | HGVSp Short | SWISSPROT | BIOTYPE | SIFT | PolyPhen | Tumor Sample Barcode | Tissue | Histology | Sex | Age | Stage | Therapy Types | Drugs | Outcome |
| BRD9 | SNV | Missense_Mutation | rs761934433 | c.1633N>T | p.Arg545Trp | p.R545W | Q9H8M2 | protein_coding | deleterious(0) | probably_damaging(0.947) | TCGA-AC-A3W5-01 | Breast | breast invasive carcinoma | Female | >=65 | I/II | Chemotherapy | docetaxel | CR |
| BRD9 | SNV | Missense_Mutation | c.1456G>A | p.Val486Ile | p.V486I | Q9H8M2 | protein_coding | tolerated(0.37) | benign(0.001) | TCGA-AO-A1KR-01 | Breast | breast invasive carcinoma | Female | <65 | I/II | Chemotherapy | cyclophosphamide | SD | |
| BRD9 | SNV | Missense_Mutation | c.1682N>T | p.Gln561Leu | p.Q561L | Q9H8M2 | protein_coding | tolerated(0.82) | benign(0) | TCGA-E2-A14R-01 | Breast | breast invasive carcinoma | Female | <65 | I/II | Chemotherapy | doxorubicin | PD | |
| BRD9 | deletion | Frame_Shift_Del | c.728_765delTTTTGGGCAATGAAGATACAGCTGTTGAGGAACCTGTC | p.Leu243ProfsTer2 | p.L243Pfs*2 | Q9H8M2 | protein_coding | TCGA-A2-A0YJ-01 | Breast | breast invasive carcinoma | Female | <65 | III/IV | Chemotherapy | cytoxan | PD | |||
| BRD9 | SNV | Missense_Mutation | rs761934433 | c.1633N>T | p.Arg545Trp | p.R545W | Q9H8M2 | protein_coding | deleterious(0) | probably_damaging(0.947) | TCGA-EA-A43B-01 | Cervix | cervical & endocervical cancer | Female | <65 | I/II | Chemotherapy | cisplatin | CR |
| BRD9 | SNV | Missense_Mutation | rs763293348 | c.931C>T | p.Arg311Trp | p.R311W | Q9H8M2 | protein_coding | tolerated(0.06) | benign(0.115) | TCGA-MY-A5BD-01 | Cervix | cervical & endocervical cancer | Female | <65 | I/II | Chemotherapy | cisplatin | CR |
| BRD9 | SNV | Missense_Mutation | novel | c.1050N>C | p.Glu350Asp | p.E350D | Q9H8M2 | protein_coding | tolerated(0.32) | benign(0.204) | TCGA-VS-A9UM-01 | Cervix | cervical & endocervical cancer | Female | <65 | I/II | Chemotherapy | cisplatin | CR |
| BRD9 | SNV | Missense_Mutation | rs144680205 | c.1027N>A | p.Glu343Lys | p.E343K | Q9H8M2 | protein_coding | deleterious(0) | benign(0.241) | TCGA-AA-3877-01 | Colorectum | colon adenocarcinoma | Female | >=65 | I/II | Unknown | Unknown | SD |
| BRD9 | SNV | Missense_Mutation | rs758871899 | c.1705N>T | p.Arg569Cys | p.R569C | Q9H8M2 | protein_coding | deleterious_low_confidence(0) | benign(0.245) | TCGA-AA-A00N-01 | Colorectum | colon adenocarcinoma | Male | >=65 | I/II | Unknown | Unknown | PD |
| BRD9 | SNV | Missense_Mutation | c.883G>A | p.Ala295Thr | p.A295T | Q9H8M2 | protein_coding | tolerated(0.1) | possibly_damaging(0.766) | TCGA-AD-6889-01 | Colorectum | colon adenocarcinoma | Male | >=65 | I/II | Chemotherapy | xeloda | PD |
| Page: 1 2 3 4 5 6 |
Top |
Related drugs of malignant transformation related genes |
| Identification of chemicals and drugs interact with genes involved in malignant transfromation |
| (DGIdb 4.0) |
| Entrez ID | Symbol | Category | Interaction Types | Drug Claim Name | Drug Name | PMIDs |
| 65980 | BRD9 | ENZYME | inhibitor | 252166773 | ||
| 65980 | BRD9 | ENZYME | inhibitor | 310264731 | ||
| 65980 | BRD9 | ENZYME | inhibitor | 336446908 | ||
| 65980 | BRD9 | ENZYME | 387065623 | |||
| 65980 | BRD9 | ENZYME | inhibitor | 252166608 | ||
| 65980 | BRD9 | ENZYME | inhibitor | 252827481 | ||
| 65980 | BRD9 | ENZYME | 387065622 | |||
| 65980 | BRD9 | ENZYME | inhibitor | 315661231 |
| Page: 1 |

Copyright 2023-Present -The University of Texas Health Science Center at Houston |