
|
|||||
|
 | |
| |
| |
| |
| |
| |
|
Gene: BRD7 |
Gene summary for BRD7 |
| Gene information | Species | Human | Gene symbol | BRD7 | Gene ID | 29117 |
| Gene name | bromodomain containing 7 | |
| Gene Alias | BP75 | |
| Cytomap | 16q12.1 | |
| Gene Type | protein-coding | GO ID | GO:0000082 | UniProtAcc | Q9NPI1 |
Top |
Malignant transformation analysis |
| Identification of the aberrant gene expression in precancerous and cancerous lesions by comparing the gene expression of stem-like cells in diseased tissues with normal stem cells |
| Entrez ID | Symbol | Replicates | Species | Organ | Tissue | Adj P-value | Log2FC | Malignancy |
| 29117 | BRD7 | LZE2T | Human | Esophagus | ESCC | 4.29e-05 | 4.47e-01 | 0.082 |
| 29117 | BRD7 | LZE4T | Human | Esophagus | ESCC | 4.01e-12 | 3.17e-01 | 0.0811 |
| 29117 | BRD7 | LZE7T | Human | Esophagus | ESCC | 5.40e-13 | 4.63e-01 | 0.0667 |
| 29117 | BRD7 | LZE8T | Human | Esophagus | ESCC | 4.13e-04 | 6.32e-02 | 0.067 |
| 29117 | BRD7 | LZE20T | Human | Esophagus | ESCC | 1.65e-03 | 2.69e-02 | 0.0662 |
| 29117 | BRD7 | LZE22T | Human | Esophagus | ESCC | 2.00e-07 | 3.00e-01 | 0.068 |
| 29117 | BRD7 | LZE24T | Human | Esophagus | ESCC | 6.52e-13 | 3.64e-01 | 0.0596 |
| 29117 | BRD7 | LZE6T | Human | Esophagus | ESCC | 6.83e-03 | 2.40e-02 | 0.0845 |
| 29117 | BRD7 | P1T-E | Human | Esophagus | ESCC | 5.23e-14 | 5.41e-01 | 0.0875 |
| 29117 | BRD7 | P2T-E | Human | Esophagus | ESCC | 1.32e-20 | 3.05e-01 | 0.1177 |
| 29117 | BRD7 | P4T-E | Human | Esophagus | ESCC | 1.03e-42 | 1.04e+00 | 0.1323 |
| 29117 | BRD7 | P5T-E | Human | Esophagus | ESCC | 8.05e-28 | 5.68e-01 | 0.1327 |
| 29117 | BRD7 | P8T-E | Human | Esophagus | ESCC | 1.24e-24 | 4.42e-01 | 0.0889 |
| 29117 | BRD7 | P9T-E | Human | Esophagus | ESCC | 1.45e-16 | 1.87e-01 | 0.1131 |
| 29117 | BRD7 | P10T-E | Human | Esophagus | ESCC | 2.96e-21 | 3.36e-01 | 0.116 |
| 29117 | BRD7 | P11T-E | Human | Esophagus | ESCC | 1.51e-07 | 3.63e-01 | 0.1426 |
| 29117 | BRD7 | P12T-E | Human | Esophagus | ESCC | 6.92e-17 | 3.49e-01 | 0.1122 |
| 29117 | BRD7 | P15T-E | Human | Esophagus | ESCC | 9.71e-23 | 5.59e-01 | 0.1149 |
| 29117 | BRD7 | P16T-E | Human | Esophagus | ESCC | 1.45e-19 | 3.42e-01 | 0.1153 |
| 29117 | BRD7 | P17T-E | Human | Esophagus | ESCC | 7.05e-10 | 3.68e-01 | 0.1278 |
| Page: 1 2 3 4 5 6 |
| Tissue | Expression Dynamics | Abbreviation |
| Esophagus | 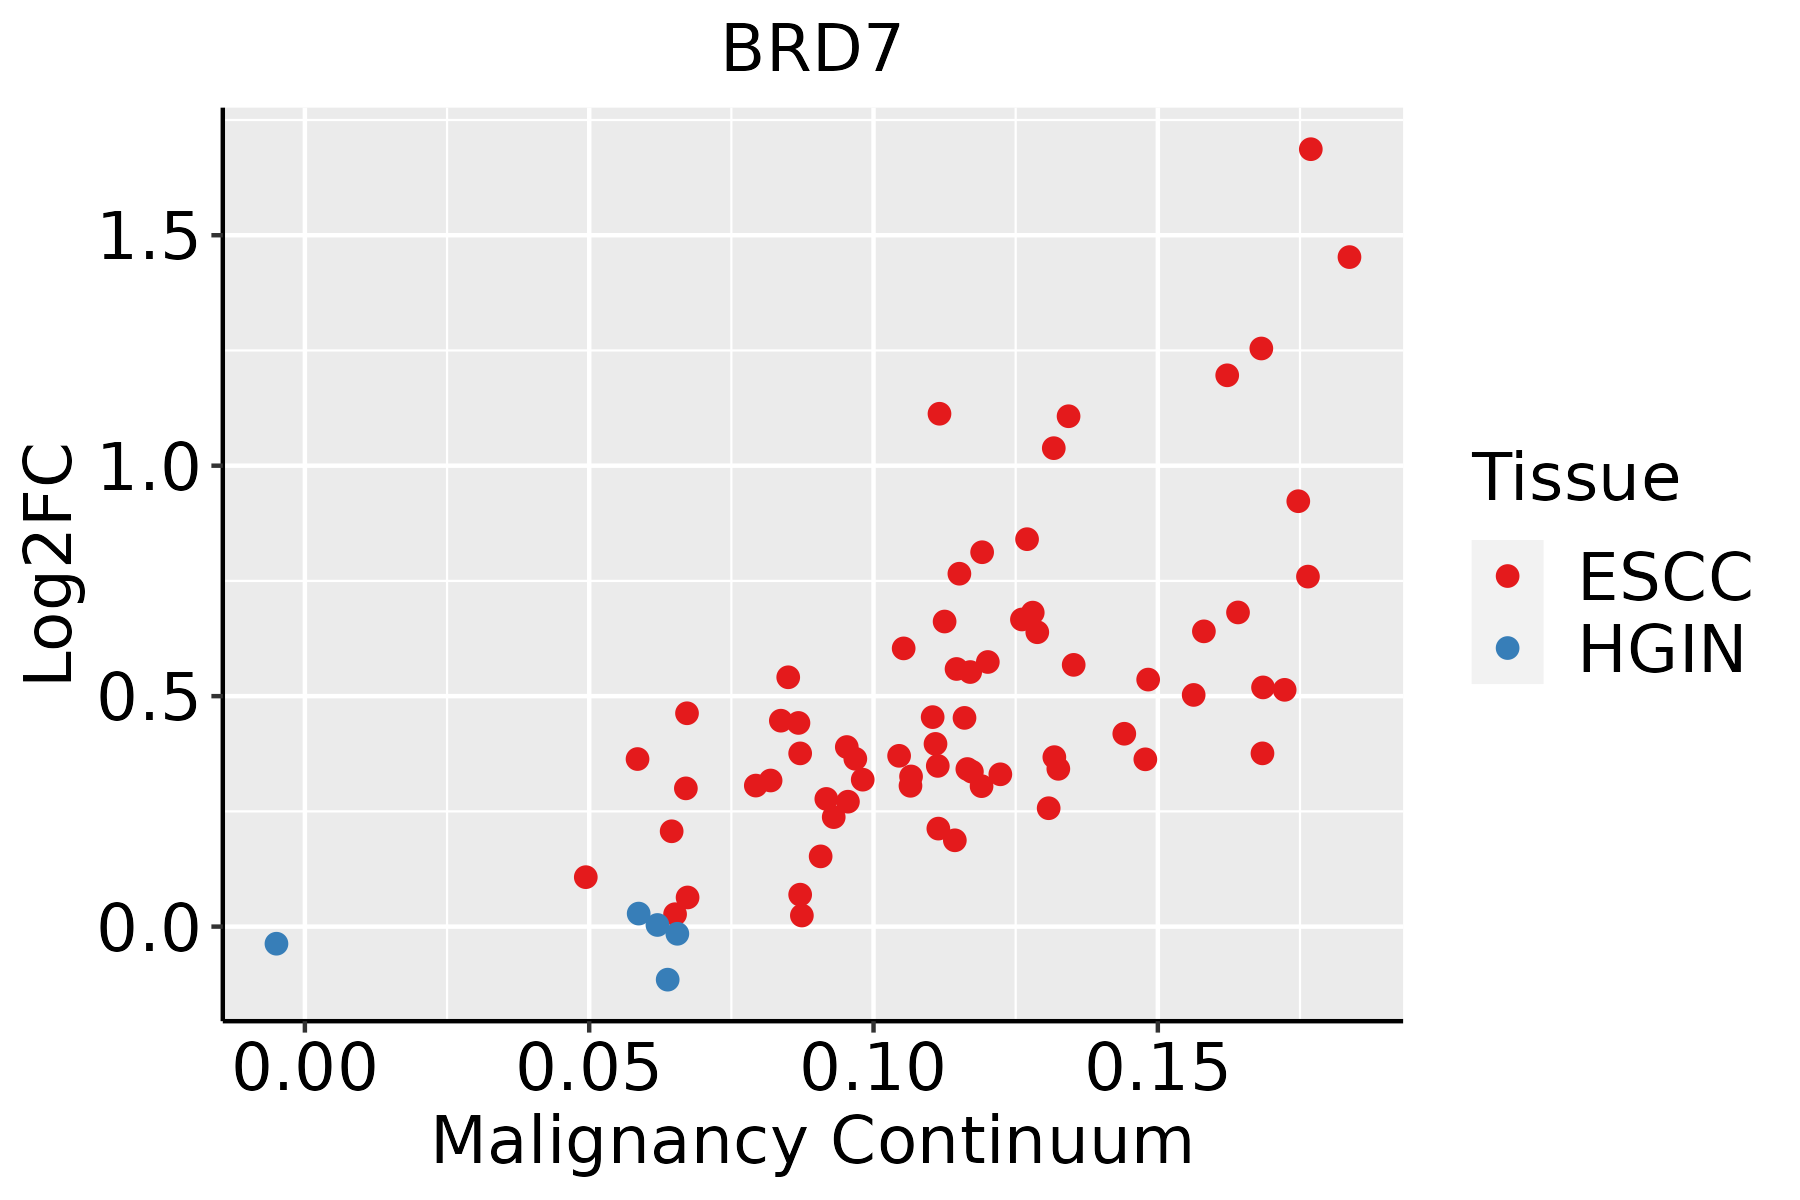 | ESCC: Esophageal squamous cell carcinoma |
| HGIN: High-grade intraepithelial neoplasias | ||
| LGIN: Low-grade intraepithelial neoplasias | ||
| Liver | 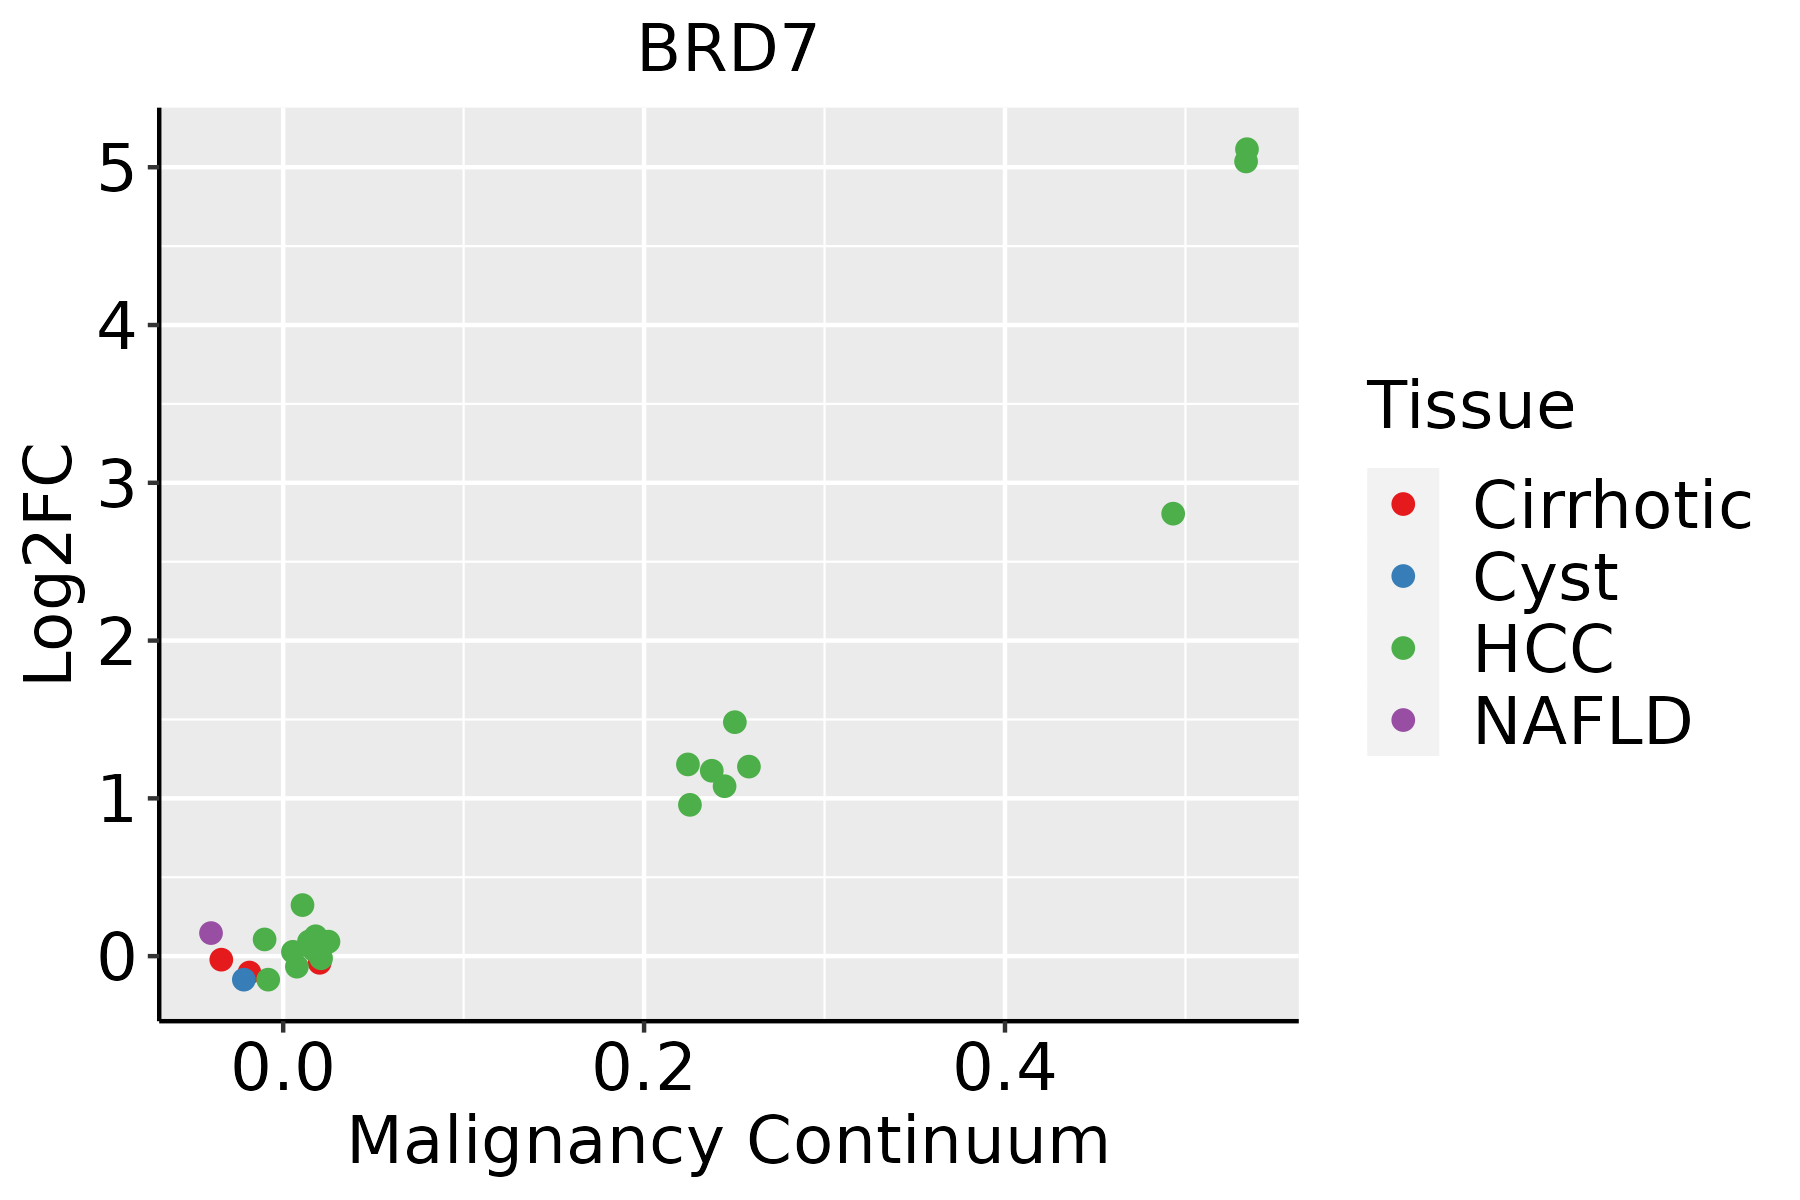 | HCC: Hepatocellular carcinoma |
| NAFLD: Non-alcoholic fatty liver disease | ||
| Oral Cavity |  | EOLP: Erosive Oral lichen planus |
| LP: leukoplakia | ||
| NEOLP: Non-erosive oral lichen planus | ||
| OSCC: Oral squamous cell carcinoma | ||
| Prostate |  | BPH: Benign Prostatic Hyperplasia |
| Skin |  | AK: Actinic keratosis |
| cSCC: Cutaneous squamous cell carcinoma | ||
| SCCIS:squamous cell carcinoma in situ | ||
| Thyroid | 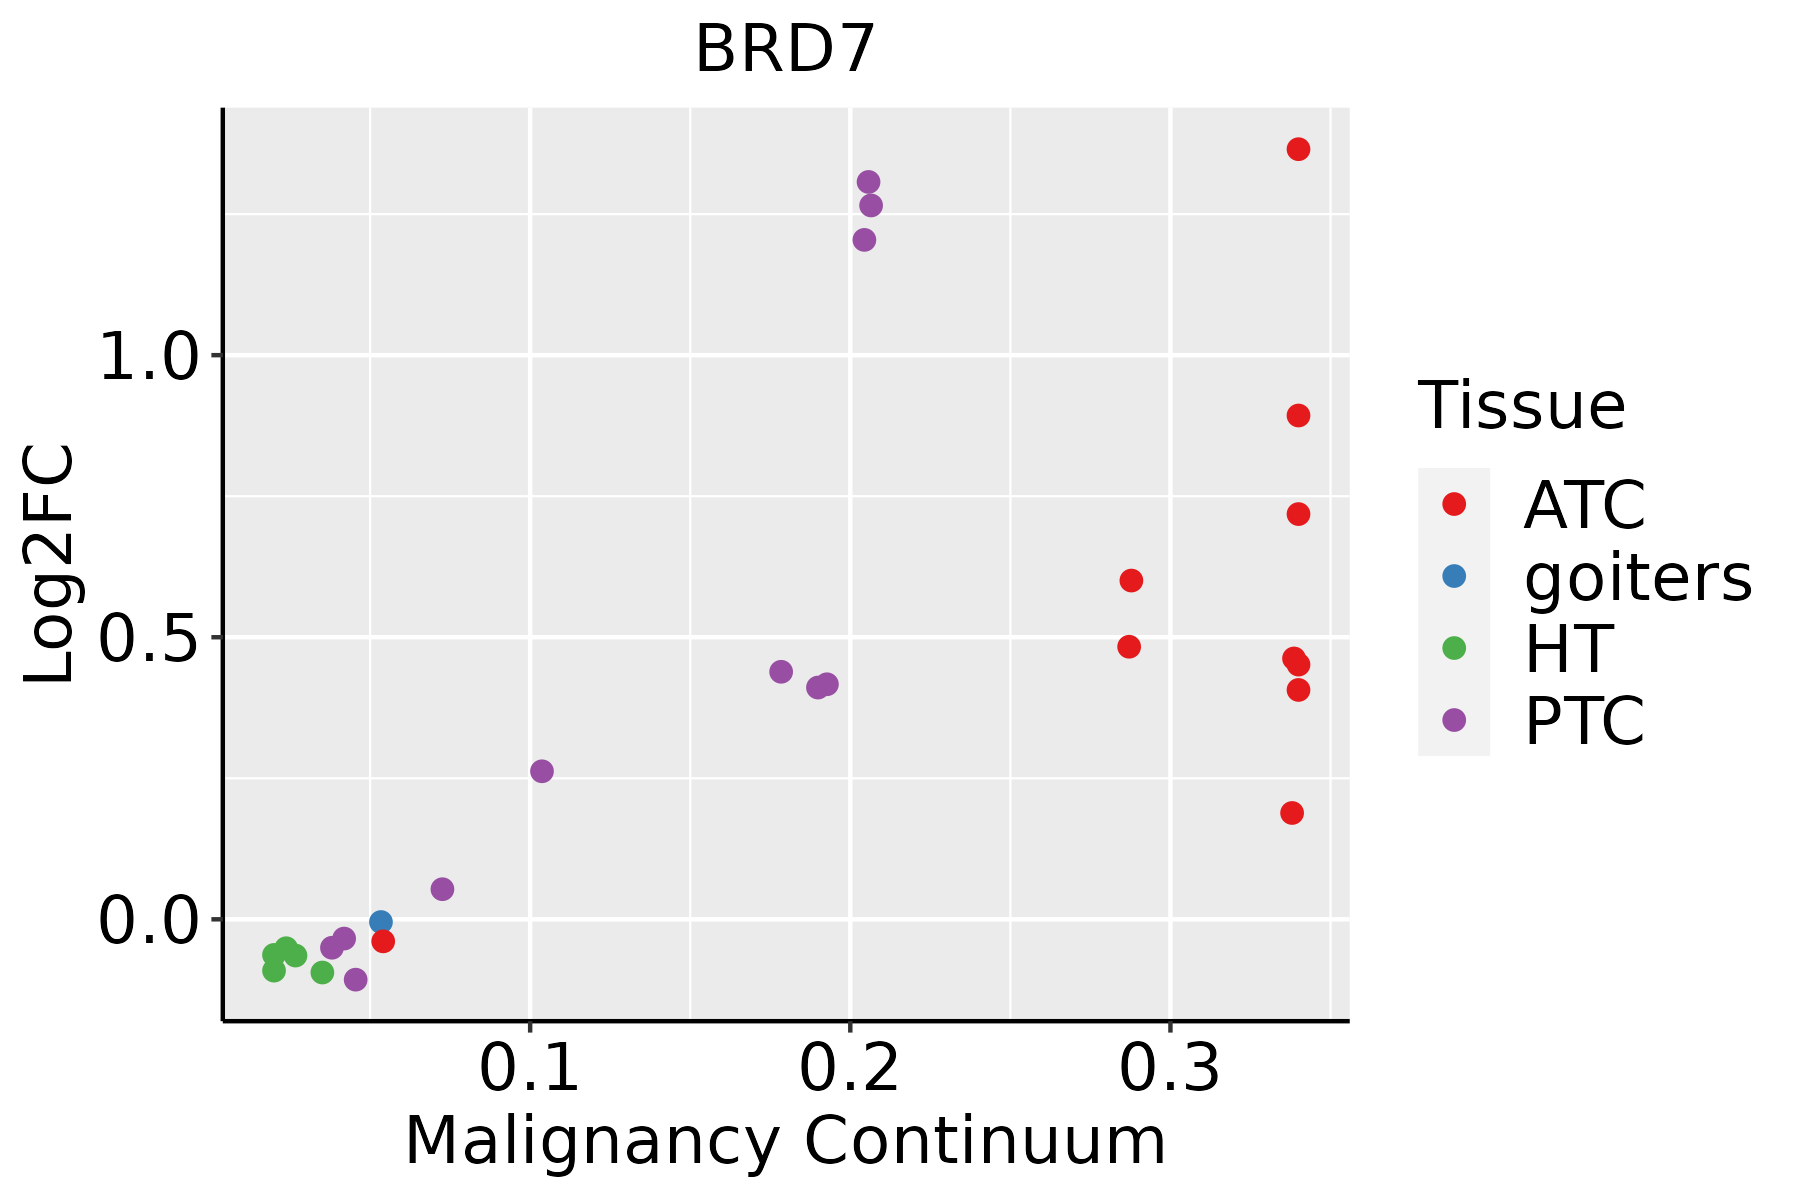 | ATC: Anaplastic thyroid cancer |
| HT: Hashimoto's thyroiditis | ||
| PTC: Papillary thyroid cancer |
| ∗log2FC in expression of this searched gene in stem-like cells from each diseased tissue sample relative to stem-like cells in normal samples in each tissue plotted against the malignancy continuum. Samples are colored based on if they are from different disease stage. |
Top |
Malignant transformation related pathway analysis |
| Find out the enriched GO biological processes and KEGG pathways involved in transition from healthy to precancer to cancer |
| Tissue | Disease Stage | Enriched GO biological Processes |
| Colorectum | AD |  |
| Colorectum | SER |  |
| Colorectum | MSS |  |
| Colorectum | MSI-H |  |
| Colorectum | FAP |  |
| ∗Top 15 enriched GO BP terms are showed in the bar plot of each disease state in each tissue. Each row represents a significant GO biological process which is colored according to the -log10(p.adjust). |
| Page: 1 2 3 4 5 6 7 8 9 |
| GO ID | Tissue | Disease Stage | Description | Gene Ratio | Bg Ratio | pvalue | p.adjust | Count |
| GO:001657015 | Esophagus | ESCC | histone modification | 323/8552 | 463/18723 | 2.61e-26 | 7.88e-24 | 323 |
| GO:001820514 | Esophagus | ESCC | peptidyl-lysine modification | 259/8552 | 376/18723 | 3.90e-20 | 5.26e-18 | 259 |
| GO:004477216 | Esophagus | ESCC | mitotic cell cycle phase transition | 281/8552 | 424/18723 | 4.63e-18 | 4.45e-16 | 281 |
| GO:000734615 | Esophagus | ESCC | regulation of mitotic cell cycle | 293/8552 | 457/18723 | 8.00e-16 | 5.64e-14 | 293 |
| GO:001839413 | Esophagus | ESCC | peptidyl-lysine acetylation | 123/8552 | 169/18723 | 6.58e-13 | 2.94e-11 | 123 |
| GO:004354313 | Esophagus | ESCC | protein acylation | 165/8552 | 243/18723 | 1.69e-12 | 7.14e-11 | 165 |
| GO:000647313 | Esophagus | ESCC | protein acetylation | 140/8552 | 201/18723 | 4.37e-12 | 1.69e-10 | 140 |
| GO:001839313 | Esophagus | ESCC | internal peptidyl-lysine acetylation | 114/8552 | 158/18723 | 1.16e-11 | 4.24e-10 | 114 |
| GO:000647513 | Esophagus | ESCC | internal protein amino acid acetylation | 115/8552 | 160/18723 | 1.43e-11 | 5.08e-10 | 115 |
| GO:00165735 | Esophagus | ESCC | histone acetylation | 110/8552 | 152/18723 | 1.95e-11 | 6.81e-10 | 110 |
| GO:190198713 | Esophagus | ESCC | regulation of cell cycle phase transition | 242/8552 | 390/18723 | 3.86e-11 | 1.26e-09 | 242 |
| GO:190199013 | Esophagus | ESCC | regulation of mitotic cell cycle phase transition | 191/8552 | 299/18723 | 1.35e-10 | 3.94e-09 | 191 |
| GO:001605517 | Esophagus | ESCC | Wnt signaling pathway | 268/8552 | 444/18723 | 2.32e-10 | 6.58e-09 | 268 |
| GO:019873817 | Esophagus | ESCC | cell-cell signaling by wnt | 269/8552 | 446/18723 | 2.41e-10 | 6.79e-09 | 269 |
| GO:00457865 | Esophagus | ESCC | negative regulation of cell cycle | 236/8552 | 385/18723 | 3.62e-10 | 9.93e-09 | 236 |
| GO:003105614 | Esophagus | ESCC | regulation of histone modification | 106/8552 | 152/18723 | 1.52e-09 | 3.55e-08 | 106 |
| GO:00109484 | Esophagus | ESCC | negative regulation of cell cycle process | 177/8552 | 294/18723 | 3.26e-07 | 4.59e-06 | 177 |
| GO:000008214 | Esophagus | ESCC | G1/S transition of mitotic cell cycle | 134/8552 | 214/18723 | 4.04e-07 | 5.55e-06 | 134 |
| GO:004484314 | Esophagus | ESCC | cell cycle G1/S phase transition | 148/8552 | 241/18723 | 5.68e-07 | 7.48e-06 | 148 |
| GO:00310583 | Esophagus | ESCC | positive regulation of histone modification | 65/8552 | 92/18723 | 1.04e-06 | 1.31e-05 | 65 |
| Page: 1 2 3 4 5 6 7 8 9 10 11 12 13 14 15 |
| Pathway ID | Tissue | Disease Stage | Description | Gene Ratio | Bg Ratio | pvalue | p.adjust | qvalue | Count |
| hsa0522518 | Esophagus | ESCC | Hepatocellular carcinoma | 109/4205 | 168/8465 | 4.27e-05 | 1.88e-04 | 9.64e-05 | 109 |
| hsa0522519 | Esophagus | ESCC | Hepatocellular carcinoma | 109/4205 | 168/8465 | 4.27e-05 | 1.88e-04 | 9.64e-05 | 109 |
| hsa052258 | Liver | HCC | Hepatocellular carcinoma | 106/4020 | 168/8465 | 2.87e-05 | 1.85e-04 | 1.03e-04 | 106 |
| hsa0522511 | Liver | HCC | Hepatocellular carcinoma | 106/4020 | 168/8465 | 2.87e-05 | 1.85e-04 | 1.03e-04 | 106 |
| hsa0522516 | Oral cavity | OSCC | Hepatocellular carcinoma | 97/3704 | 168/8465 | 1.63e-04 | 5.52e-04 | 2.81e-04 | 97 |
| hsa0522517 | Oral cavity | OSCC | Hepatocellular carcinoma | 97/3704 | 168/8465 | 1.63e-04 | 5.52e-04 | 2.81e-04 | 97 |
| hsa0522514 | Prostate | BPH | Hepatocellular carcinoma | 51/1718 | 168/8465 | 1.17e-03 | 5.22e-03 | 3.23e-03 | 51 |
| hsa0522515 | Prostate | BPH | Hepatocellular carcinoma | 51/1718 | 168/8465 | 1.17e-03 | 5.22e-03 | 3.23e-03 | 51 |
| hsa0522522 | Prostate | Tumor | Hepatocellular carcinoma | 53/1791 | 168/8465 | 9.65e-04 | 4.44e-03 | 2.75e-03 | 53 |
| hsa0522532 | Prostate | Tumor | Hepatocellular carcinoma | 53/1791 | 168/8465 | 9.65e-04 | 4.44e-03 | 2.75e-03 | 53 |
| Page: 1 |
Top |
Cell-cell communication analysis |
| Identification of potential cell-cell interactions between two cell types and their ligand-receptor pairs for different disease states |
| Ligand | Receptor | LRpair | Pathway | Tissue | Disease Stage |
| Page: 1 |
Top |
Single-cell gene regulatory network inference analysis |
| Find out the significant the regulons (TFs) and the target genes of each regulon across cell types for different disease states |
| TF | Cell Type | Tissue | Disease Stage | Target Gene | RSS | Regulon Activity |
| ∗The dot plots of a searched regulon are shown for all cell subpopulations in each disease state of each tissue based on the regulon specific score inferred using pySCENIC and by calculating the average expression. |
| Page: 1 |
Top |
Somatic mutation of malignant transformation related genes |
| Annotation of somatic variants for genes involved in malignant transformation |
| Hugo Symbol | Variant Class | Variant Classification | dbSNP RS | HGVSc | HGVSp | HGVSp Short | SWISSPROT | BIOTYPE | SIFT | PolyPhen | Tumor Sample Barcode | Tissue | Histology | Sex | Age | Stage | Therapy Types | Drugs | Outcome |
| BRD7 | SNV | Missense_Mutation | c.1381G>A | p.Asp461Asn | p.D461N | Q9NPI1 | protein_coding | tolerated(0.08) | probably_damaging(0.984) | TCGA-A8-A06Q-01 | Breast | breast invasive carcinoma | Female | <65 | III/IV | Unknown | Unknown | SD | |
| BRD7 | SNV | Missense_Mutation | c.1381N>A | p.Asp461Asn | p.D461N | Q9NPI1 | protein_coding | tolerated(0.08) | probably_damaging(0.984) | TCGA-A8-A07G-01 | Breast | breast invasive carcinoma | Female | >=65 | I/II | Chemotherapy | 5-fluorouracil | CR | |
| BRD7 | SNV | Missense_Mutation | c.682N>C | p.Gly228Arg | p.G228R | Q9NPI1 | protein_coding | deleterious(0) | probably_damaging(1) | TCGA-AC-A23H-01 | Breast | breast invasive carcinoma | Female | >=65 | I/II | Unknown | Unknown | PD | |
| BRD7 | SNV | Missense_Mutation | c.325G>T | p.Ala109Ser | p.A109S | Q9NPI1 | protein_coding | tolerated(0.31) | benign(0) | TCGA-GM-A2DK-01 | Breast | breast invasive carcinoma | Female | <65 | I/II | Hormone Therapy | arimidex | CR | |
| BRD7 | SNV | Missense_Mutation | rs777068623 | c.1334T>G | p.Ile445Ser | p.I445S | Q9NPI1 | protein_coding | deleterious(0) | possibly_damaging(0.53) | TCGA-OL-A5D7-01 | Breast | breast invasive carcinoma | Female | >=65 | I/II | Chemotherapy | cytoxan | CR |
| BRD7 | SNV | Missense_Mutation | novel | c.992N>C | p.Arg331Thr | p.R331T | Q9NPI1 | protein_coding | tolerated(0.17) | benign(0.112) | TCGA-C5-A7X8-01 | Cervix | cervical & endocervical cancer | Female | <65 | I/II | Chemotherapy | cisplatin | SD |
| BRD7 | SNV | Missense_Mutation | novel | c.804N>G | p.Asp268Glu | p.D268E | Q9NPI1 | protein_coding | tolerated(0.34) | benign(0.026) | TCGA-DS-A1OB-01 | Cervix | cervical & endocervical cancer | Female | <65 | I/II | Chemotherapy | carboplatin | PD |
| BRD7 | SNV | Missense_Mutation | novel | c.571N>G | p.Gln191Glu | p.Q191E | Q9NPI1 | protein_coding | deleterious(0.01) | benign(0.038) | TCGA-DS-A1OB-01 | Cervix | cervical & endocervical cancer | Female | <65 | I/II | Chemotherapy | carboplatin | PD |
| BRD7 | SNV | Missense_Mutation | c.1896N>C | p.Leu632Phe | p.L632F | Q9NPI1 | protein_coding | deleterious(0.03) | probably_damaging(0.999) | TCGA-EK-A2R8-01 | Cervix | cervical & endocervical cancer | Female | <65 | I/II | Unknown | Unknown | SD | |
| BRD7 | SNV | Missense_Mutation | c.1185N>C | p.Lys395Asn | p.K395N | Q9NPI1 | protein_coding | deleterious(0.01) | benign(0.191) | TCGA-Q1-A6DV-01 | Cervix | cervical & endocervical cancer | Female | <65 | I/II | Unknown | Unknown | SD |
| Page: 1 2 3 4 5 6 |
Top |
Related drugs of malignant transformation related genes |
| Identification of chemicals and drugs interact with genes involved in malignant transfromation |
| (DGIdb 4.0) |
| Entrez ID | Symbol | Category | Interaction Types | Drug Claim Name | Drug Name | PMIDs |
| 29117 | BRD7 | ENZYME | inhibitor | 252166773 | ||
| 29117 | BRD7 | ENZYME | inhibitor | 310264731 | ||
| 29117 | BRD7 | ENZYME | inhibitor | 336446908 |
| Page: 1 |

Copyright 2023-Present -The University of Texas Health Science Center at Houston |