| Tissue | Expression Dynamics | Abbreviation |
| Cervix |  | CC: Cervix cancer |
| HSIL_HPV: HPV-infected high-grade squamous intraepithelial lesions |
| N_HPV: HPV-infected normal cervix |
| Colorectum (GSE201348) |  | FAP: Familial adenomatous polyposis |
| CRC: Colorectal cancer |
| Colorectum (HTA11) |  | AD: Adenomas |
| SER: Sessile serrated lesions |
| MSI-H: Microsatellite-high colorectal cancer |
| MSS: Microsatellite stable colorectal cancer |
| Esophagus | 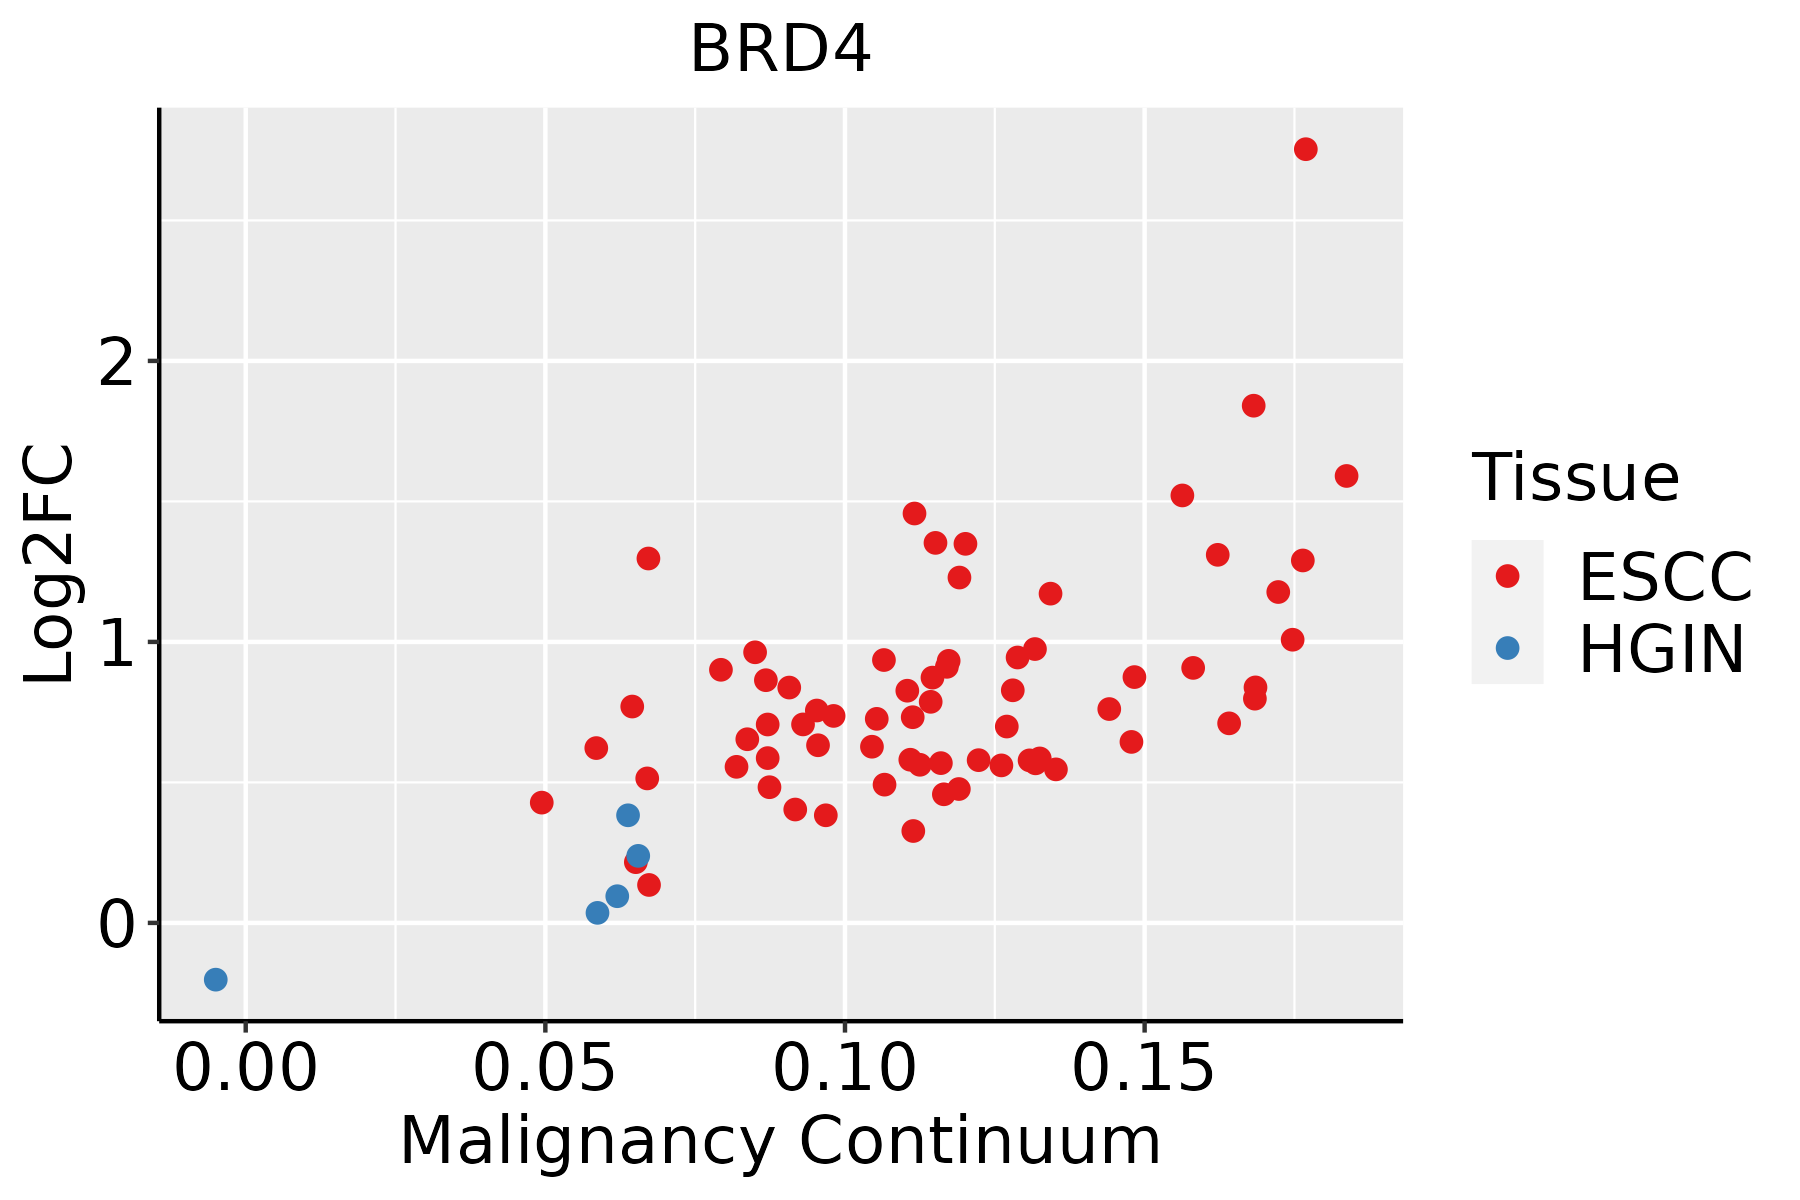 | ESCC: Esophageal squamous cell carcinoma |
| HGIN: High-grade intraepithelial neoplasias |
| LGIN: Low-grade intraepithelial neoplasias |
| Liver | 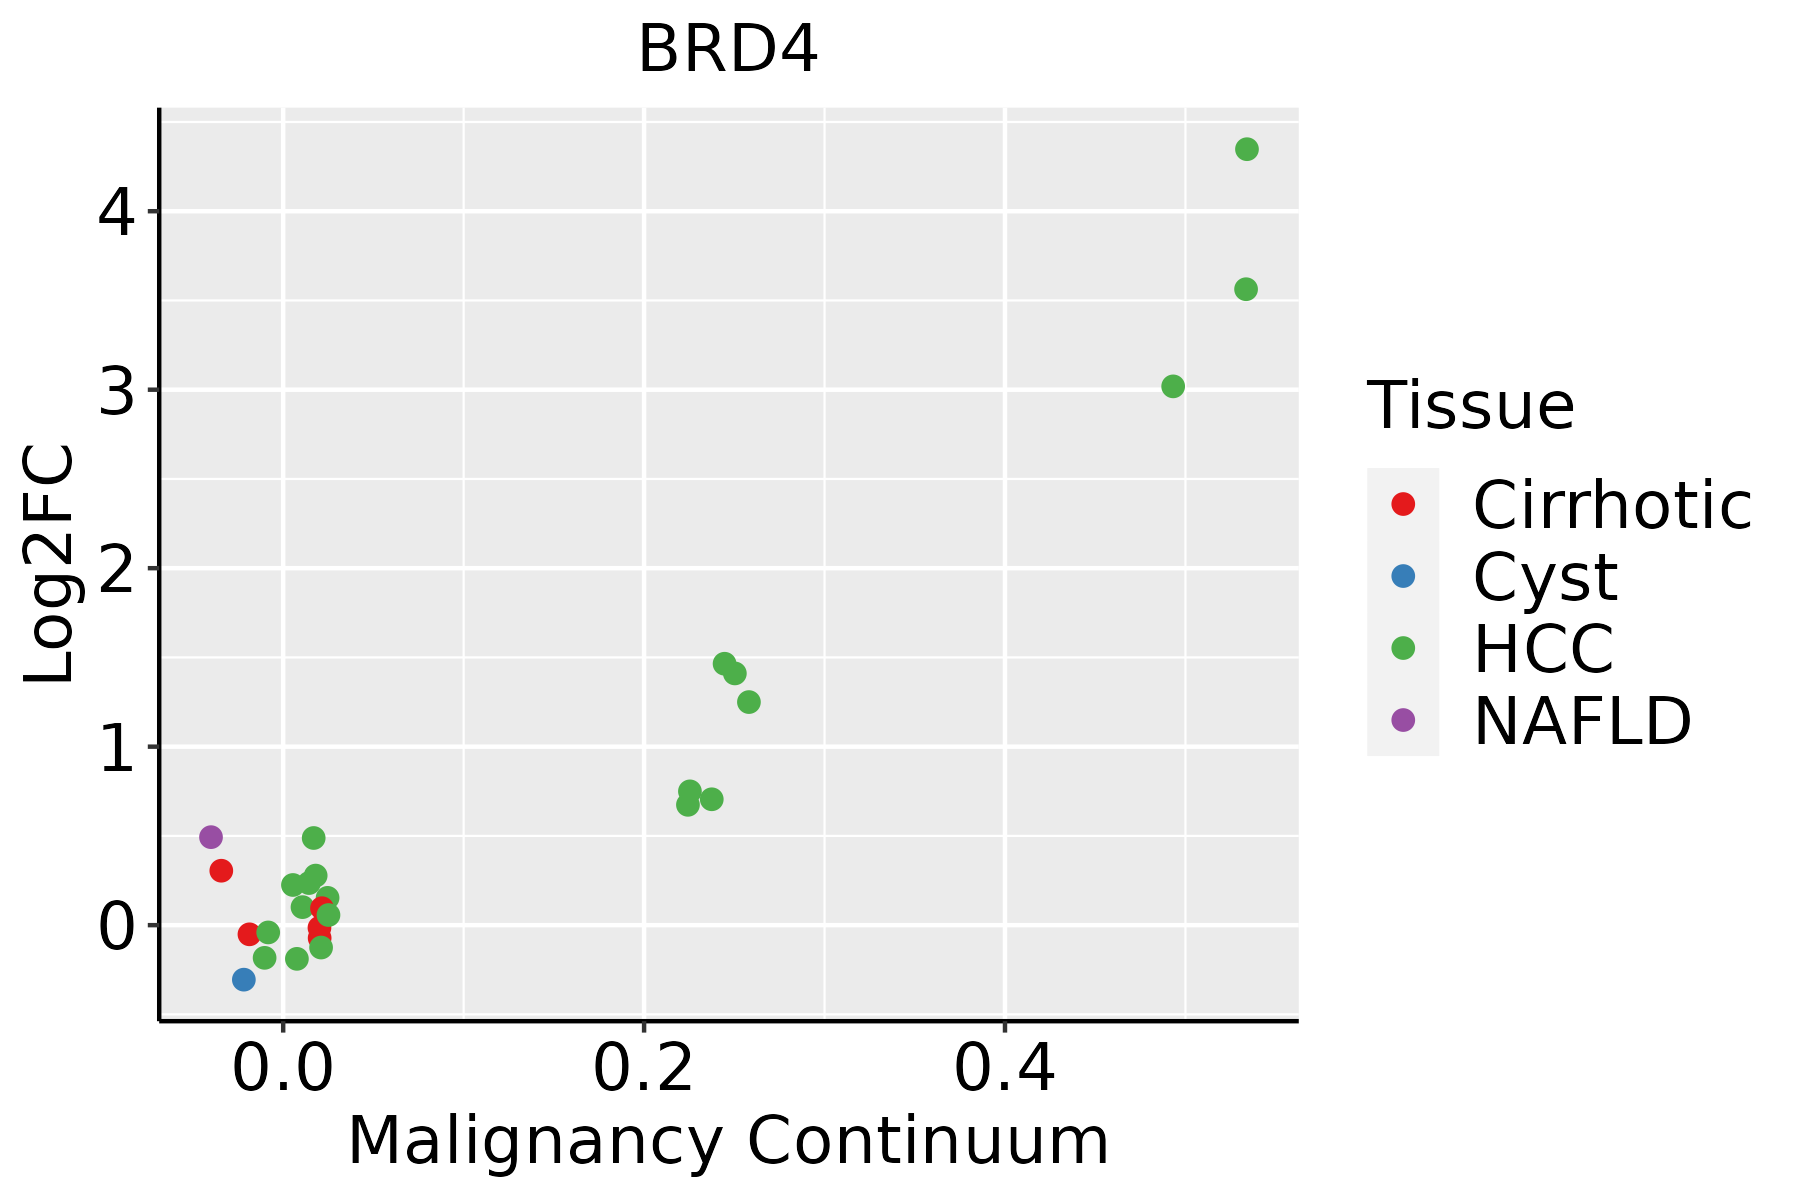 | HCC: Hepatocellular carcinoma |
| NAFLD: Non-alcoholic fatty liver disease |
| Oral Cavity | 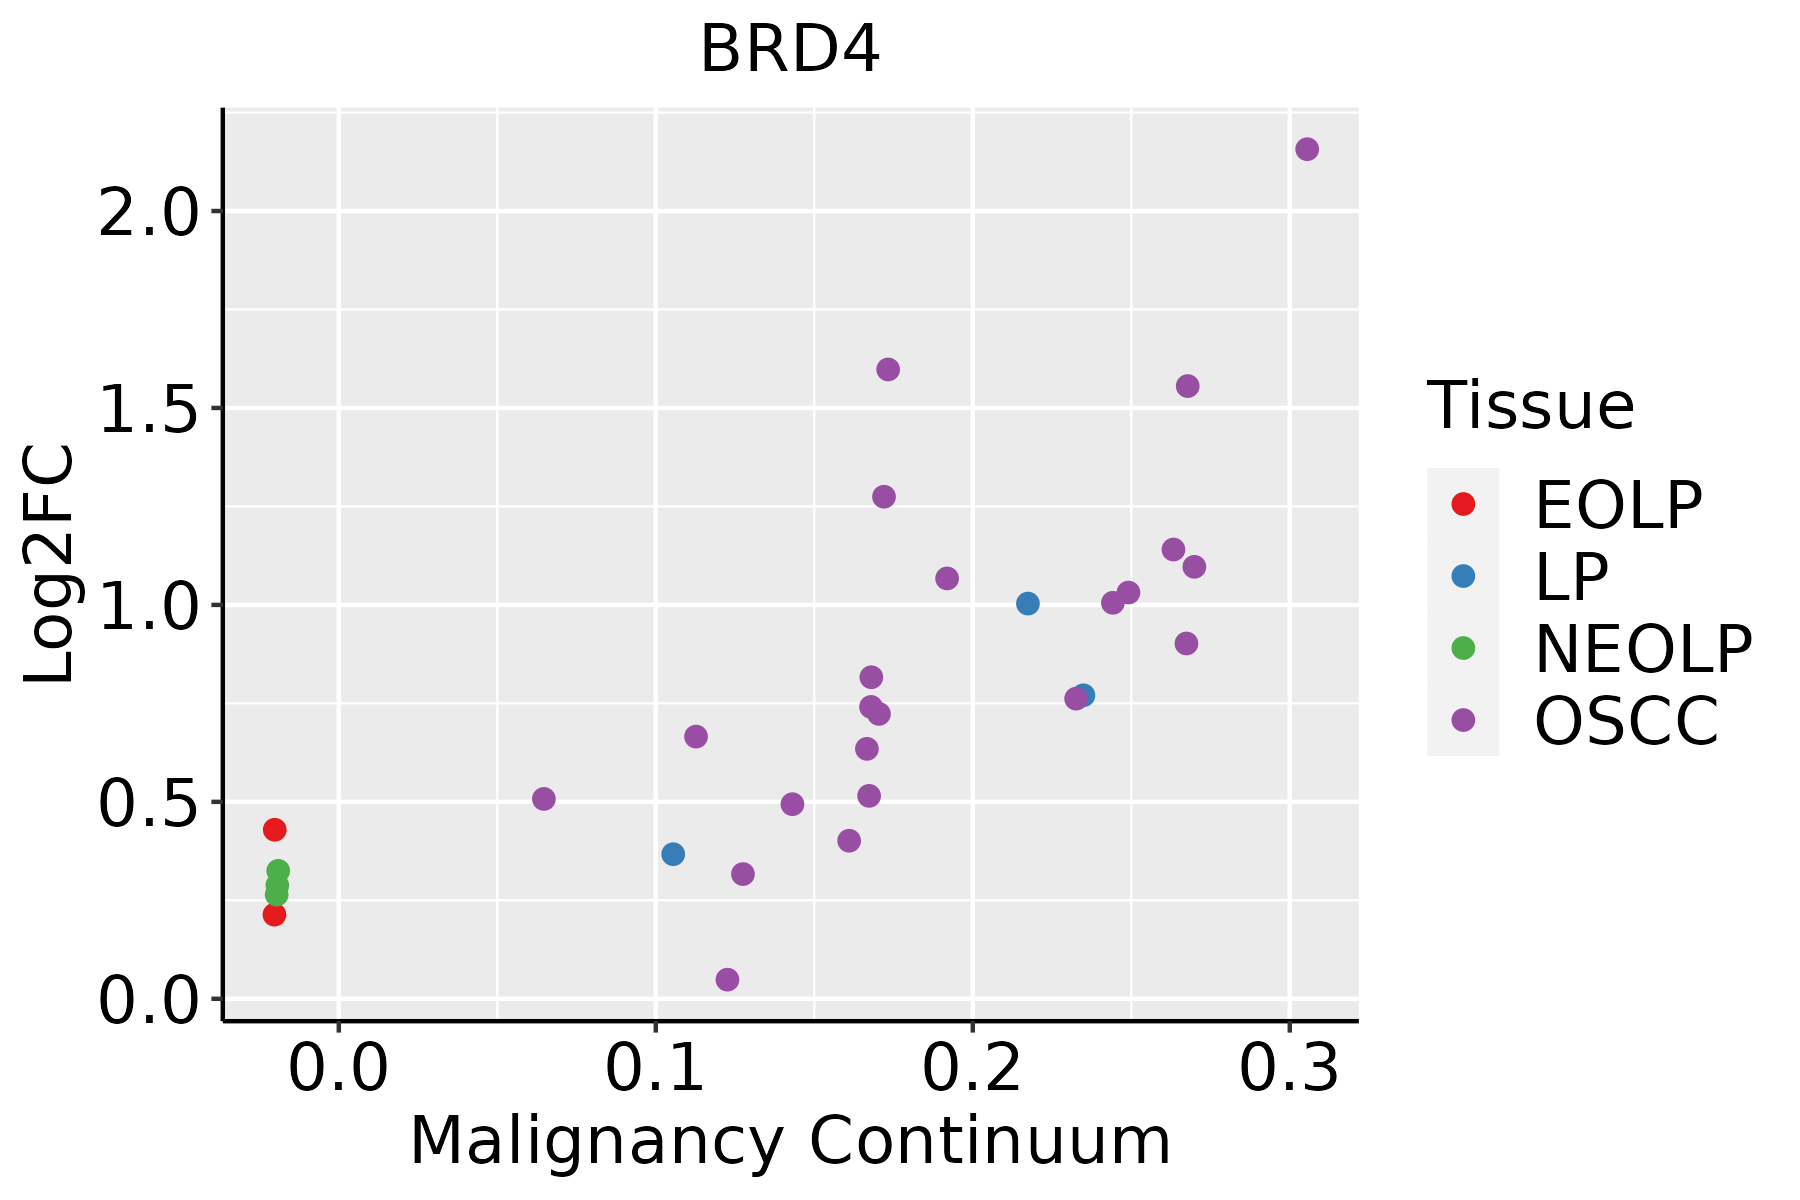 | EOLP: Erosive Oral lichen planus |
| LP: leukoplakia |
| NEOLP: Non-erosive oral lichen planus |
| OSCC: Oral squamous cell carcinoma |
| Skin | 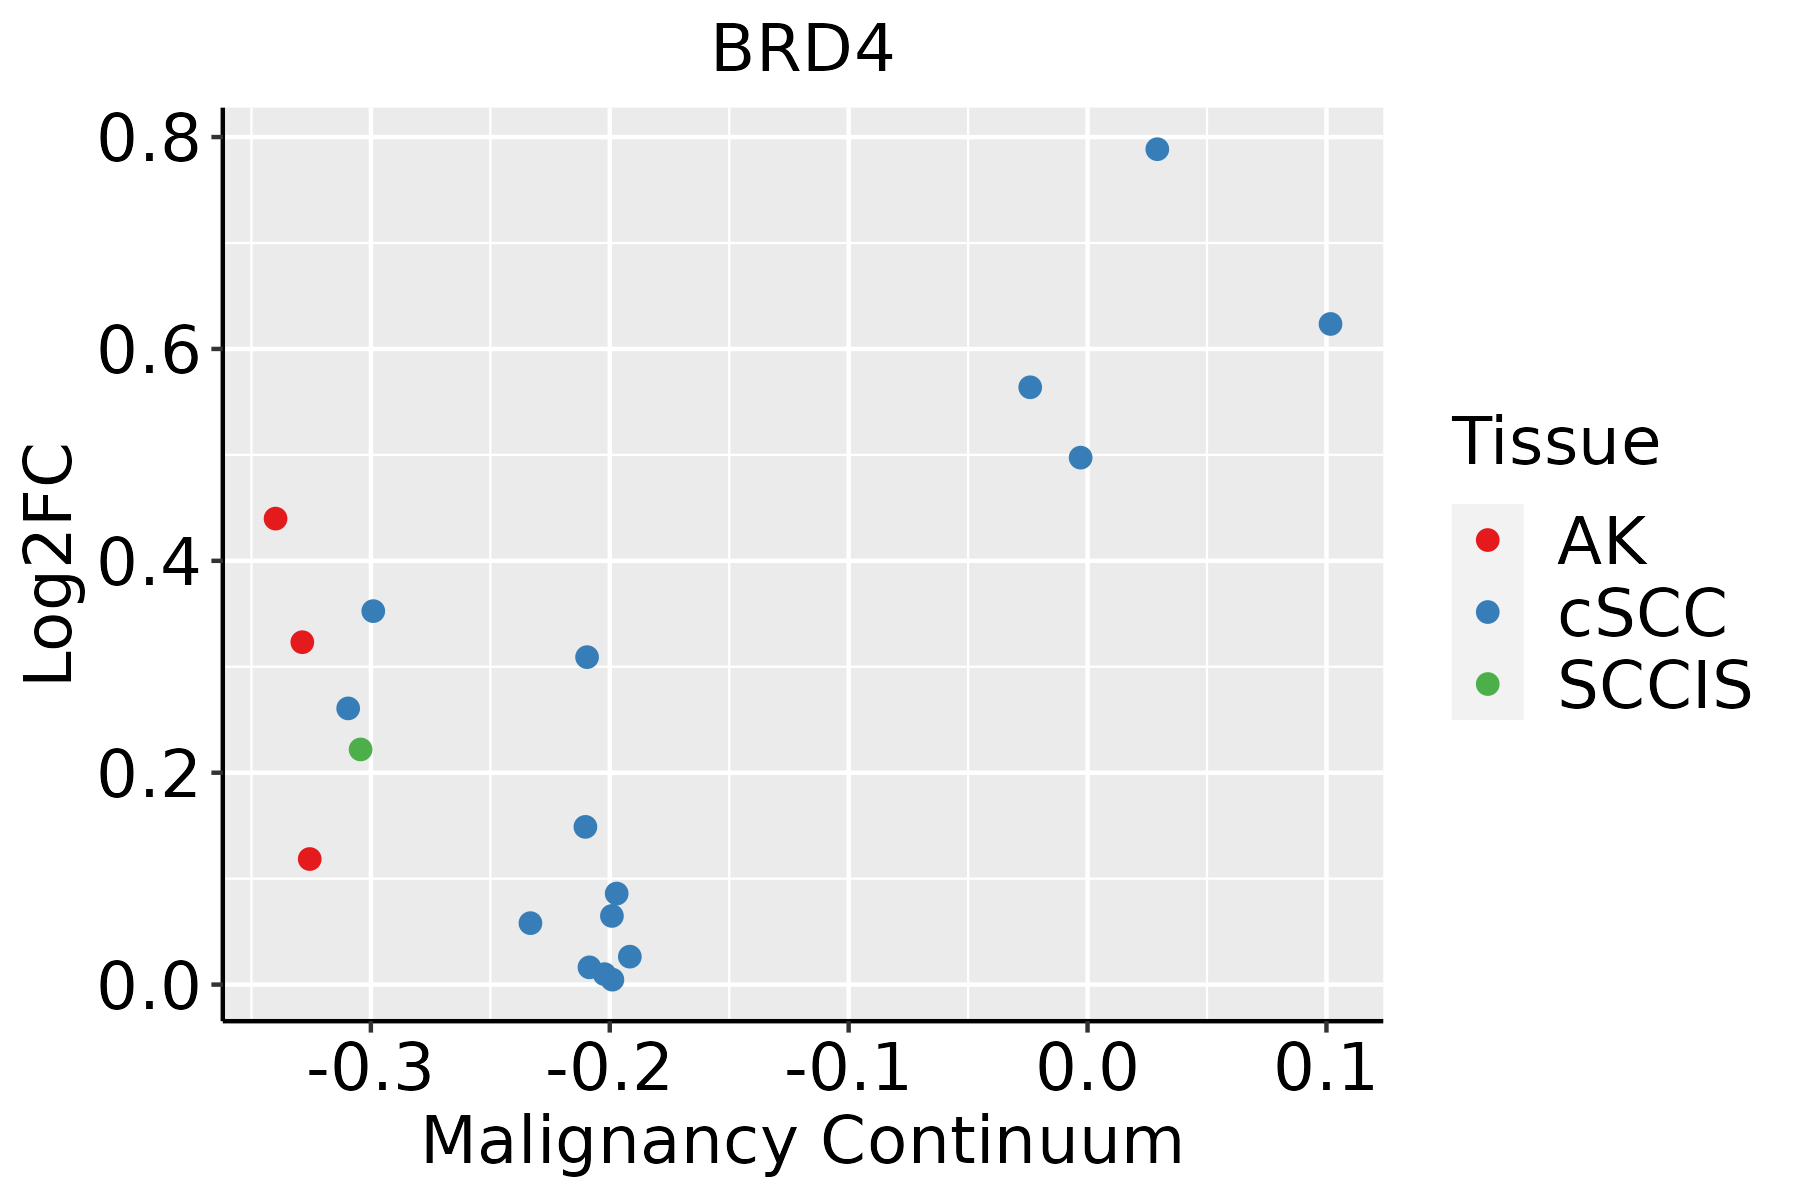 | AK: Actinic keratosis |
| cSCC: Cutaneous squamous cell carcinoma |
| SCCIS:squamous cell carcinoma in situ |
| Thyroid |  | ATC: Anaplastic thyroid cancer |
| HT: Hashimoto's thyroiditis |
| PTC: Papillary thyroid cancer |
| GO ID | Tissue | Disease Stage | Description | Gene Ratio | Bg Ratio | pvalue | p.adjust | Count |
| GO:00447725 | Cervix | CC | mitotic cell cycle phase transition | 89/2311 | 424/18723 | 2.70e-07 | 1.12e-05 | 89 |
| GO:00457876 | Cervix | CC | positive regulation of cell cycle | 66/2311 | 313/18723 | 7.78e-06 | 1.81e-04 | 66 |
| GO:00000824 | Cervix | CC | G1/S transition of mitotic cell cycle | 49/2311 | 214/18723 | 1.16e-05 | 2.48e-04 | 49 |
| GO:00073466 | Cervix | CC | regulation of mitotic cell cycle | 88/2311 | 457/18723 | 1.26e-05 | 2.60e-04 | 88 |
| GO:19019903 | Cervix | CC | regulation of mitotic cell cycle phase transition | 63/2311 | 299/18723 | 1.27e-05 | 2.60e-04 | 63 |
| GO:00448434 | Cervix | CC | cell cycle G1/S phase transition | 53/2311 | 241/18723 | 1.76e-05 | 3.32e-04 | 53 |
| GO:00459316 | Cervix | CC | positive regulation of mitotic cell cycle | 32/2311 | 121/18723 | 1.88e-05 | 3.47e-04 | 32 |
| GO:00507273 | Cervix | CC | regulation of inflammatory response | 75/2311 | 386/18723 | 3.95e-05 | 6.18e-04 | 75 |
| GO:19019922 | Cervix | CC | positive regulation of mitotic cell cycle phase transition | 26/2311 | 93/18723 | 3.97e-05 | 6.18e-04 | 26 |
| GO:00431228 | Cervix | CC | regulation of I-kappaB kinase/NF-kappaB signaling | 53/2311 | 249/18723 | 4.50e-05 | 6.87e-04 | 53 |
| GO:00063257 | Cervix | CC | chromatin organization | 78/2311 | 409/18723 | 5.40e-05 | 8.02e-04 | 78 |
| GO:00900685 | Cervix | CC | positive regulation of cell cycle process | 50/2311 | 236/18723 | 8.25e-05 | 1.11e-03 | 50 |
| GO:19019873 | Cervix | CC | regulation of cell cycle phase transition | 74/2311 | 390/18723 | 9.80e-05 | 1.27e-03 | 74 |
| GO:00104525 | Cervix | CC | histone H3-K36 methylation | 8/2311 | 15/18723 | 1.53e-04 | 1.85e-03 | 8 |
| GO:00165705 | Cervix | CC | histone modification | 84/2311 | 463/18723 | 1.70e-04 | 2.01e-03 | 84 |
| GO:00072497 | Cervix | CC | I-kappaB kinase/NF-kappaB signaling | 56/2311 | 281/18723 | 1.81e-04 | 2.12e-03 | 56 |
| GO:19019892 | Cervix | CC | positive regulation of cell cycle phase transition | 28/2311 | 115/18723 | 2.82e-04 | 3.07e-03 | 28 |
| GO:1902751 | Cervix | CC | positive regulation of cell cycle G2/M phase transition | 11/2311 | 30/18723 | 5.71e-04 | 5.45e-03 | 11 |
| GO:00349685 | Cervix | CC | histone lysine methylation | 27/2311 | 115/18723 | 6.61e-04 | 6.09e-03 | 27 |
| GO:00310565 | Cervix | CC | regulation of histone modification | 33/2311 | 152/18723 | 7.97e-04 | 7.00e-03 | 33 |
| Hugo Symbol | Variant Class | Variant Classification | dbSNP RS | HGVSc | HGVSp | HGVSp Short | SWISSPROT | BIOTYPE | SIFT | PolyPhen | Tumor Sample Barcode | Tissue | Histology | Sex | Age | Stage | Therapy Types | Drugs | Outcome |
| BRD4 | SNV | Missense_Mutation | novel | c.2808N>T | p.Gln936His | p.Q936H | O60885 | protein_coding | tolerated(0.08) | benign(0) | TCGA-A2-A4RY-01 | Breast | breast invasive carcinoma | Female | <65 | III/IV | Chemotherapy | taxotere | CR |
| BRD4 | SNV | Missense_Mutation | rs761158744 | c.1638N>C | p.Lys546Asn | p.K546N | O60885 | protein_coding | tolerated(0.1) | probably_damaging(0.922) | TCGA-A7-A26H-01 | Breast | breast invasive carcinoma | Female | >=65 | I/II | Hormone Therapy | anastrozole | PD |
| BRD4 | SNV | Missense_Mutation | rs369254108 | c.44N>T | p.Pro15Leu | p.P15L | O60885 | protein_coding | deleterious_low_confidence(0.02) | possibly_damaging(0.656) | TCGA-AR-A1AX-01 | Breast | breast invasive carcinoma | Female | <65 | I/II | Chemotherapy | cytoxan | SD |
| BRD4 | SNV | Missense_Mutation | novel | c.1801T>A | p.Ser601Thr | p.S601T | O60885 | protein_coding | deleterious(0.03) | benign(0.262) | TCGA-E9-A1NC-01 | Breast | breast invasive carcinoma | Female | <65 | I/II | Chemotherapy | doxorubicin | CR |
| BRD4 | SNV | Missense_Mutation | | c.3219N>C | p.Met1073Ile | p.M1073I | O60885 | protein_coding | tolerated_low_confidence(0.08) | benign(0) | TCGA-EW-A1PB-01 | Breast | breast invasive carcinoma | Female | >=65 | III/IV | Unknown | Unknown | SD |
| BRD4 | insertion | In_Frame_Ins | novel | c.1798_1799insTCTGGGGCCTCTCTGCACCTTGTTGCCTGCAGCTGTGTTCTA | p.Glu600delinsValTrpGlyLeuSerAlaProCysCysLeuGlnLeuCysSerLys | p.E600delinsVWGLSAPCCLQLCSK | O60885 | protein_coding | | | TCGA-A8-A095-01 | Breast | breast invasive carcinoma | Female | <65 | I/II | Chemotherapy | 5-fluorouracil | CR |
| BRD4 | insertion | Frame_Shift_Ins | novel | c.3504_3505insACCAGTCCCCAGGCTGACTGGGACCCTCT | p.Ala1169ThrfsTer36 | p.A1169Tfs*36 | O60885 | protein_coding | | | TCGA-A8-A0A4-01 | Breast | breast invasive carcinoma | Female | >=65 | I/II | Hormone Therapy | tamoxiphen | CR |
| BRD4 | insertion | Nonsense_Mutation | novel | c.4055_4056insACATAGTTGGCATATCTTTGTTTGAAGTTTGTTGGTGGA | p.Ser1351_Asp1352insGluHisSerTrpHisIlePheValTerSerLeuLeuVal | p.S1351_D1352insEHSWHIFV*SLLV | O60885 | protein_coding | | | TCGA-B6-A0I8-01 | Breast | breast invasive carcinoma | Female | <65 | I/II | Unknown | Unknown | PD |
| BRD4 | insertion | In_Frame_Ins | novel | c.3737_3738insCACAATGGCACTGCTTATCTC | p.Glu1246delinsAspThrMetAlaLeuLeuIleSer | p.E1246delinsDTMALLIS | O60885 | protein_coding | | | TCGA-BH-A0H7-01 | Breast | breast invasive carcinoma | Female | >=65 | III/IV | Chemotherapy | doxorubicin | SD |
| BRD4 | SNV | Missense_Mutation | novel | c.3767N>A | p.Arg1256Gln | p.R1256Q | O60885 | protein_coding | tolerated(0.18) | benign(0.196) | TCGA-2W-A8YY-01 | Cervix | cervical & endocervical cancer | Female | <65 | I/II | Chemotherapy | cisplatin | CR |
| Entrez ID | Symbol | Category | Interaction Types | Drug Claim Name | Drug Name | PMIDs |
| 23476 | BRD4 | CLINICALLY ACTIONABLE, KINASE, SERINE THREONINE KINASE, ENZYME, DRUGGABLE GENOME | | Aminocyclopentenone compound 1 | | |
| 23476 | BRD4 | CLINICALLY ACTIONABLE, KINASE, SERINE THREONINE KINASE, ENZYME, DRUGGABLE GENOME | inhibitor | 178102626 | | |
| 23476 | BRD4 | CLINICALLY ACTIONABLE, KINASE, SERINE THREONINE KINASE, ENZYME, DRUGGABLE GENOME | | Aminocyclopentenone compound 6 | | |
| 23476 | BRD4 | CLINICALLY ACTIONABLE, KINASE, SERINE THREONINE KINASE, ENZYME, DRUGGABLE GENOME | inhibitor | 405067321 | | |
| 23476 | BRD4 | CLINICALLY ACTIONABLE, KINASE, SERINE THREONINE KINASE, ENZYME, DRUGGABLE GENOME | | BIRABRESIB | BIRABRESIB | 26976114 |
| 23476 | BRD4 | CLINICALLY ACTIONABLE, KINASE, SERINE THREONINE KINASE, ENZYME, DRUGGABLE GENOME | | CPI-0610 | | |
| 23476 | BRD4 | CLINICALLY ACTIONABLE, KINASE, SERINE THREONINE KINASE, ENZYME, DRUGGABLE GENOME | | RVX-208 | APABETALONE | |
| 23476 | BRD4 | CLINICALLY ACTIONABLE, KINASE, SERINE THREONINE KINASE, ENZYME, DRUGGABLE GENOME | | ALPRAZOLAM | ALPRAZOLAM | 22137933 |
| 23476 | BRD4 | CLINICALLY ACTIONABLE, KINASE, SERINE THREONINE KINASE, ENZYME, DRUGGABLE GENOME | inhibitor | 187051820 | | |
| 23476 | BRD4 | CLINICALLY ACTIONABLE, KINASE, SERINE THREONINE KINASE, ENZYME, DRUGGABLE GENOME | inhibitor | 252166516 | | |


