
|
|||||
|
 | |
| |
| |
| |
| |
| |
|
Gene: BRD3 |
Gene summary for BRD3 |
| Gene information | Species | Human | Gene symbol | BRD3 | Gene ID | 8019 |
| Gene name | bromodomain containing 3 | |
| Gene Alias | ORFX | |
| Cytomap | 9q34.2 | |
| Gene Type | protein-coding | GO ID | GO:0006139 | UniProtAcc | A0A024R8H6 |
Top |
Malignant transformation analysis |
| Identification of the aberrant gene expression in precancerous and cancerous lesions by comparing the gene expression of stem-like cells in diseased tissues with normal stem cells |
| Entrez ID | Symbol | Replicates | Species | Organ | Tissue | Adj P-value | Log2FC | Malignancy |
| 8019 | BRD3 | LZE2T | Human | Esophagus | ESCC | 1.80e-03 | 3.71e-01 | 0.082 |
| 8019 | BRD3 | LZE4T | Human | Esophagus | ESCC | 2.02e-12 | 4.04e-01 | 0.0811 |
| 8019 | BRD3 | LZE5T | Human | Esophagus | ESCC | 5.58e-05 | 2.95e-01 | 0.0514 |
| 8019 | BRD3 | LZE7T | Human | Esophagus | ESCC | 3.44e-05 | 4.70e-01 | 0.0667 |
| 8019 | BRD3 | LZE8T | Human | Esophagus | ESCC | 8.39e-06 | 1.92e-01 | 0.067 |
| 8019 | BRD3 | LZE20T | Human | Esophagus | ESCC | 2.11e-19 | 4.57e-01 | 0.0662 |
| 8019 | BRD3 | LZE24T | Human | Esophagus | ESCC | 7.81e-24 | 6.66e-01 | 0.0596 |
| 8019 | BRD3 | LZE6T | Human | Esophagus | ESCC | 4.64e-04 | 2.46e-01 | 0.0845 |
| 8019 | BRD3 | P1T-E | Human | Esophagus | ESCC | 5.85e-14 | 4.46e-01 | 0.0875 |
| 8019 | BRD3 | P2T-E | Human | Esophagus | ESCC | 3.36e-59 | 1.10e+00 | 0.1177 |
| 8019 | BRD3 | P4T-E | Human | Esophagus | ESCC | 6.85e-22 | 4.19e-01 | 0.1323 |
| 8019 | BRD3 | P5T-E | Human | Esophagus | ESCC | 1.59e-15 | 2.28e-01 | 0.1327 |
| 8019 | BRD3 | P8T-E | Human | Esophagus | ESCC | 3.72e-40 | 8.46e-01 | 0.0889 |
| 8019 | BRD3 | P9T-E | Human | Esophagus | ESCC | 6.62e-18 | 3.74e-01 | 0.1131 |
| 8019 | BRD3 | P10T-E | Human | Esophagus | ESCC | 1.62e-28 | 6.97e-01 | 0.116 |
| 8019 | BRD3 | P11T-E | Human | Esophagus | ESCC | 3.45e-15 | 6.53e-01 | 0.1426 |
| 8019 | BRD3 | P12T-E | Human | Esophagus | ESCC | 1.06e-27 | 5.47e-01 | 0.1122 |
| 8019 | BRD3 | P15T-E | Human | Esophagus | ESCC | 2.21e-26 | 5.96e-01 | 0.1149 |
| 8019 | BRD3 | P16T-E | Human | Esophagus | ESCC | 7.77e-23 | 4.46e-01 | 0.1153 |
| 8019 | BRD3 | P17T-E | Human | Esophagus | ESCC | 2.74e-06 | 3.75e-01 | 0.1278 |
| Page: 1 2 3 4 5 6 |
| Tissue | Expression Dynamics | Abbreviation |
| Esophagus | 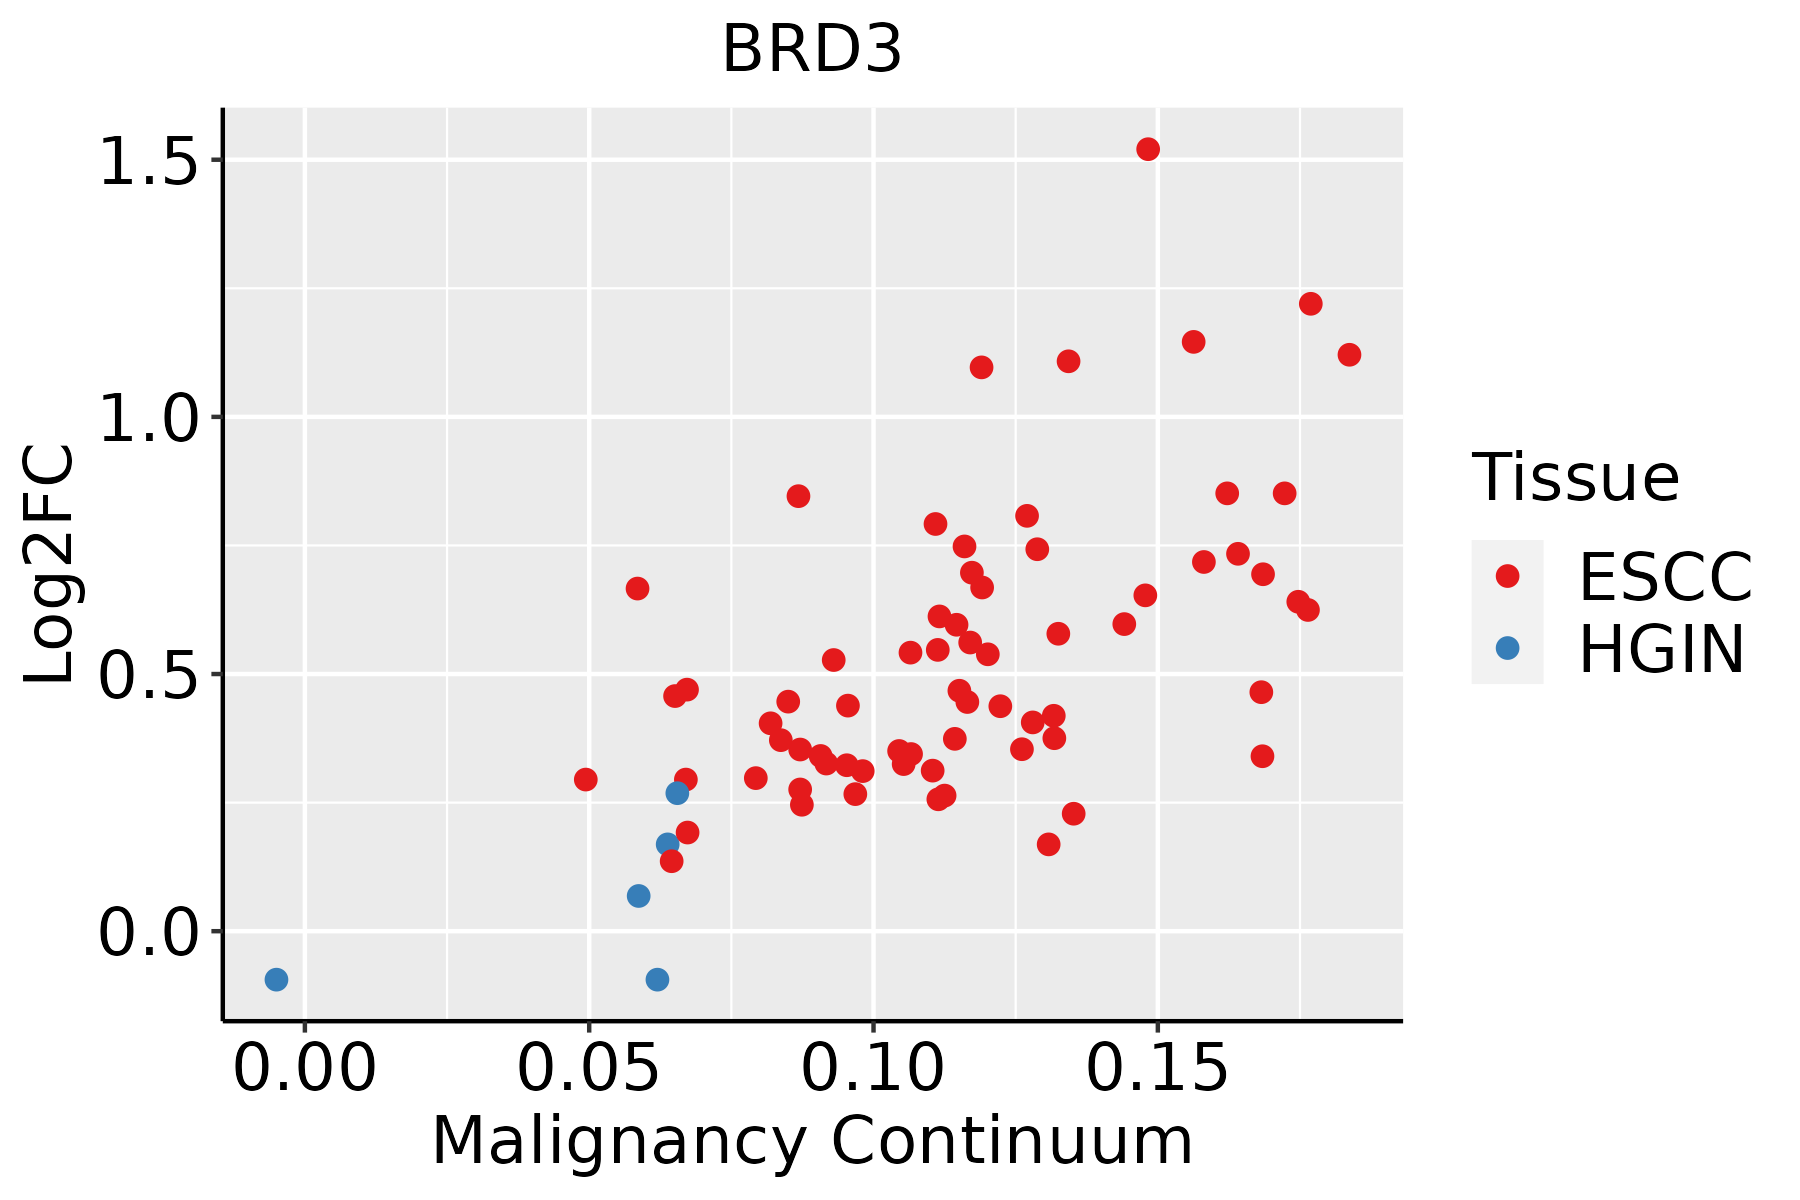 | ESCC: Esophageal squamous cell carcinoma |
| HGIN: High-grade intraepithelial neoplasias | ||
| LGIN: Low-grade intraepithelial neoplasias | ||
| Liver | 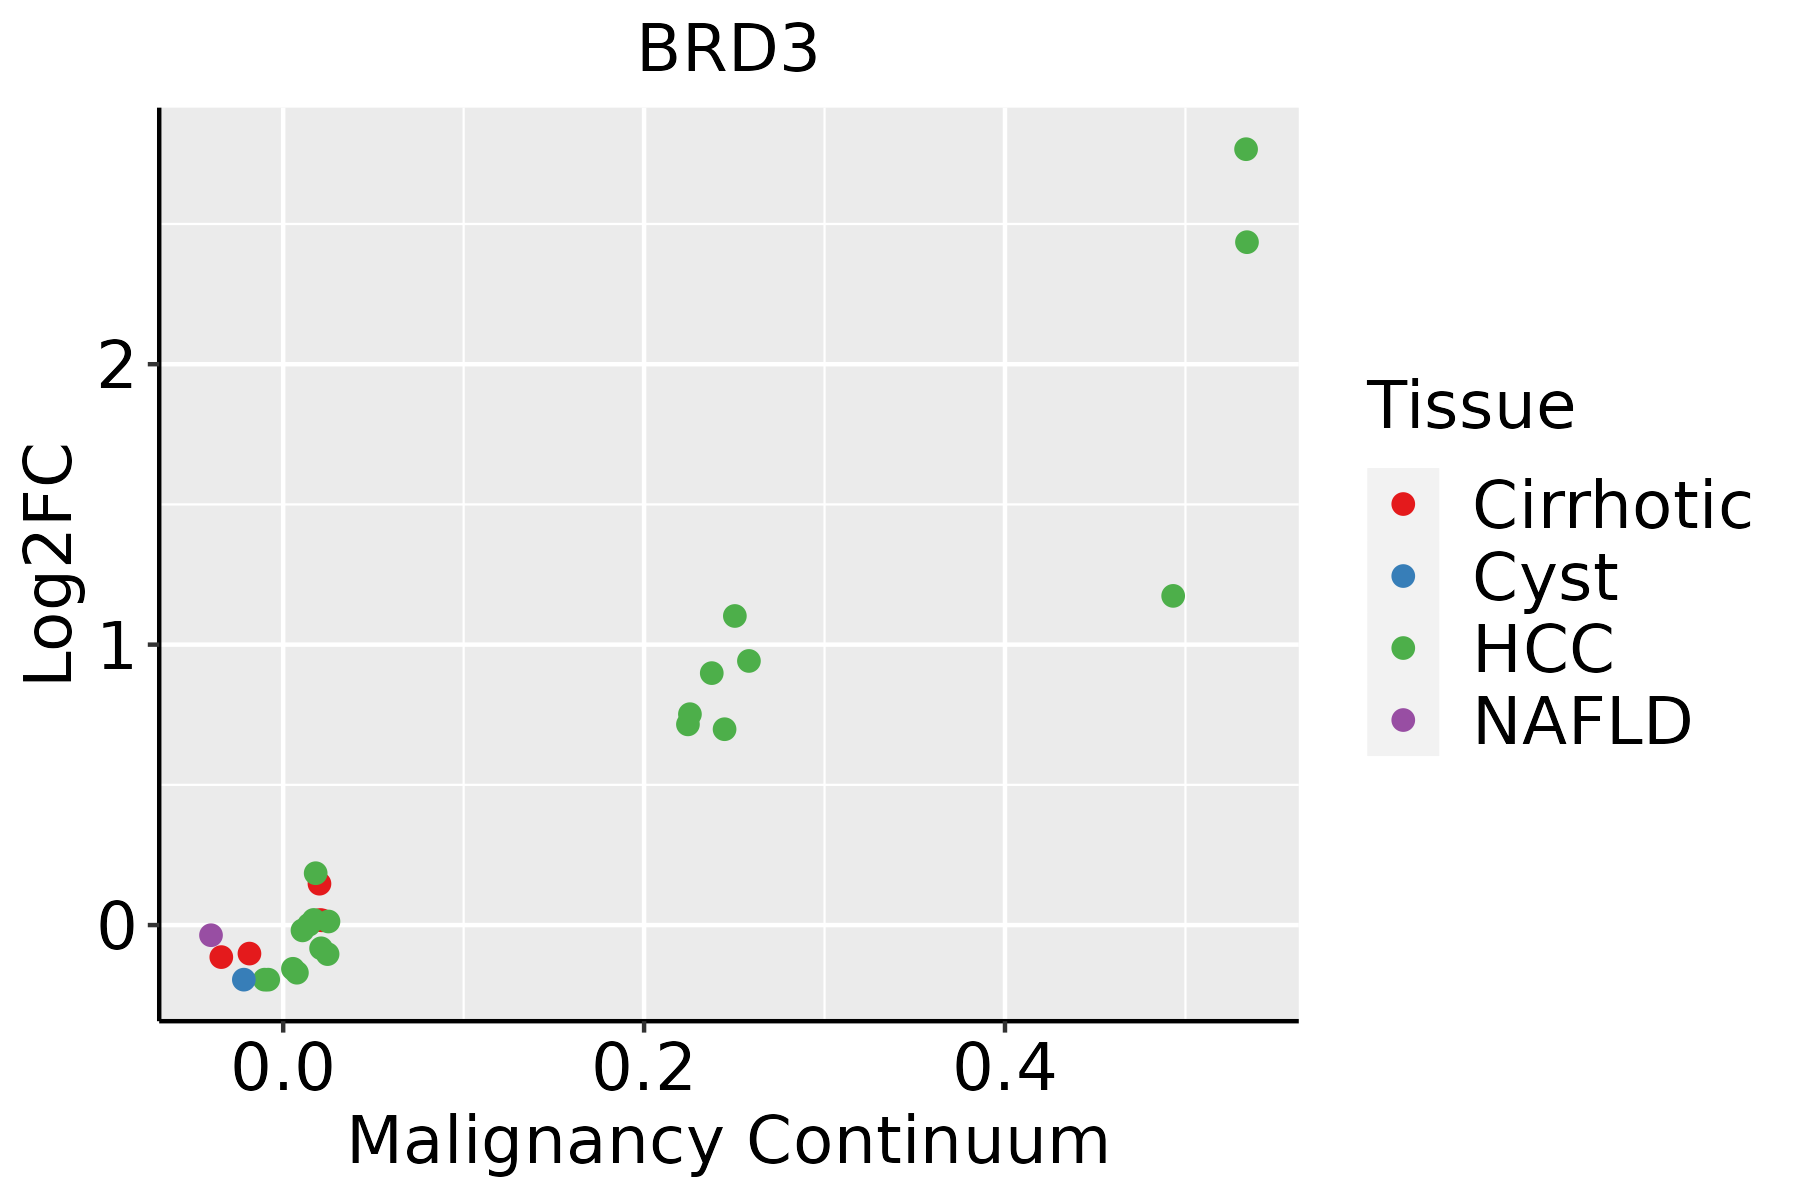 | HCC: Hepatocellular carcinoma |
| NAFLD: Non-alcoholic fatty liver disease | ||
| Oral Cavity | 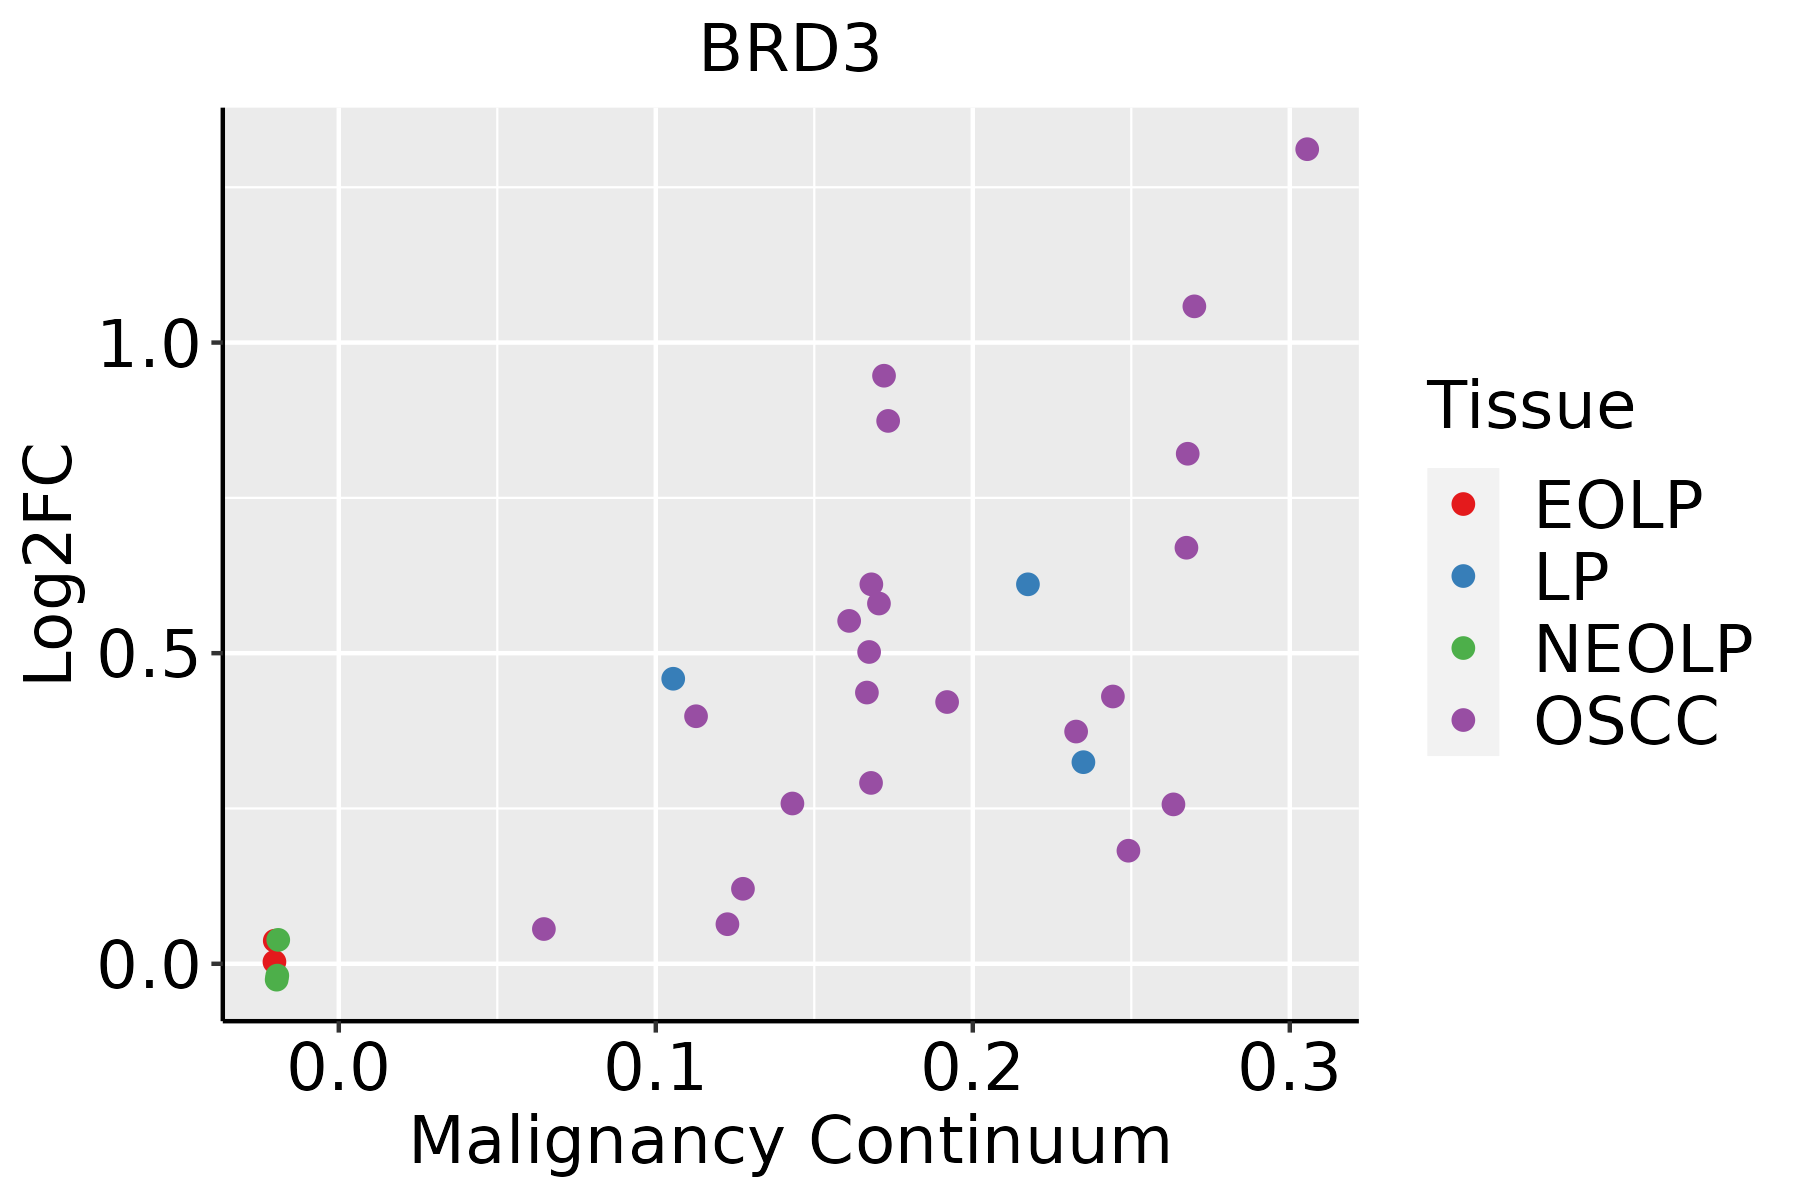 | EOLP: Erosive Oral lichen planus |
| LP: leukoplakia | ||
| NEOLP: Non-erosive oral lichen planus | ||
| OSCC: Oral squamous cell carcinoma | ||
| Prostate | 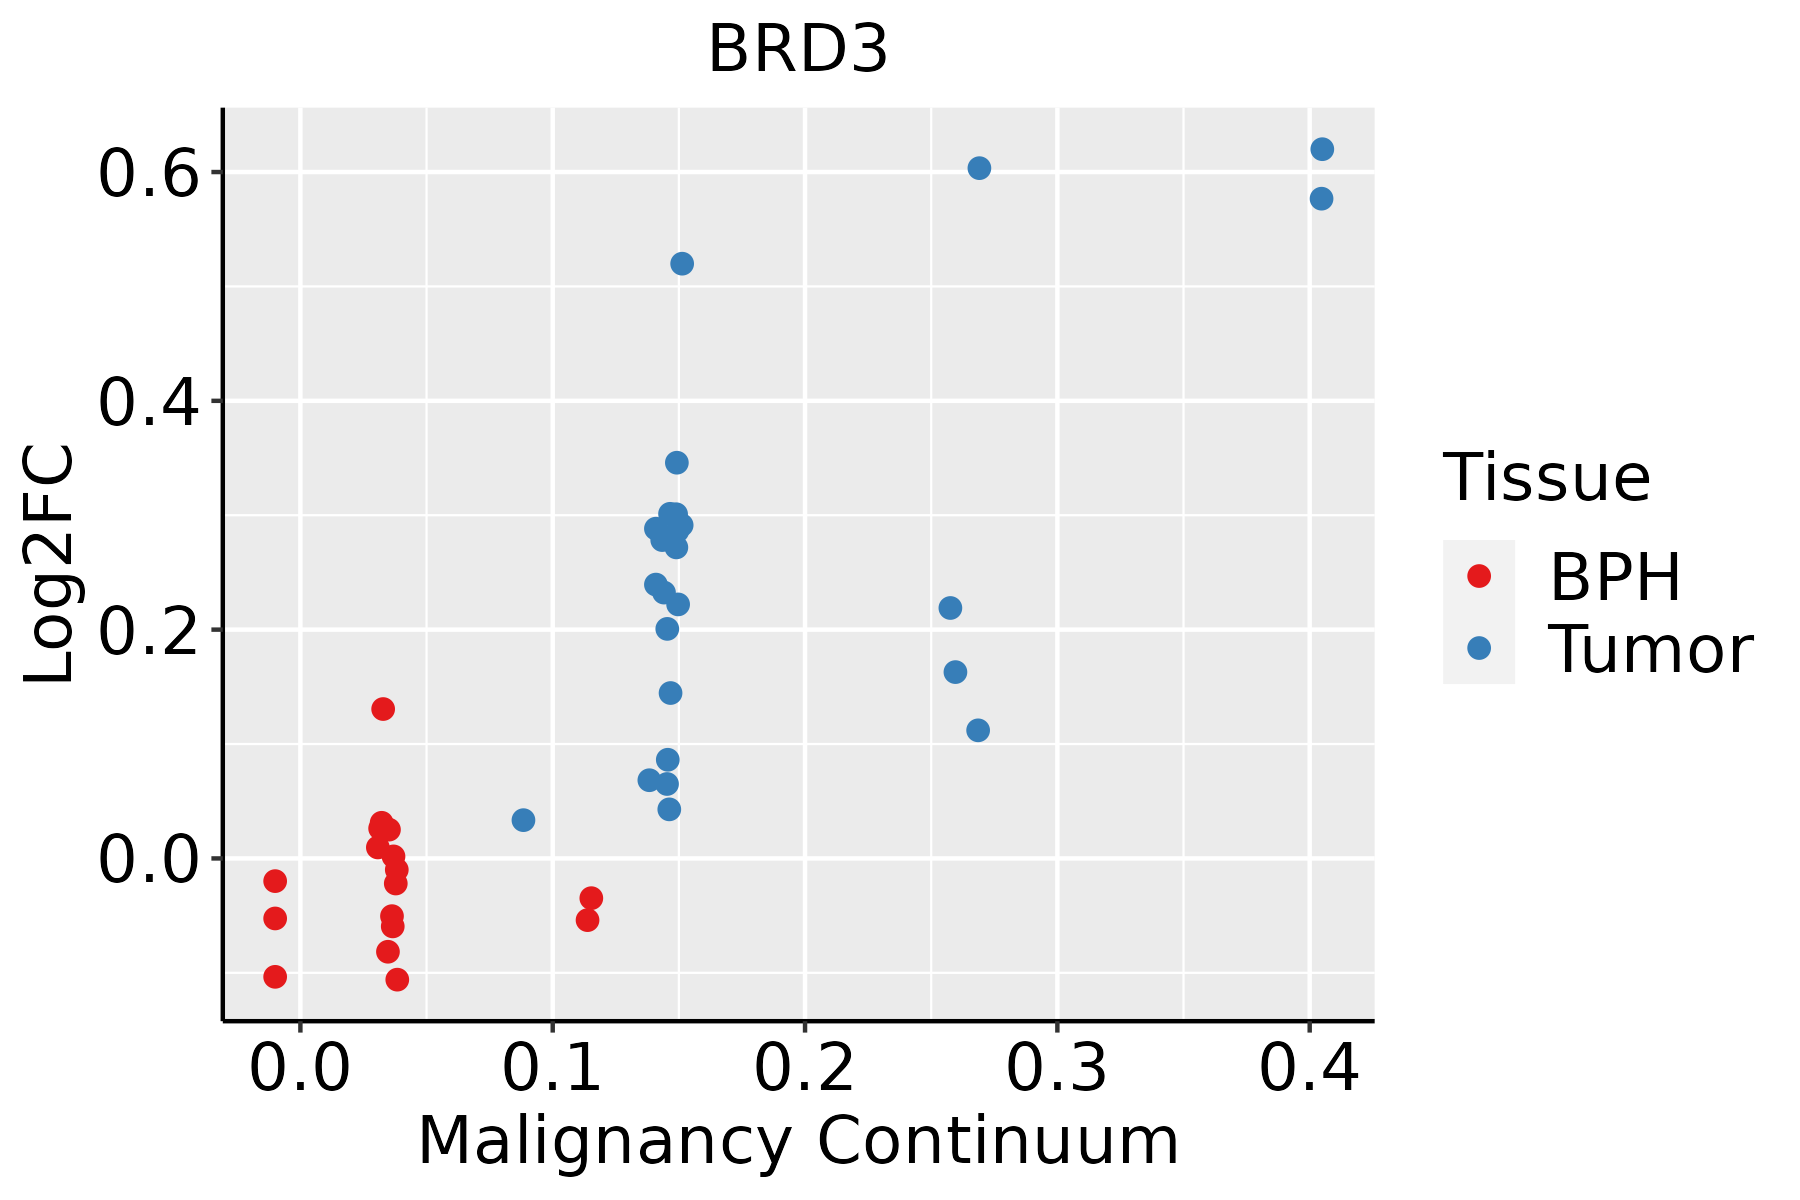 | BPH: Benign Prostatic Hyperplasia |
| Skin | 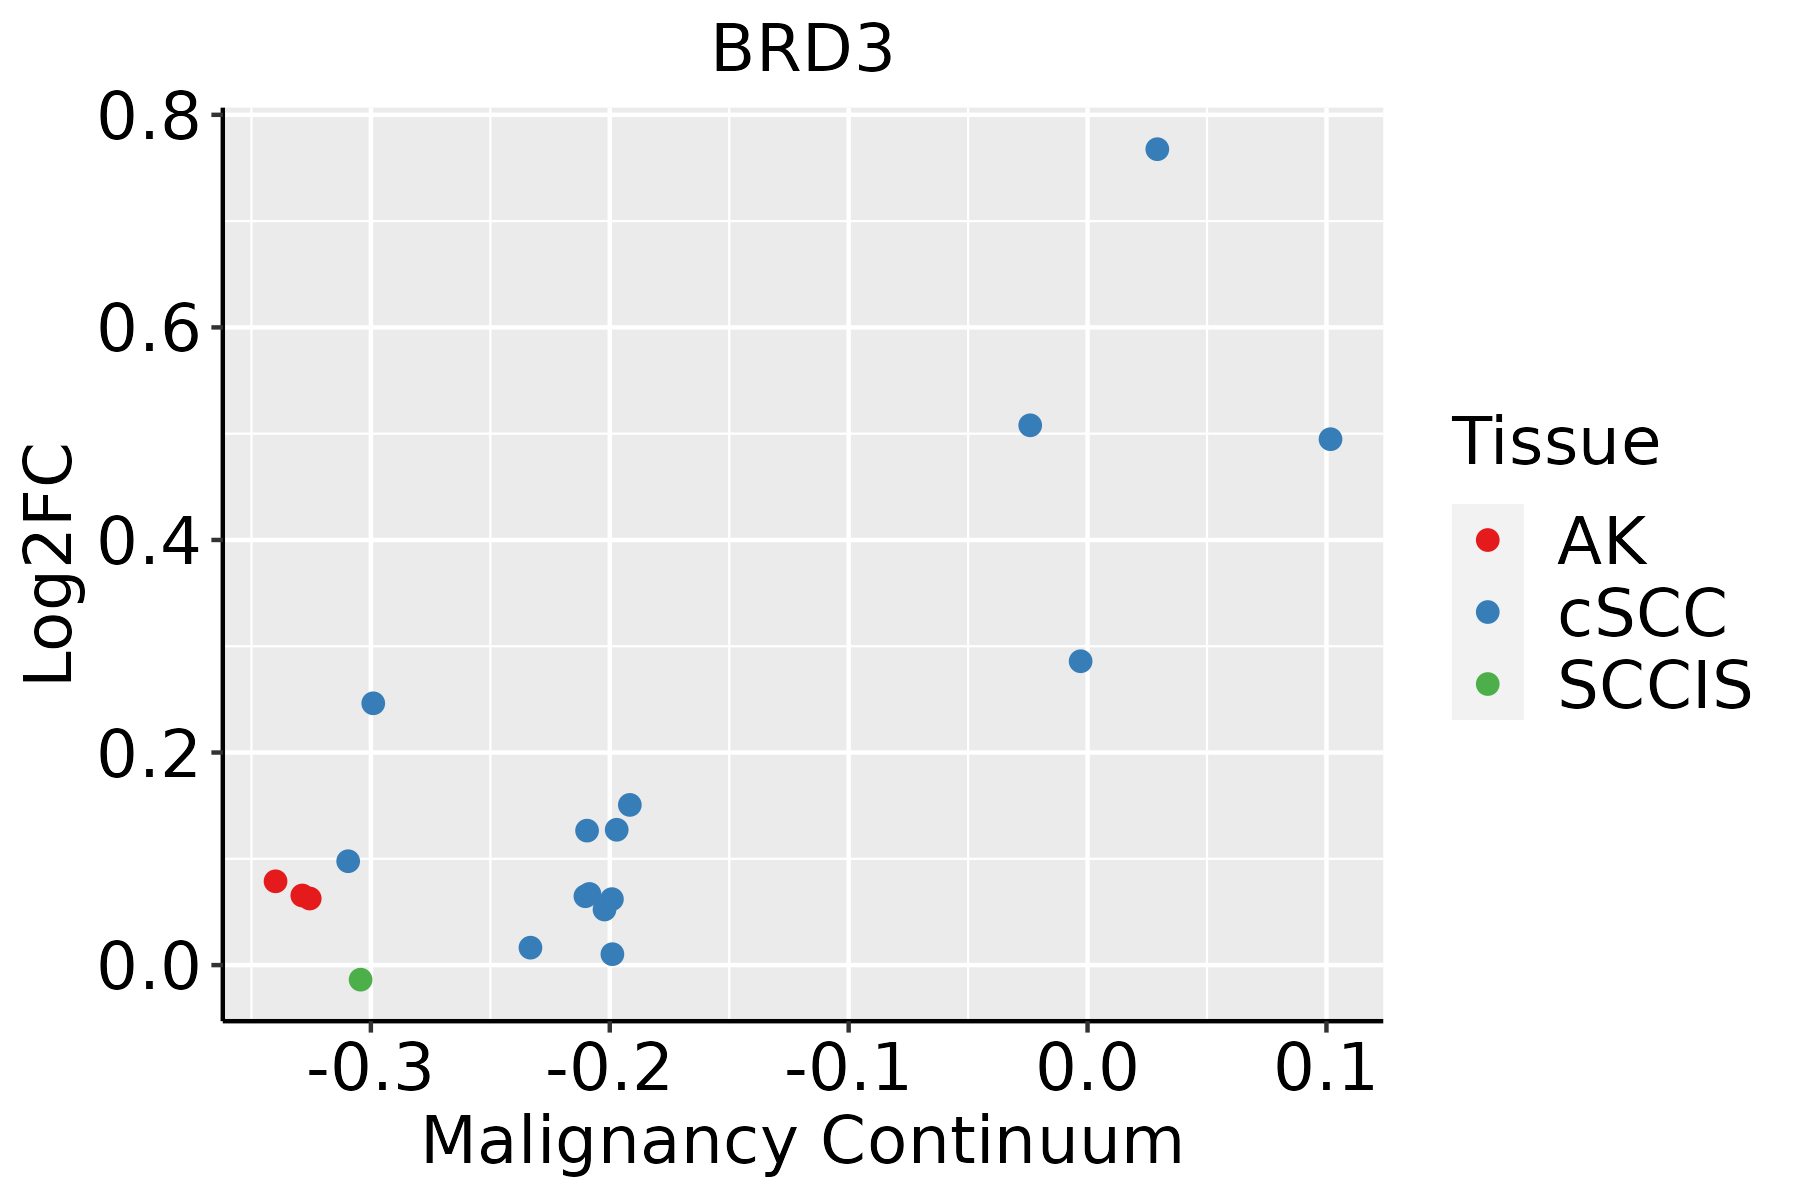 | AK: Actinic keratosis |
| cSCC: Cutaneous squamous cell carcinoma | ||
| SCCIS:squamous cell carcinoma in situ | ||
| Thyroid | 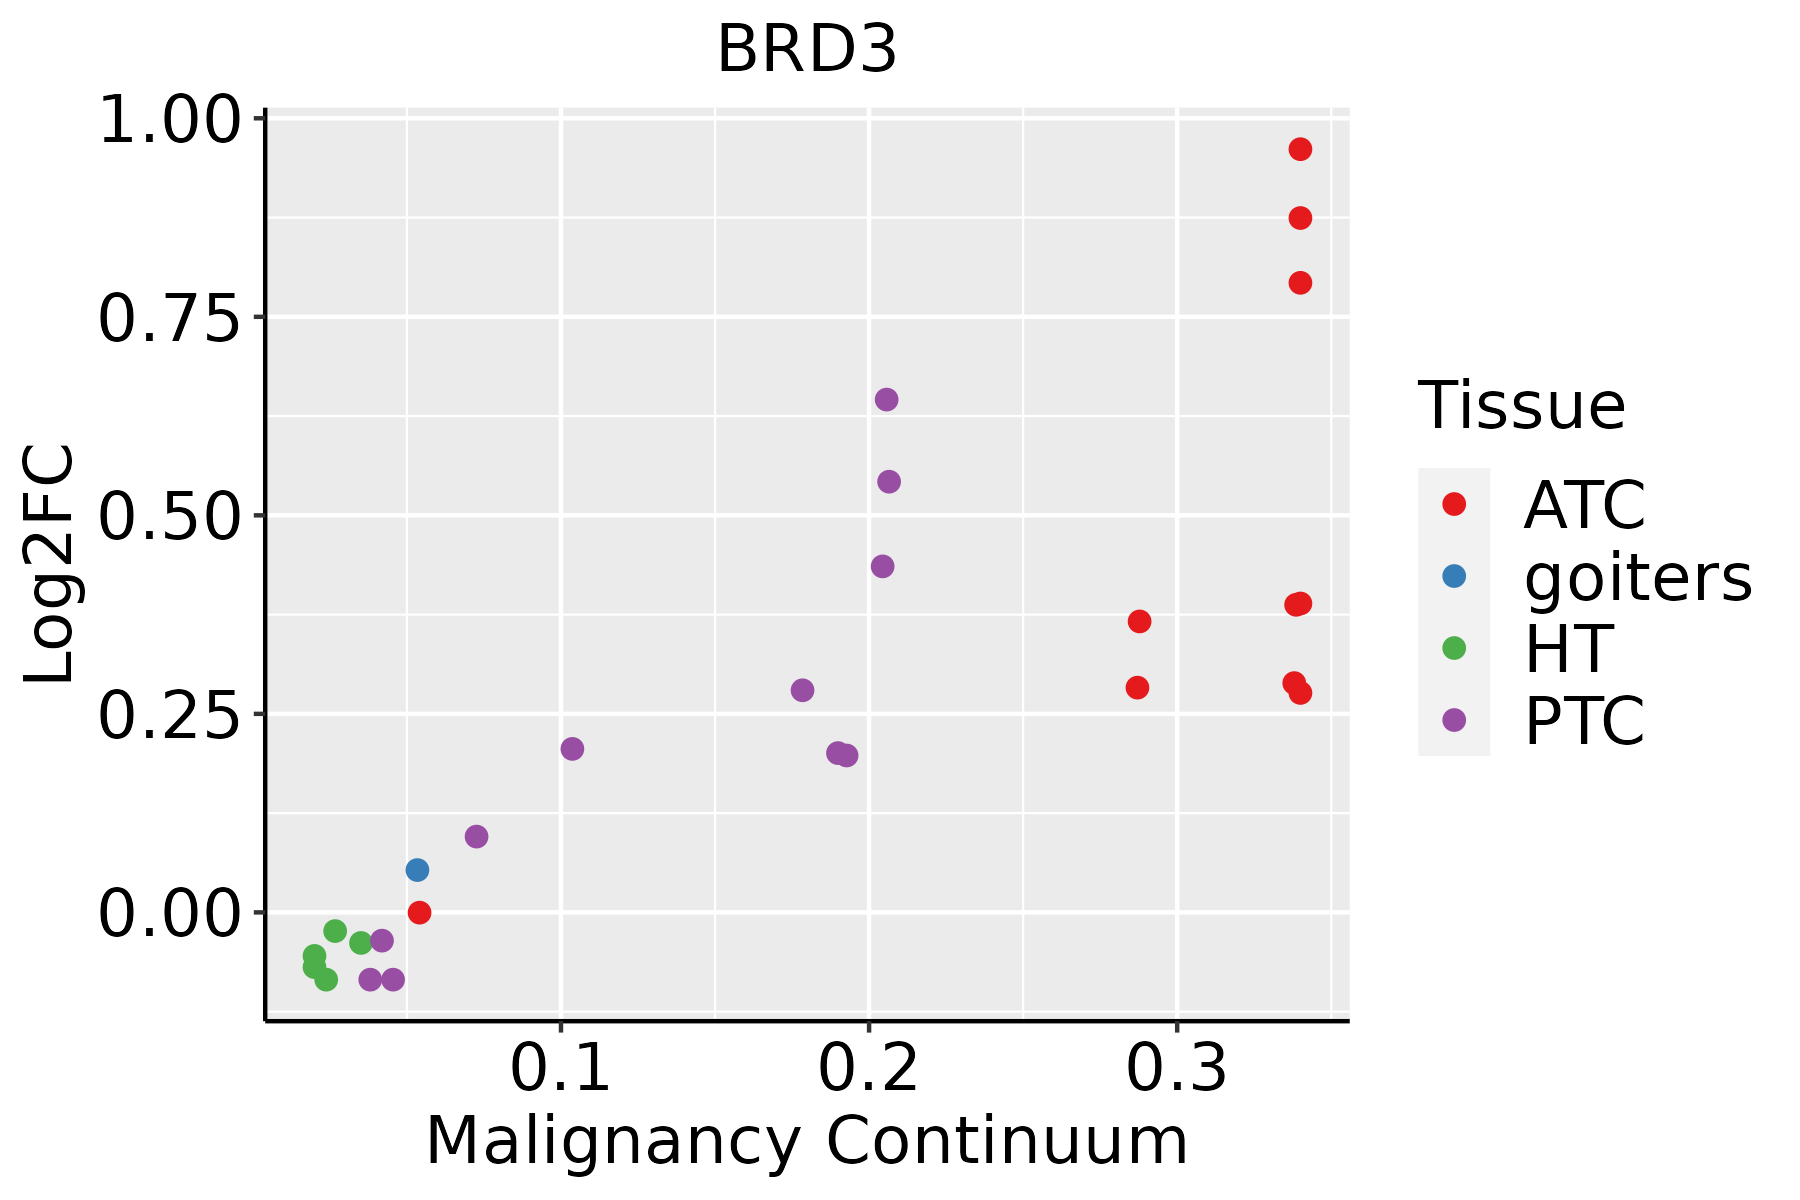 | ATC: Anaplastic thyroid cancer |
| HT: Hashimoto's thyroiditis | ||
| PTC: Papillary thyroid cancer |
| ∗log2FC in expression of this searched gene in stem-like cells from each diseased tissue sample relative to stem-like cells in normal samples in each tissue plotted against the malignancy continuum. Samples are colored based on if they are from different disease stage. |
Top |
Malignant transformation related pathway analysis |
| Find out the enriched GO biological processes and KEGG pathways involved in transition from healthy to precancer to cancer |
| Tissue | Disease Stage | Enriched GO biological Processes |
| Colorectum | AD |  |
| Colorectum | SER |  |
| Colorectum | MSS |  |
| Colorectum | MSI-H |  |
| Colorectum | FAP |  |
| ∗Top 15 enriched GO BP terms are showed in the bar plot of each disease state in each tissue. Each row represents a significant GO biological process which is colored according to the -log10(p.adjust). |
| Page: 1 2 3 4 5 6 7 8 9 |
| GO ID | Tissue | Disease Stage | Description | Gene Ratio | Bg Ratio | pvalue | p.adjust | Count |
| GO:000632517 | Esophagus | ESCC | chromatin organization | 240/8552 | 409/18723 | 6.52e-08 | 1.14e-06 | 240 |
| GO:000632511 | Liver | HCC | chromatin organization | 206/7958 | 409/18723 | 7.23e-04 | 4.41e-03 | 206 |
| GO:000632510 | Oral cavity | OSCC | chromatin organization | 190/7305 | 409/18723 | 1.17e-03 | 5.97e-03 | 190 |
| GO:000632514 | Prostate | Tumor | chromatin organization | 104/3246 | 409/18723 | 2.02e-05 | 2.62e-04 | 104 |
| GO:000632519 | Skin | cSCC | chromatin organization | 147/4864 | 409/18723 | 4.41e-06 | 6.52e-05 | 147 |
| GO:000632520 | Thyroid | PTC | chromatin organization | 183/5968 | 409/18723 | 2.55e-08 | 5.70e-07 | 183 |
| GO:0006325110 | Thyroid | ATC | chromatin organization | 189/6293 | 409/18723 | 6.40e-08 | 1.13e-06 | 189 |
| Page: 1 |
| Pathway ID | Tissue | Disease Stage | Description | Gene Ratio | Bg Ratio | pvalue | p.adjust | qvalue | Count |
| Page: 1 |
Top |
Cell-cell communication analysis |
| Identification of potential cell-cell interactions between two cell types and their ligand-receptor pairs for different disease states |
| Ligand | Receptor | LRpair | Pathway | Tissue | Disease Stage |
| Page: 1 |
Top |
Single-cell gene regulatory network inference analysis |
| Find out the significant the regulons (TFs) and the target genes of each regulon across cell types for different disease states |
| TF | Cell Type | Tissue | Disease Stage | Target Gene | RSS | Regulon Activity |
| ∗The dot plots of a searched regulon are shown for all cell subpopulations in each disease state of each tissue based on the regulon specific score inferred using pySCENIC and by calculating the average expression. |
| Page: 1 |
Top |
Somatic mutation of malignant transformation related genes |
| Annotation of somatic variants for genes involved in malignant transformation |
| Hugo Symbol | Variant Class | Variant Classification | dbSNP RS | HGVSc | HGVSp | HGVSp Short | SWISSPROT | BIOTYPE | SIFT | PolyPhen | Tumor Sample Barcode | Tissue | Histology | Sex | Age | Stage | Therapy Types | Drugs | Outcome |
| BRD3 | SNV | Missense_Mutation | rs745362189 | c.1525N>C | p.Glu509Gln | p.E509Q | Q15059 | protein_coding | tolerated(0.16) | benign(0.031) | TCGA-AC-A23H-01 | Breast | breast invasive carcinoma | Female | >=65 | I/II | Unknown | Unknown | PD |
| BRD3 | SNV | Missense_Mutation | novel | c.250N>T | p.Gly84Trp | p.G84W | Q15059 | protein_coding | deleterious(0) | probably_damaging(1) | TCGA-AN-A0G0-01 | Breast | breast invasive carcinoma | Female | <65 | I/II | Unknown | Unknown | SD |
| BRD3 | SNV | Missense_Mutation | c.68N>T | p.Pro23Leu | p.P23L | Q15059 | protein_coding | deleterious(0.02) | benign(0.293) | TCGA-D8-A1X6-01 | Breast | breast invasive carcinoma | Female | >=65 | III/IV | Hormone Therapy | tamoxiphen | SD | |
| BRD3 | insertion | Frame_Shift_Ins | novel | c.247_248insCTAAAAATACAAAAAAATTAGCCAGG | p.Met83ThrfsTer17 | p.M83Tfs*17 | Q15059 | protein_coding | TCGA-AN-A0G0-01 | Breast | breast invasive carcinoma | Female | <65 | I/II | Unknown | Unknown | SD | ||
| BRD3 | deletion | Frame_Shift_Del | rs763134487 | c.71delN | p.Pro24ArgfsTer24 | p.P24Rfs*24 | Q15059 | protein_coding | TCGA-D8-A1J8-01 | Breast | breast invasive carcinoma | Female | >=65 | I/II | Hormone Therapy | nolvadex | SD | ||
| BRD3 | SNV | Missense_Mutation | novel | c.2003N>C | p.Leu668Pro | p.L668P | Q15059 | protein_coding | deleterious(0) | probably_damaging(0.997) | TCGA-2W-A8YY-01 | Cervix | cervical & endocervical cancer | Female | <65 | I/II | Chemotherapy | cisplatin | CR |
| BRD3 | SNV | Missense_Mutation | c.985N>A | p.Ala329Thr | p.A329T | Q15059 | protein_coding | deleterious(0.01) | possibly_damaging(0.45) | TCGA-AA-3663-01 | Colorectum | colon adenocarcinoma | Male | <65 | I/II | Unknown | Unknown | SD | |
| BRD3 | SNV | Missense_Mutation | novel | c.1756C>T | p.Arg586Trp | p.R586W | Q15059 | protein_coding | deleterious(0) | probably_damaging(0.978) | TCGA-AA-3845-01 | Colorectum | colon adenocarcinoma | Female | >=65 | I/II | Unknown | Unknown | PD |
| BRD3 | SNV | Missense_Mutation | c.946N>A | p.Asp316Asn | p.D316N | Q15059 | protein_coding | tolerated(1) | benign(0) | TCGA-AZ-4315-01 | Colorectum | colon adenocarcinoma | Male | <65 | I/II | Unknown | Unknown | SD | |
| BRD3 | SNV | Missense_Mutation | novel | c.124N>G | p.Met42Val | p.M42V | Q15059 | protein_coding | deleterious(0) | probably_damaging(0.959) | TCGA-AZ-6601-01 | Colorectum | colon adenocarcinoma | Male | >=65 | I/II | Unknown | Unknown | PD |
| Page: 1 2 3 4 5 6 7 8 9 10 11 12 13 |
Top |
Related drugs of malignant transformation related genes |
| Identification of chemicals and drugs interact with genes involved in malignant transfromation |
| (DGIdb 4.0) |
| Entrez ID | Symbol | Category | Interaction Types | Drug Claim Name | Drug Name | PMIDs |
| 8019 | BRD3 | ENZYME, DRUGGABLE GENOME, CLINICALLY ACTIONABLE, KINASE, SERINE THREONINE KINASE, TRANSCRIPTION FACTOR | ABBV-744 | ABBV-744 | ||
| 8019 | BRD3 | ENZYME, DRUGGABLE GENOME, CLINICALLY ACTIONABLE, KINASE, SERINE THREONINE KINASE, TRANSCRIPTION FACTOR | ALPRAZOLAM | ALPRAZOLAM | 22137933 | |
| 8019 | BRD3 | ENZYME, DRUGGABLE GENOME, CLINICALLY ACTIONABLE, KINASE, SERINE THREONINE KINASE, TRANSCRIPTION FACTOR | PMID26924192-Compound-102 | |||
| 8019 | BRD3 | ENZYME, DRUGGABLE GENOME, CLINICALLY ACTIONABLE, KINASE, SERINE THREONINE KINASE, TRANSCRIPTION FACTOR | ESTAZOLAM | ESTAZOLAM | 22137933 | |
| 8019 | BRD3 | ENZYME, DRUGGABLE GENOME, CLINICALLY ACTIONABLE, KINASE, SERINE THREONINE KINASE, TRANSCRIPTION FACTOR | inhibitor | 252827533 | ||
| 8019 | BRD3 | ENZYME, DRUGGABLE GENOME, CLINICALLY ACTIONABLE, KINASE, SERINE THREONINE KINASE, TRANSCRIPTION FACTOR | PMID26924192-Compound-104 | |||
| 8019 | BRD3 | ENZYME, DRUGGABLE GENOME, CLINICALLY ACTIONABLE, KINASE, SERINE THREONINE KINASE, TRANSCRIPTION FACTOR | Pyrrolo-pyrrolone derivative 1 | |||
| 8019 | BRD3 | ENZYME, DRUGGABLE GENOME, CLINICALLY ACTIONABLE, KINASE, SERINE THREONINE KINASE, TRANSCRIPTION FACTOR | inhibitor | 187051822 | ||
| 8019 | BRD3 | ENZYME, DRUGGABLE GENOME, CLINICALLY ACTIONABLE, KINASE, SERINE THREONINE KINASE, TRANSCRIPTION FACTOR | L-655708 | CHEMBL52030 | 22137933 | |
| 8019 | BRD3 | ENZYME, DRUGGABLE GENOME, CLINICALLY ACTIONABLE, KINASE, SERINE THREONINE KINASE, TRANSCRIPTION FACTOR | inhibitor | 404859011 |
| Page: 1 2 3 |

Copyright 2023-Present -The University of Texas Health Science Center at Houston |