
|
|||||
|
 | |
| |
| |
| |
| |
| |
|
Gene: BRCA2 |
Gene summary for BRCA2 |
| Gene information | Species | Human | Gene symbol | BRCA2 | Gene ID | 675 |
| Gene name | BRCA2 DNA repair associated | |
| Gene Alias | BRCC2 | |
| Cytomap | 13q13.1 | |
| Gene Type | protein-coding | GO ID | GO:0000003 | UniProtAcc | P51587 |
Top |
Malignant transformation analysis |
| Identification of the aberrant gene expression in precancerous and cancerous lesions by comparing the gene expression of stem-like cells in diseased tissues with normal stem cells |
| Entrez ID | Symbol | Replicates | Species | Organ | Tissue | Adj P-value | Log2FC | Malignancy |
| 675 | BRCA2 | P2T-E | Human | Esophagus | ESCC | 2.99e-17 | 5.27e-01 | 0.1177 |
| 675 | BRCA2 | P4T-E | Human | Esophagus | ESCC | 1.71e-04 | 1.66e-01 | 0.1323 |
| 675 | BRCA2 | P8T-E | Human | Esophagus | ESCC | 1.60e-04 | 1.27e-01 | 0.0889 |
| 675 | BRCA2 | P9T-E | Human | Esophagus | ESCC | 6.70e-04 | 9.09e-02 | 0.1131 |
| 675 | BRCA2 | P12T-E | Human | Esophagus | ESCC | 3.03e-03 | 6.66e-02 | 0.1122 |
| 675 | BRCA2 | P16T-E | Human | Esophagus | ESCC | 2.44e-05 | 1.44e-01 | 0.1153 |
| 675 | BRCA2 | P17T-E | Human | Esophagus | ESCC | 2.48e-03 | 2.28e-01 | 0.1278 |
| 675 | BRCA2 | P22T-E | Human | Esophagus | ESCC | 3.04e-07 | 1.05e-01 | 0.1236 |
| 675 | BRCA2 | P23T-E | Human | Esophagus | ESCC | 2.12e-03 | 1.61e-01 | 0.108 |
| 675 | BRCA2 | P24T-E | Human | Esophagus | ESCC | 2.16e-03 | 1.82e-01 | 0.1287 |
| 675 | BRCA2 | P27T-E | Human | Esophagus | ESCC | 8.79e-03 | 1.15e-01 | 0.1055 |
| 675 | BRCA2 | P28T-E | Human | Esophagus | ESCC | 7.18e-12 | 3.10e-01 | 0.1149 |
| 675 | BRCA2 | P31T-E | Human | Esophagus | ESCC | 3.46e-06 | 1.60e-01 | 0.1251 |
| 675 | BRCA2 | P32T-E | Human | Esophagus | ESCC | 2.60e-07 | 2.26e-01 | 0.1666 |
| 675 | BRCA2 | P36T-E | Human | Esophagus | ESCC | 2.41e-02 | 1.98e-01 | 0.1187 |
| 675 | BRCA2 | P37T-E | Human | Esophagus | ESCC | 3.48e-04 | 1.54e-01 | 0.1371 |
| 675 | BRCA2 | P42T-E | Human | Esophagus | ESCC | 2.03e-02 | 1.75e-01 | 0.1175 |
| 675 | BRCA2 | P44T-E | Human | Esophagus | ESCC | 3.96e-02 | 1.19e-01 | 0.1096 |
| 675 | BRCA2 | P47T-E | Human | Esophagus | ESCC | 8.54e-04 | 7.95e-02 | 0.1067 |
| 675 | BRCA2 | P52T-E | Human | Esophagus | ESCC | 1.15e-06 | 1.37e-01 | 0.1555 |
| Page: 1 2 |
| Tissue | Expression Dynamics | Abbreviation |
| Esophagus |  | ESCC: Esophageal squamous cell carcinoma |
| HGIN: High-grade intraepithelial neoplasias | ||
| LGIN: Low-grade intraepithelial neoplasias | ||
| Thyroid | 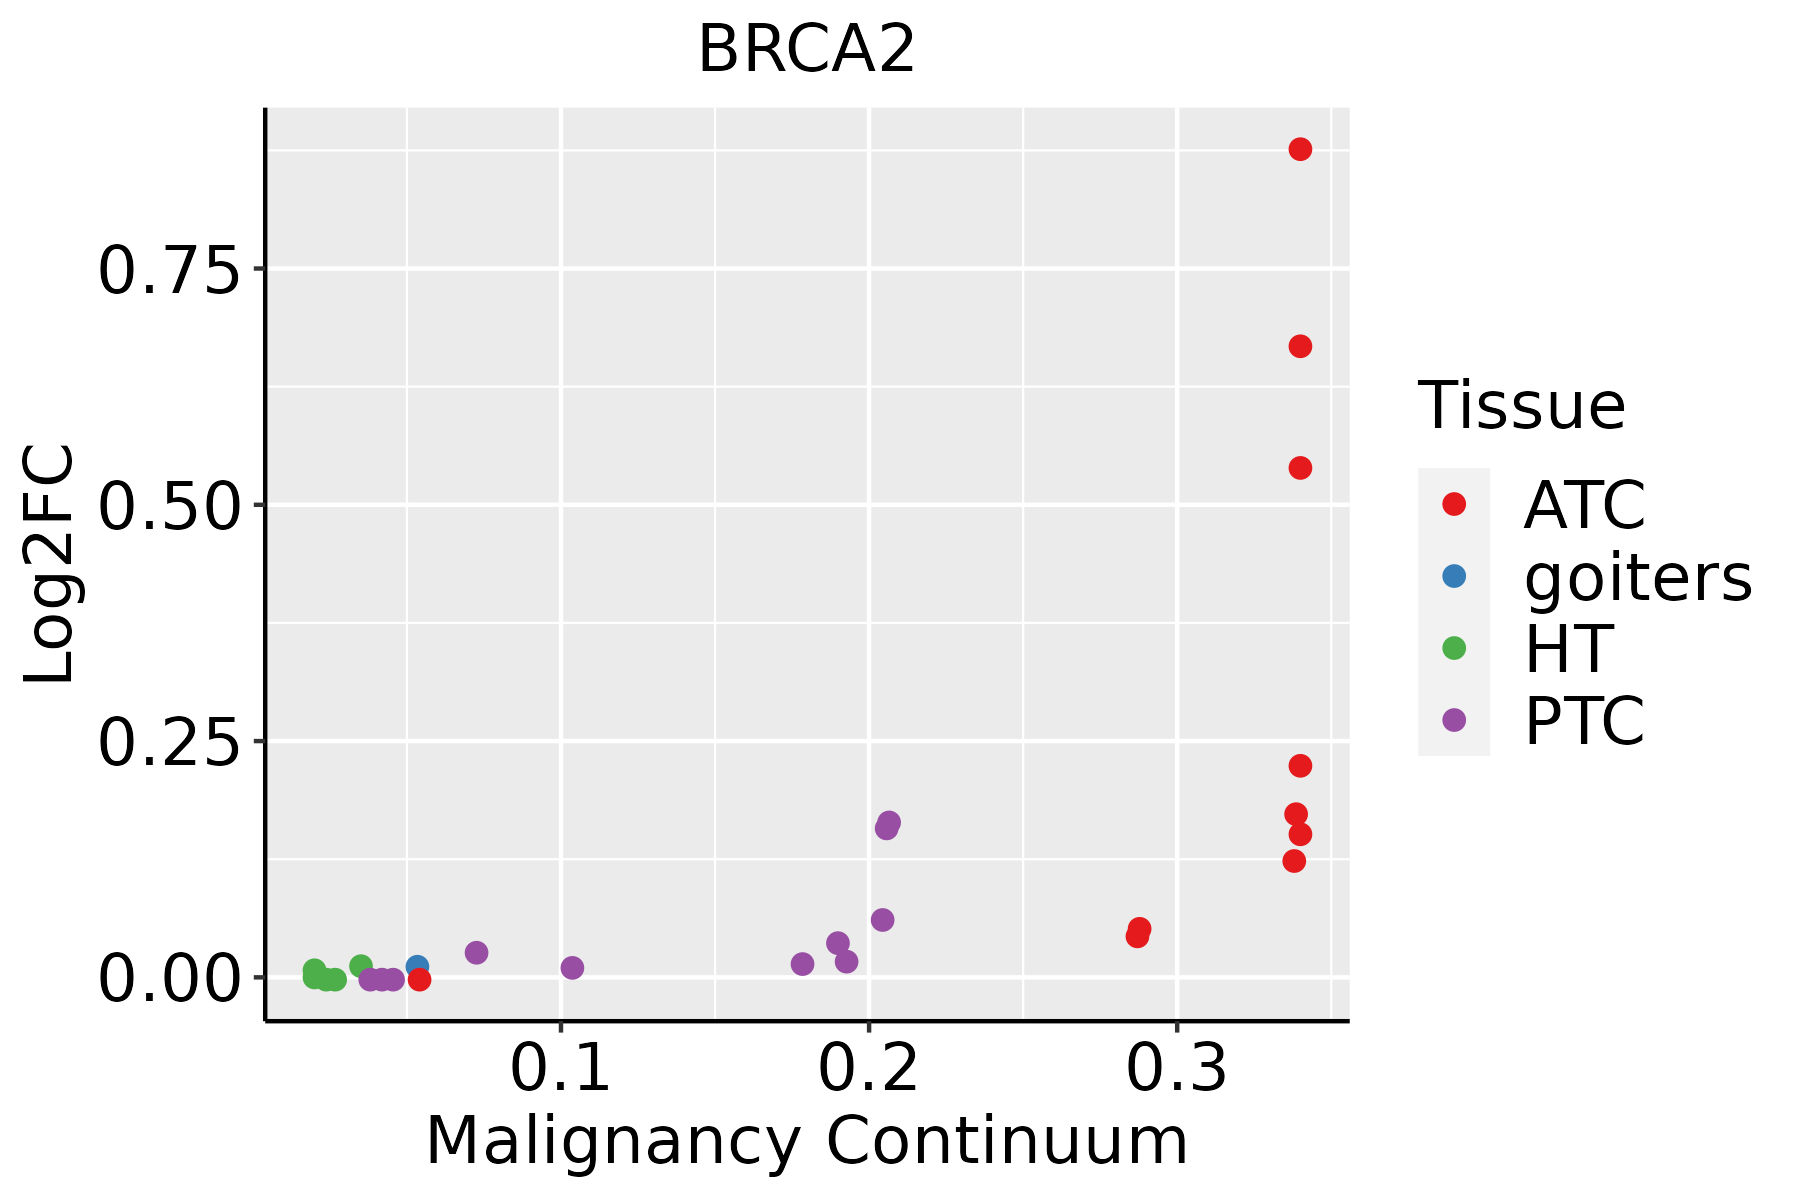 | ATC: Anaplastic thyroid cancer |
| HT: Hashimoto's thyroiditis | ||
| PTC: Papillary thyroid cancer |
| ∗log2FC in expression of this searched gene in stem-like cells from each diseased tissue sample relative to stem-like cells in normal samples in each tissue plotted against the malignancy continuum. Samples are colored based on if they are from different disease stage. |
Top |
Malignant transformation related pathway analysis |
| Find out the enriched GO biological processes and KEGG pathways involved in transition from healthy to precancer to cancer |
| Tissue | Disease Stage | Enriched GO biological Processes |
| Colorectum | AD |  |
| Colorectum | SER |  |
| Colorectum | MSS |  |
| Colorectum | MSI-H |  |
| Colorectum | FAP |  |
| ∗Top 15 enriched GO BP terms are showed in the bar plot of each disease state in each tissue. Each row represents a significant GO biological process which is colored according to the -log10(p.adjust). |
| Page: 1 2 3 4 5 6 7 8 9 |
| GO ID | Tissue | Disease Stage | Description | Gene Ratio | Bg Ratio | pvalue | p.adjust | Count |
| GO:0072594110 | Esophagus | ESCC | establishment of protein localization to organelle | 311/8552 | 422/18723 | 3.02e-32 | 2.13e-29 | 311 |
| GO:0097193111 | Esophagus | ESCC | intrinsic apoptotic signaling pathway | 222/8552 | 288/18723 | 5.87e-28 | 2.02e-25 | 222 |
| GO:001657015 | Esophagus | ESCC | histone modification | 323/8552 | 463/18723 | 2.61e-26 | 7.88e-24 | 323 |
| GO:001820514 | Esophagus | ESCC | peptidyl-lysine modification | 259/8552 | 376/18723 | 3.90e-20 | 5.26e-18 | 259 |
| GO:000734615 | Esophagus | ESCC | regulation of mitotic cell cycle | 293/8552 | 457/18723 | 8.00e-16 | 5.64e-14 | 293 |
| GO:000170119 | Esophagus | ESCC | in utero embryonic development | 243/8552 | 367/18723 | 1.00e-15 | 6.86e-14 | 243 |
| GO:000941113 | Esophagus | ESCC | response to UV | 115/8552 | 149/18723 | 3.29e-15 | 1.93e-13 | 115 |
| GO:00062604 | Esophagus | ESCC | DNA replication | 181/8552 | 260/18723 | 3.55e-15 | 2.05e-13 | 181 |
| GO:0072331111 | Esophagus | ESCC | signal transduction by p53 class mediator | 121/8552 | 163/18723 | 9.61e-14 | 4.69e-12 | 121 |
| GO:00482853 | Esophagus | ESCC | organelle fission | 301/8552 | 488/18723 | 4.64e-13 | 2.12e-11 | 301 |
| GO:001839413 | Esophagus | ESCC | peptidyl-lysine acetylation | 123/8552 | 169/18723 | 6.58e-13 | 2.94e-11 | 123 |
| GO:001021217 | Esophagus | ESCC | response to ionizing radiation | 110/8552 | 148/18723 | 1.11e-12 | 4.78e-11 | 110 |
| GO:004354313 | Esophagus | ESCC | protein acylation | 165/8552 | 243/18723 | 1.69e-12 | 7.14e-11 | 165 |
| GO:000072319 | Esophagus | ESCC | telomere maintenance | 99/8552 | 131/18723 | 2.68e-12 | 1.08e-10 | 99 |
| GO:000647313 | Esophagus | ESCC | protein acetylation | 140/8552 | 201/18723 | 4.37e-12 | 1.69e-10 | 140 |
| GO:0048732111 | Esophagus | ESCC | gland development | 269/8552 | 436/18723 | 7.81e-12 | 2.95e-10 | 269 |
| GO:001839313 | Esophagus | ESCC | internal peptidyl-lysine acetylation | 114/8552 | 158/18723 | 1.16e-11 | 4.24e-10 | 114 |
| GO:00002802 | Esophagus | ESCC | nuclear division | 270/8552 | 439/18723 | 1.17e-11 | 4.24e-10 | 270 |
| GO:000647513 | Esophagus | ESCC | internal protein amino acid acetylation | 115/8552 | 160/18723 | 1.43e-11 | 5.08e-10 | 115 |
| GO:0008630110 | Esophagus | ESCC | intrinsic apoptotic signaling pathway in response to DNA damage | 78/8552 | 99/18723 | 1.43e-11 | 5.08e-10 | 78 |
| Page: 1 2 3 4 5 6 7 8 9 |
| Pathway ID | Tissue | Disease Stage | Description | Gene Ratio | Bg Ratio | pvalue | p.adjust | qvalue | Count |
| Page: 1 |
Top |
Cell-cell communication analysis |
| Identification of potential cell-cell interactions between two cell types and their ligand-receptor pairs for different disease states |
| Ligand | Receptor | LRpair | Pathway | Tissue | Disease Stage |
| Page: 1 |
Top |
Single-cell gene regulatory network inference analysis |
| Find out the significant the regulons (TFs) and the target genes of each regulon across cell types for different disease states |
| TF | Cell Type | Tissue | Disease Stage | Target Gene | RSS | Regulon Activity |
| ∗The dot plots of a searched regulon are shown for all cell subpopulations in each disease state of each tissue based on the regulon specific score inferred using pySCENIC and by calculating the average expression. |
| Page: 1 |
Top |
Somatic mutation of malignant transformation related genes |
| Annotation of somatic variants for genes involved in malignant transformation |
| Hugo Symbol | Variant Class | Variant Classification | dbSNP RS | HGVSc | HGVSp | HGVSp Short | SWISSPROT | BIOTYPE | SIFT | PolyPhen | Tumor Sample Barcode | Tissue | Histology | Sex | Age | Stage | Therapy Types | Drugs | Outcome |
| BRCA2 | SNV | Missense_Mutation | rs80359233 | c.9616N>G | p.Gln3206Glu | p.Q3206E | P51587 | protein_coding | tolerated(0.16) | benign(0.417) | TCGA-A2-A04P-01 | Breast | breast invasive carcinoma | Female | <65 | III/IV | Chemotherapy | taxol | PD |
| BRCA2 | SNV | Missense_Mutation | c.4063N>T | p.Asp1355Tyr | p.D1355Y | P51587 | protein_coding | deleterious(0.04) | possibly_damaging(0.452) | TCGA-A8-A07I-01 | Breast | breast invasive carcinoma | Female | >=65 | III/IV | Chemotherapy | 5-fluorouracil | CR | |
| BRCA2 | SNV | Missense_Mutation | c.9523N>A | p.Glu3175Lys | p.E3175K | P51587 | protein_coding | deleterious(0.02) | benign(0.16) | TCGA-A8-A0A7-01 | Breast | breast invasive carcinoma | Female | <65 | I/II | Unknown | Unknown | SD | |
| BRCA2 | SNV | Missense_Mutation | c.2059N>C | p.Asp687His | p.D687H | P51587 | protein_coding | tolerated(0.06) | possibly_damaging(0.789) | TCGA-AC-A23H-01 | Breast | breast invasive carcinoma | Female | >=65 | I/II | Unknown | Unknown | PD | |
| BRCA2 | SNV | Missense_Mutation | rs780279081 | c.3097N>C | p.Asp1033His | p.D1033H | P51587 | protein_coding | deleterious(0) | probably_damaging(1) | TCGA-AC-A23H-01 | Breast | breast invasive carcinoma | Female | >=65 | I/II | Unknown | Unknown | PD |
| BRCA2 | SNV | Missense_Mutation | novel | c.2954N>T | p.Lys985Ile | p.K985I | P51587 | protein_coding | tolerated(0.07) | probably_damaging(0.921) | TCGA-AN-A046-01 | Breast | breast invasive carcinoma | Female | >=65 | I/II | Unknown | Unknown | SD |
| BRCA2 | SNV | Missense_Mutation | rs28897761 | c.10024N>A | p.Glu3342Lys | p.E3342K | P51587 | protein_coding | deleterious(0) | probably_damaging(0.996) | TCGA-AN-A046-01 | Breast | breast invasive carcinoma | Female | >=65 | I/II | Unknown | Unknown | SD |
| BRCA2 | SNV | Missense_Mutation | c.7948N>C | p.Glu2650Gln | p.E2650Q | P51587 | protein_coding | deleterious(0) | probably_damaging(0.995) | TCGA-AN-A0AT-01 | Breast | breast invasive carcinoma | Female | <65 | I/II | Unknown | Unknown | SD | |
| BRCA2 | SNV | Missense_Mutation | c.1579N>A | p.Pro527Thr | p.P527T | P51587 | protein_coding | tolerated(0.19) | benign(0.061) | TCGA-AN-A0XW-01 | Breast | breast invasive carcinoma | Female | <65 | III/IV | Unknown | Unknown | SD | |
| BRCA2 | SNV | Missense_Mutation | c.9911G>C | p.Cys3304Ser | p.C3304S | P51587 | protein_coding | tolerated(0.09) | possibly_damaging(0.742) | TCGA-AO-A124-01 | Breast | breast invasive carcinoma | Female | <65 | I/II | Chemotherapy | doxorubicin | SD |
| Page: 1 2 3 4 5 6 7 8 9 10 11 12 13 14 15 16 17 18 19 20 21 22 23 24 25 26 27 28 29 30 31 32 33 34 35 36 37 38 39 40 41 |
Top |
Related drugs of malignant transformation related genes |
| Identification of chemicals and drugs interact with genes involved in malignant transfromation |
| (DGIdb 4.0) |
| Entrez ID | Symbol | Category | Interaction Types | Drug Claim Name | Drug Name | PMIDs |
| 675 | BRCA2 | CLINICALLY ACTIONABLE | Talazoparib | TALAZOPARIB | ||
| 675 | BRCA2 | CLINICALLY ACTIONABLE | Niraparib | NIRAPARIB | ||
| 675 | BRCA2 | CLINICALLY ACTIONABLE | RUCAPARIB | RUCAPARIB | ||
| 675 | BRCA2 | CLINICALLY ACTIONABLE | Niraparib | NIRAPARIB | 27717299 | |
| 675 | BRCA2 | CLINICALLY ACTIONABLE | Etoposide | ETOPOSIDE | 26116172 | |
| 675 | BRCA2 | CLINICALLY ACTIONABLE | KU-0063794 | 26546619 | ||
| 675 | BRCA2 | CLINICALLY ACTIONABLE | niraparib | NIRAPARIB | ||
| 675 | BRCA2 | CLINICALLY ACTIONABLE | PR-104 | PR-104 | 25193512 | |
| 675 | BRCA2 | CLINICALLY ACTIONABLE | talazoparib | TALAZOPARIB | ||
| 675 | BRCA2 | CLINICALLY ACTIONABLE | YU238259 | 26116172 |
| Page: 1 2 3 4 5 6 |

Copyright 2023-Present -The University of Texas Health Science Center at Houston |