| Tissue | Expression Dynamics | Abbreviation |
| Colorectum (GSE201348) |  | FAP: Familial adenomatous polyposis |
| CRC: Colorectal cancer |
| Colorectum (HTA11) | 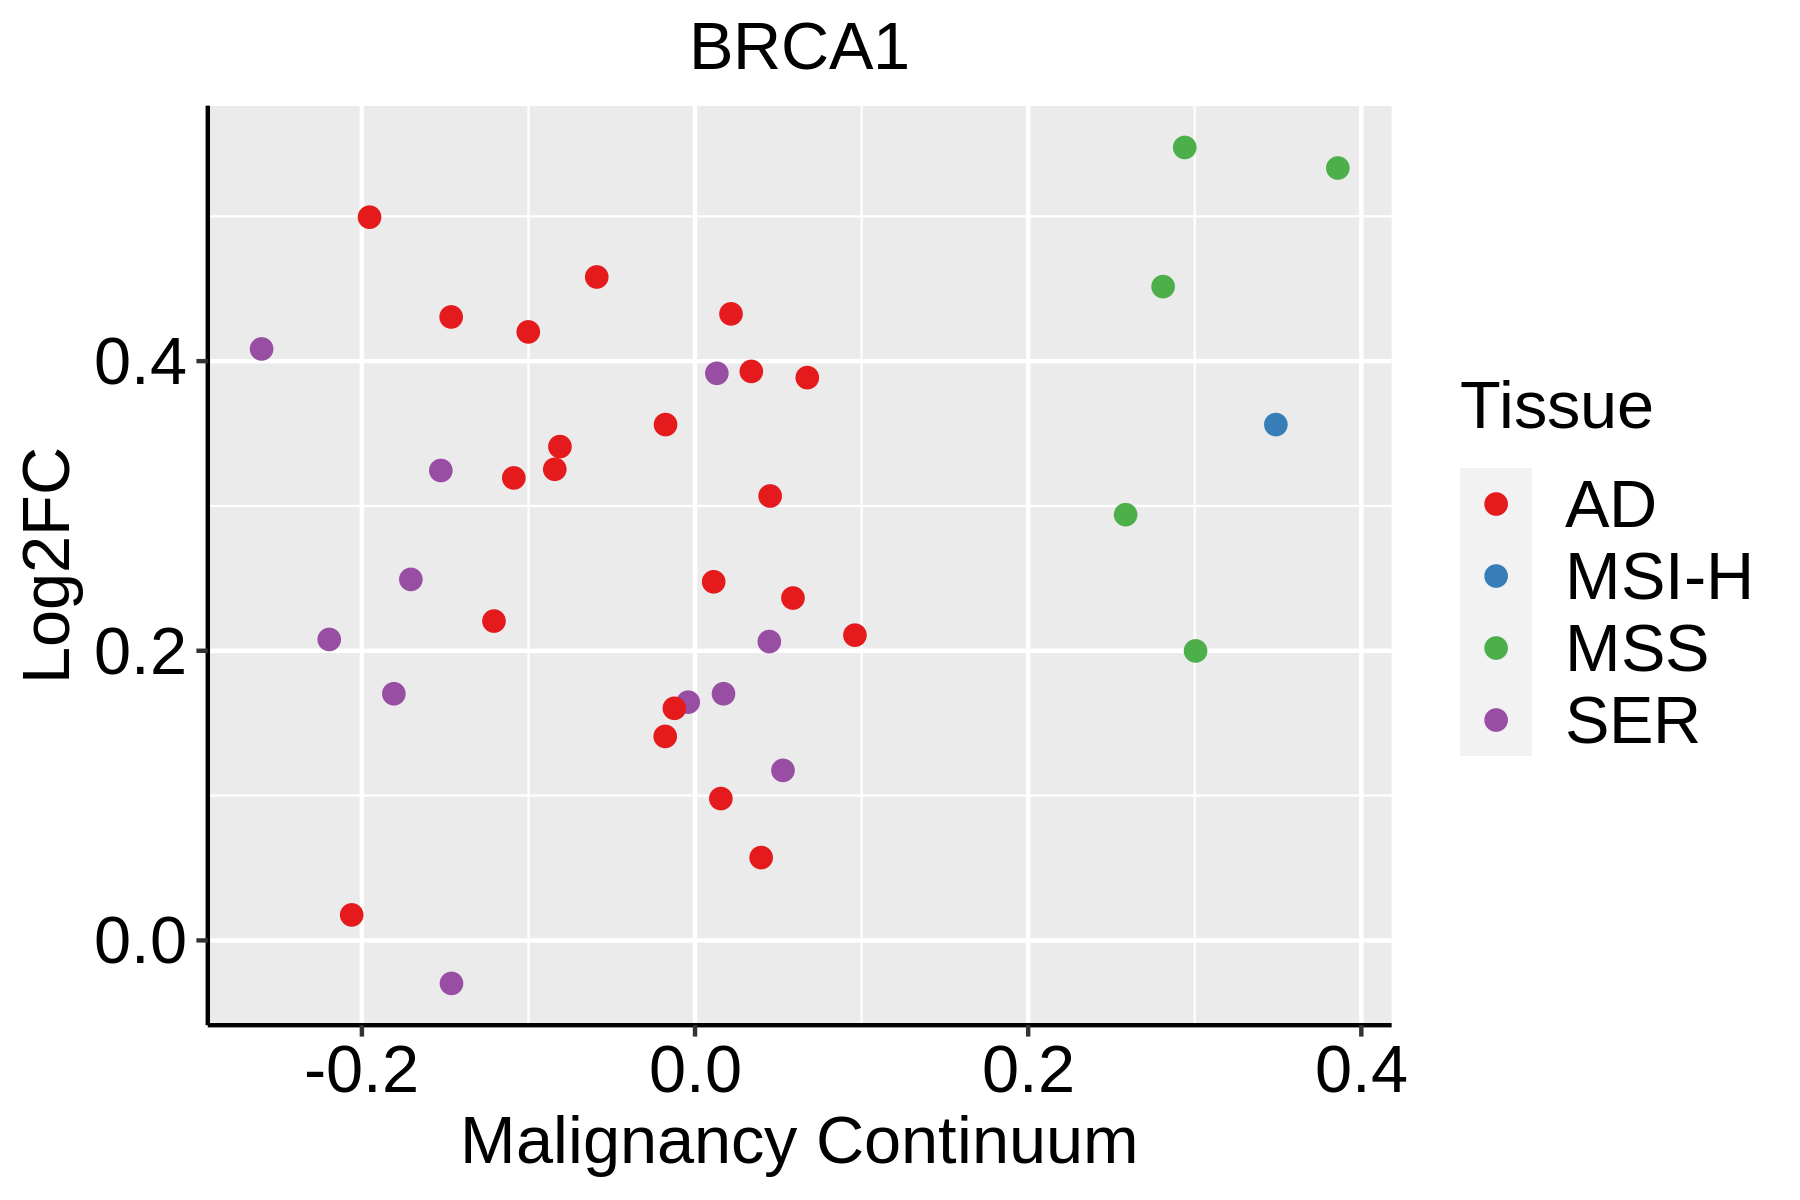 | AD: Adenomas |
| SER: Sessile serrated lesions |
| MSI-H: Microsatellite-high colorectal cancer |
| MSS: Microsatellite stable colorectal cancer |
| Esophagus | 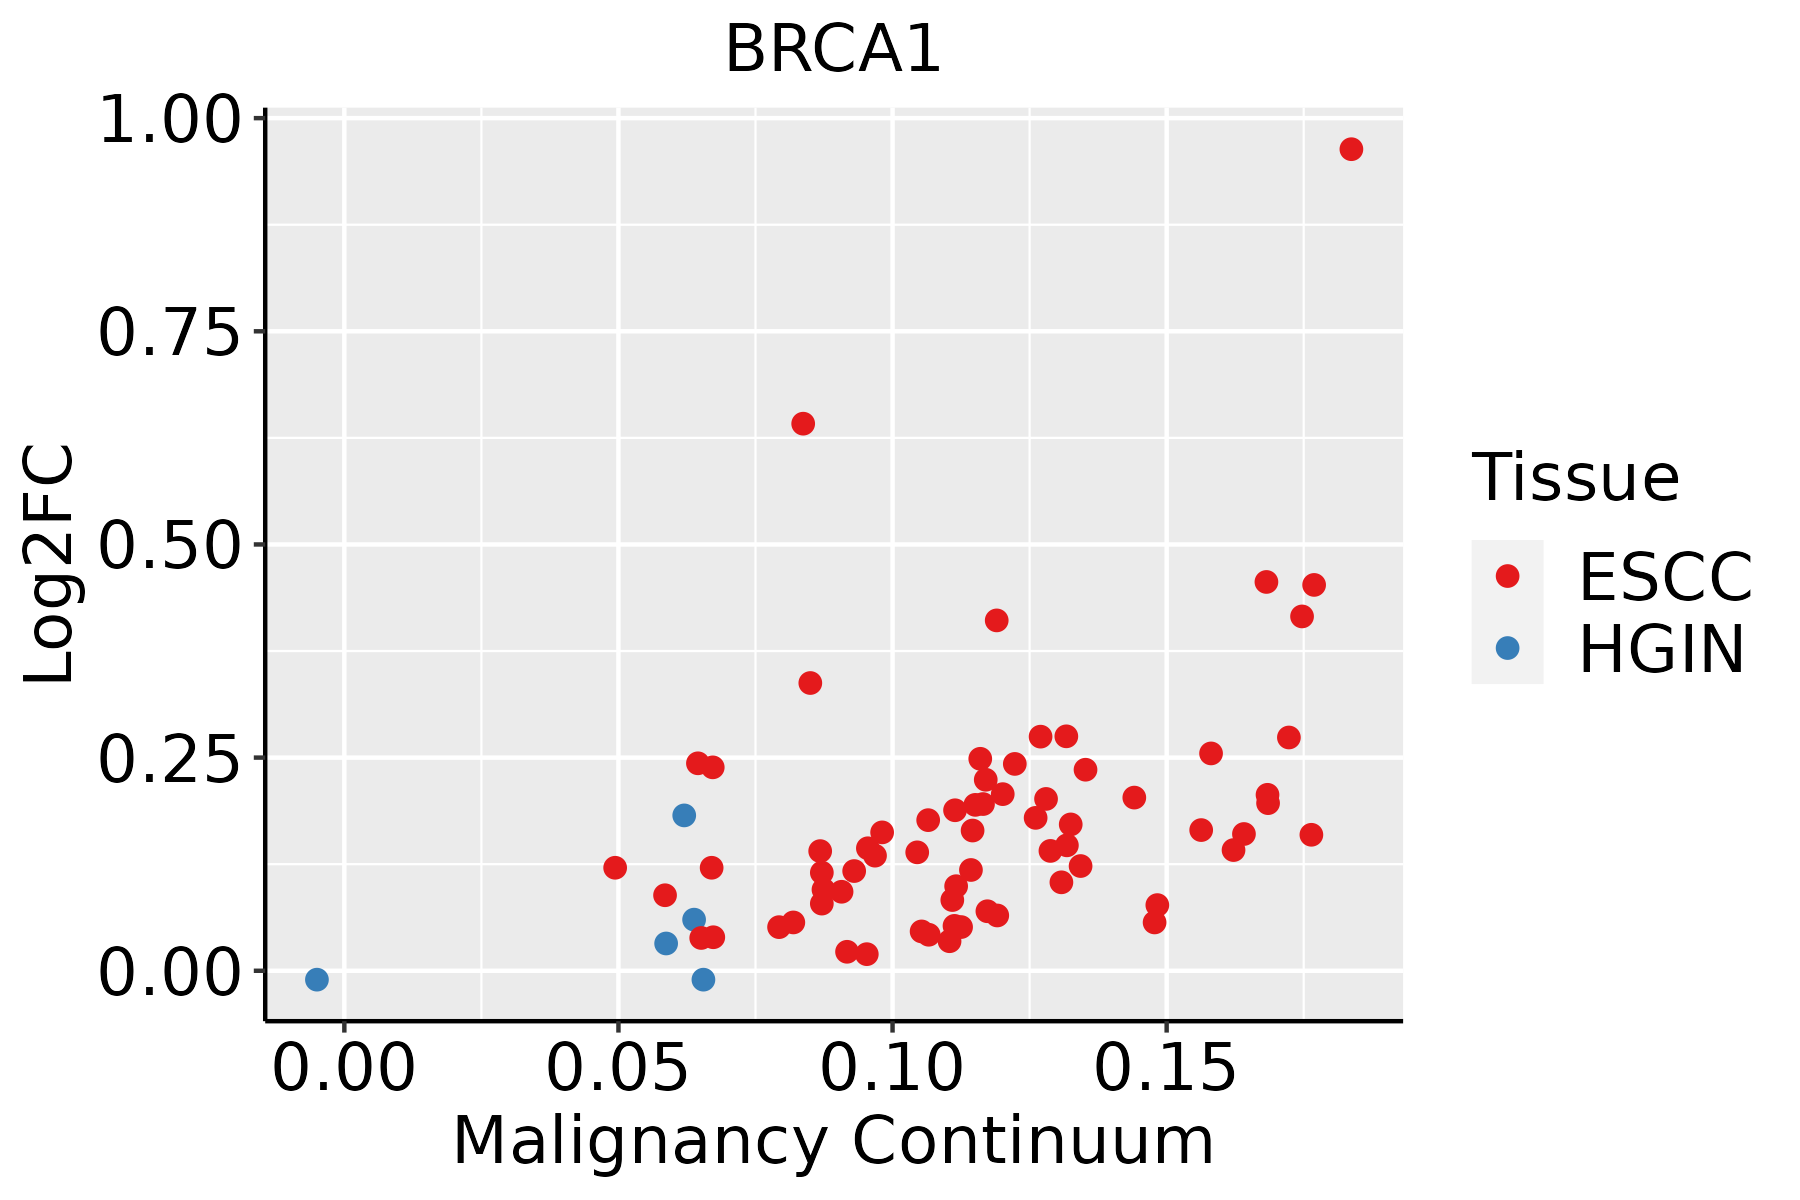 | ESCC: Esophageal squamous cell carcinoma |
| HGIN: High-grade intraepithelial neoplasias |
| LGIN: Low-grade intraepithelial neoplasias |
| Liver | 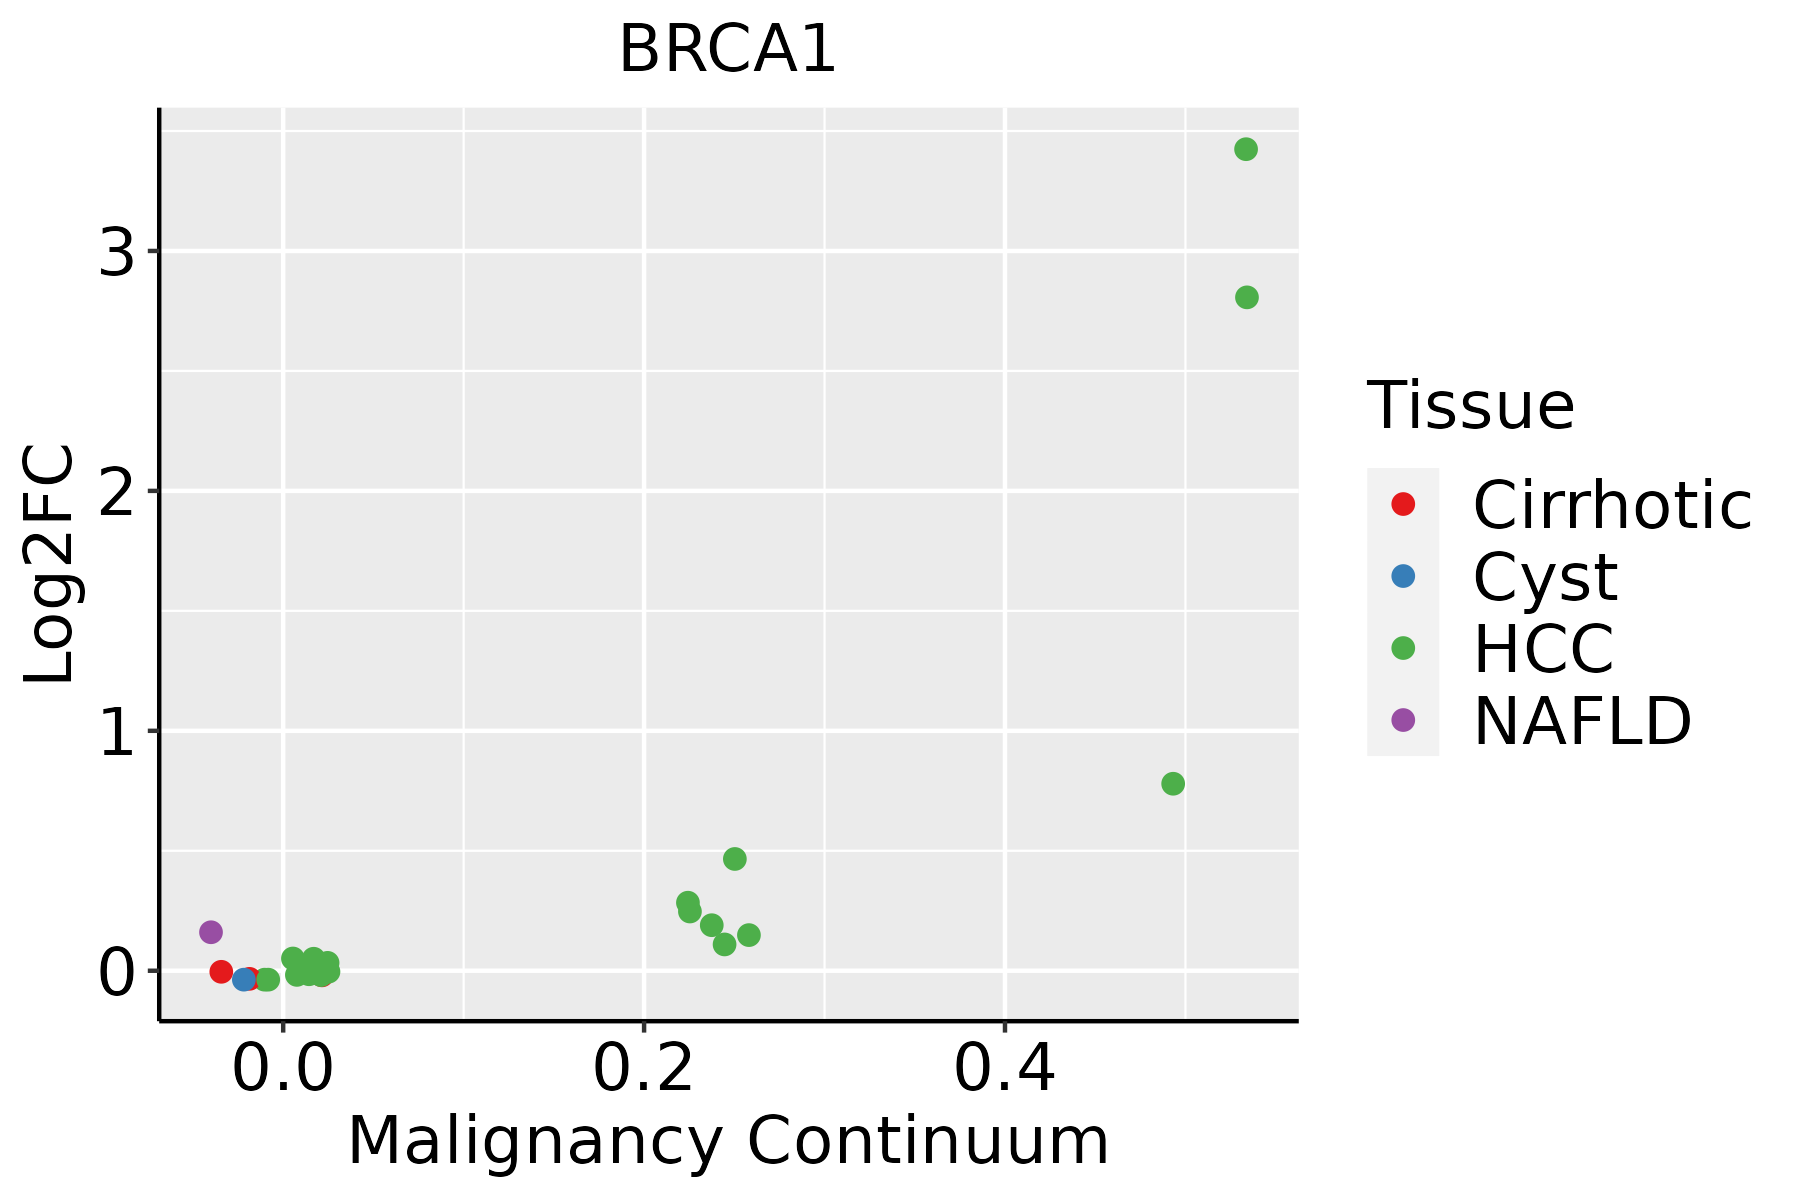 | HCC: Hepatocellular carcinoma |
| NAFLD: Non-alcoholic fatty liver disease |
| Oral Cavity | 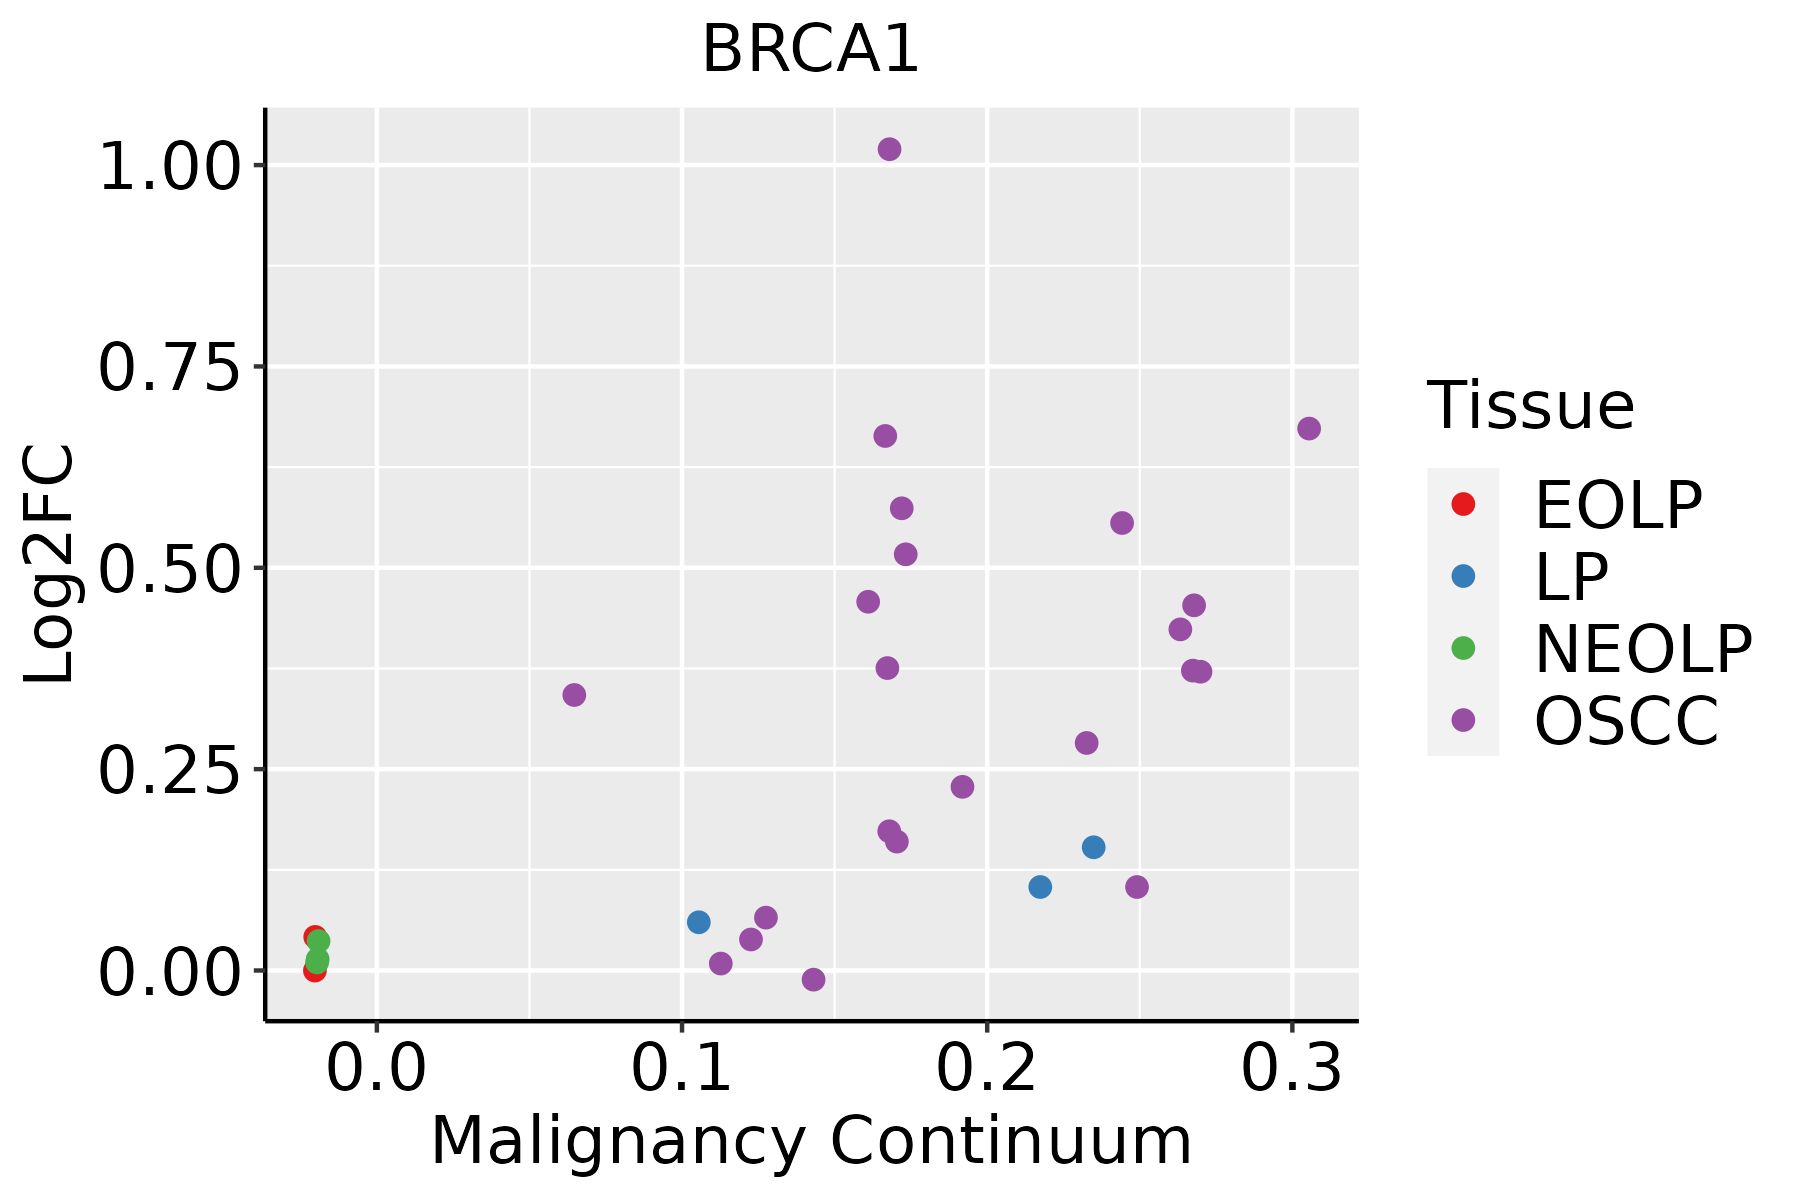 | EOLP: Erosive Oral lichen planus |
| LP: leukoplakia |
| NEOLP: Non-erosive oral lichen planus |
| OSCC: Oral squamous cell carcinoma |
| Thyroid | 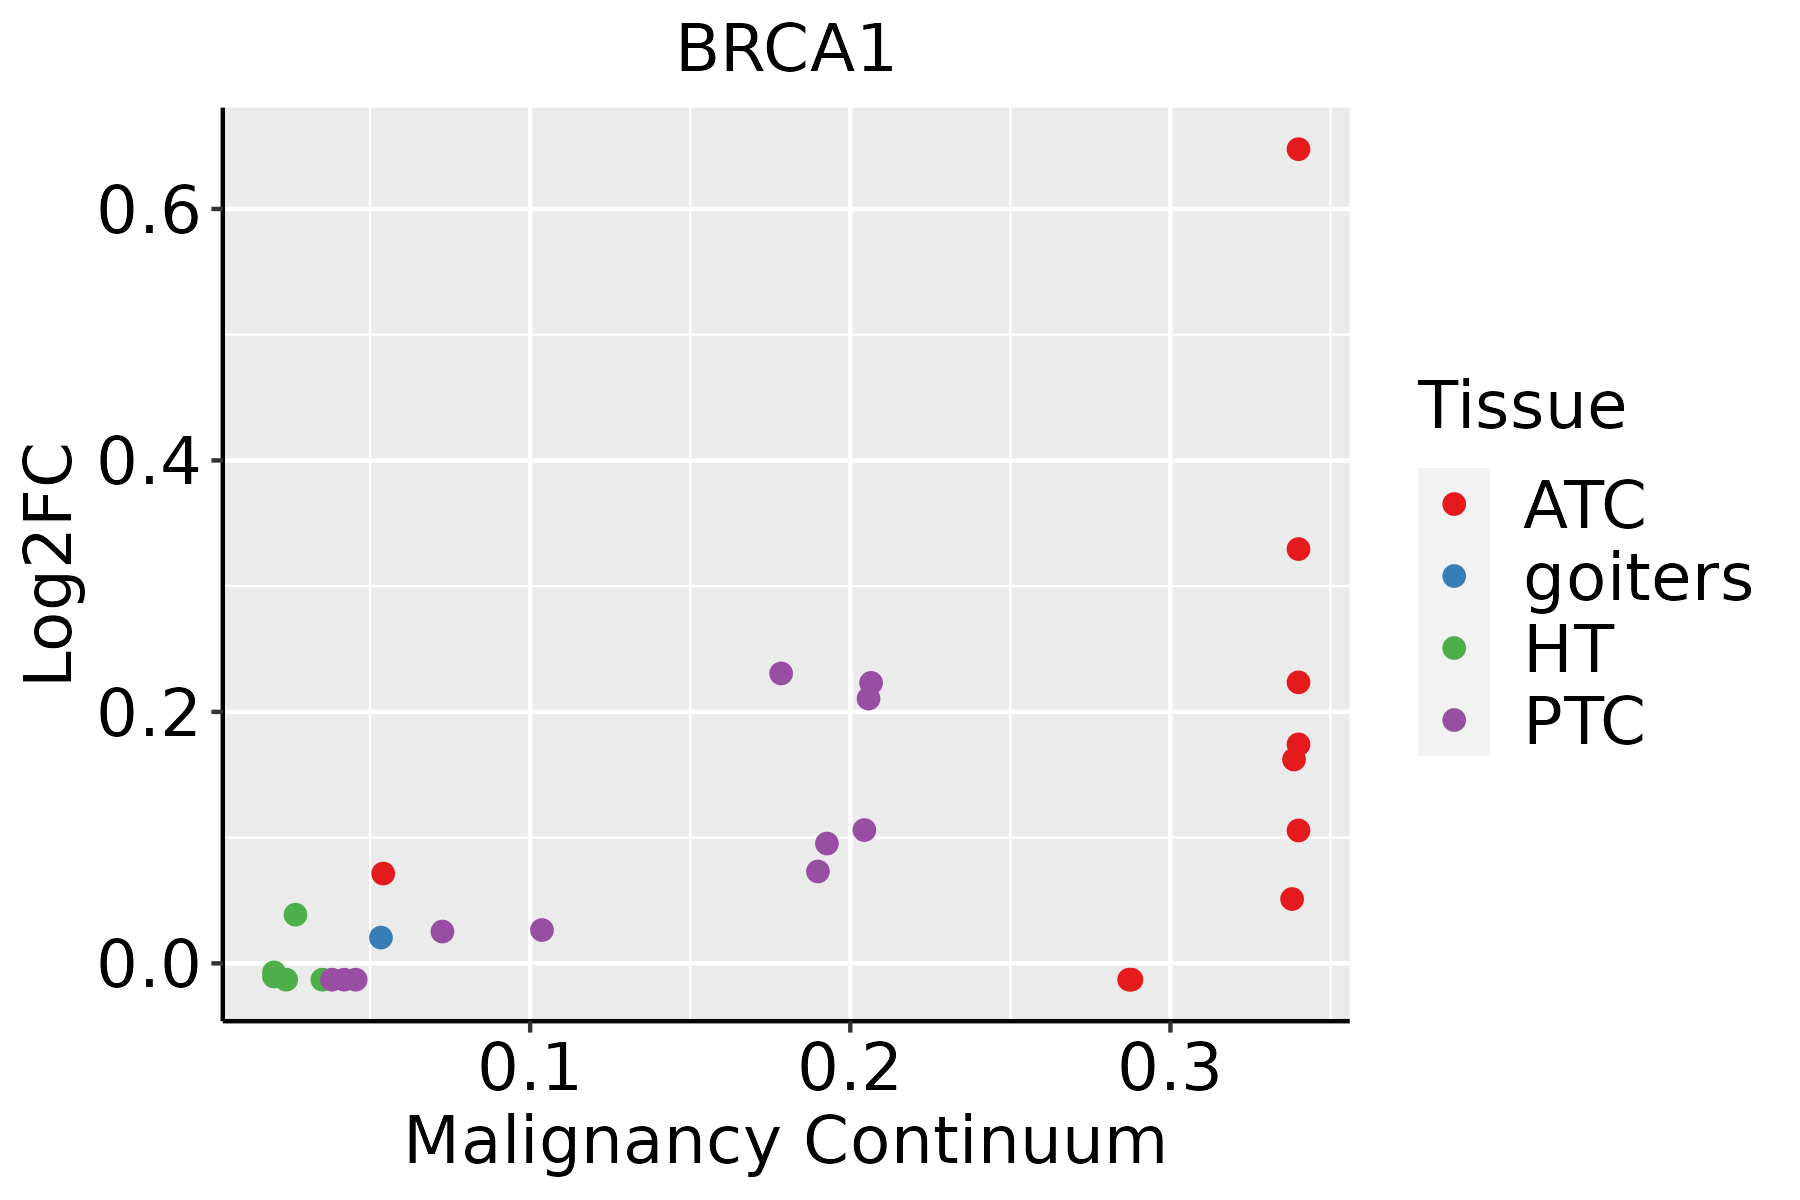 | ATC: Anaplastic thyroid cancer |
| HT: Hashimoto's thyroiditis |
| PTC: Papillary thyroid cancer |
| GO ID | Tissue | Disease Stage | Description | Gene Ratio | Bg Ratio | pvalue | p.adjust | Count |
| GO:0097193 | Colorectum | AD | intrinsic apoptotic signaling pathway | 108/3918 | 288/18723 | 6.25e-11 | 6.41e-09 | 108 |
| GO:2001233 | Colorectum | AD | regulation of apoptotic signaling pathway | 119/3918 | 356/18723 | 2.14e-08 | 1.21e-06 | 119 |
| GO:1903320 | Colorectum | AD | regulation of protein modification by small protein conjugation or removal | 86/3918 | 242/18723 | 9.43e-08 | 4.65e-06 | 86 |
| GO:0010639 | Colorectum | AD | negative regulation of organelle organization | 114/3918 | 348/18723 | 1.41e-07 | 6.49e-06 | 114 |
| GO:0051052 | Colorectum | AD | regulation of DNA metabolic process | 116/3918 | 359/18723 | 2.47e-07 | 1.00e-05 | 116 |
| GO:0051054 | Colorectum | AD | positive regulation of DNA metabolic process | 73/3918 | 201/18723 | 3.27e-07 | 1.29e-05 | 73 |
| GO:0071383 | Colorectum | AD | cellular response to steroid hormone stimulus | 73/3918 | 204/18723 | 6.31e-07 | 2.24e-05 | 73 |
| GO:0030522 | Colorectum | AD | intracellular receptor signaling pathway | 87/3918 | 265/18723 | 3.69e-06 | 1.03e-04 | 87 |
| GO:0031396 | Colorectum | AD | regulation of protein ubiquitination | 72/3918 | 210/18723 | 4.50e-06 | 1.21e-04 | 72 |
| GO:0043401 | Colorectum | AD | steroid hormone mediated signaling pathway | 51/3918 | 136/18723 | 6.52e-06 | 1.63e-04 | 51 |
| GO:0000209 | Colorectum | AD | protein polyubiquitination | 78/3918 | 236/18723 | 8.71e-06 | 2.06e-04 | 78 |
| GO:0051494 | Colorectum | AD | negative regulation of cytoskeleton organization | 58/3918 | 163/18723 | 1.04e-05 | 2.40e-04 | 58 |
| GO:0048545 | Colorectum | AD | response to steroid hormone | 104/3918 | 339/18723 | 1.33e-05 | 2.90e-04 | 104 |
| GO:2001234 | Colorectum | AD | negative regulation of apoptotic signaling pathway | 74/3918 | 224/18723 | 1.49e-05 | 3.18e-04 | 74 |
| GO:0009755 | Colorectum | AD | hormone-mediated signaling pathway | 64/3918 | 190/18723 | 2.78e-05 | 5.24e-04 | 64 |
| GO:2001020 | Colorectum | AD | regulation of response to DNA damage stimulus | 71/3918 | 219/18723 | 4.38e-05 | 7.65e-04 | 71 |
| GO:0030518 | Colorectum | AD | intracellular steroid hormone receptor signaling pathway | 43/3918 | 116/18723 | 4.61e-05 | 7.97e-04 | 43 |
| GO:0006631 | Colorectum | AD | fatty acid metabolic process | 114/3918 | 390/18723 | 5.58e-05 | 9.44e-04 | 114 |
| GO:0097191 | Colorectum | AD | extrinsic apoptotic signaling pathway | 68/3918 | 219/18723 | 2.64e-04 | 3.27e-03 | 68 |
| GO:0072593 | Colorectum | AD | reactive oxygen species metabolic process | 73/3918 | 239/18723 | 2.79e-04 | 3.42e-03 | 73 |
| Pathway ID | Tissue | Disease Stage | Description | Gene Ratio | Bg Ratio | pvalue | p.adjust | qvalue | Count |
| hsa04120 | Colorectum | AD | Ubiquitin mediated proteolysis | 58/2092 | 142/8465 | 1.46e-05 | 1.53e-04 | 9.76e-05 | 58 |
| hsa041201 | Colorectum | AD | Ubiquitin mediated proteolysis | 58/2092 | 142/8465 | 1.46e-05 | 1.53e-04 | 9.76e-05 | 58 |
| hsa041202 | Colorectum | SER | Ubiquitin mediated proteolysis | 39/1580 | 142/8465 | 6.18e-03 | 3.66e-02 | 2.66e-02 | 39 |
| hsa041203 | Colorectum | SER | Ubiquitin mediated proteolysis | 39/1580 | 142/8465 | 6.18e-03 | 3.66e-02 | 2.66e-02 | 39 |
| hsa041204 | Colorectum | MSS | Ubiquitin mediated proteolysis | 55/1875 | 142/8465 | 5.02e-06 | 6.00e-05 | 3.68e-05 | 55 |
| hsa01524 | Colorectum | MSS | Platinum drug resistance | 25/1875 | 73/8465 | 1.17e-02 | 3.99e-02 | 2.44e-02 | 25 |
| hsa041205 | Colorectum | MSS | Ubiquitin mediated proteolysis | 55/1875 | 142/8465 | 5.02e-06 | 6.00e-05 | 3.68e-05 | 55 |
| hsa015241 | Colorectum | MSS | Platinum drug resistance | 25/1875 | 73/8465 | 1.17e-02 | 3.99e-02 | 2.44e-02 | 25 |
| hsa0412027 | Esophagus | ESCC | Ubiquitin mediated proteolysis | 122/4205 | 142/8465 | 6.53e-20 | 7.29e-18 | 3.74e-18 | 122 |
| hsa015247 | Esophagus | ESCC | Platinum drug resistance | 56/4205 | 73/8465 | 1.85e-06 | 1.13e-05 | 5.78e-06 | 56 |
| hsa041517 | Esophagus | ESCC | PI3K-Akt signaling pathway | 197/4205 | 354/8465 | 1.24e-02 | 2.83e-02 | 1.45e-02 | 197 |
| hsa0412036 | Esophagus | ESCC | Ubiquitin mediated proteolysis | 122/4205 | 142/8465 | 6.53e-20 | 7.29e-18 | 3.74e-18 | 122 |
| hsa0152414 | Esophagus | ESCC | Platinum drug resistance | 56/4205 | 73/8465 | 1.85e-06 | 1.13e-05 | 5.78e-06 | 56 |
| hsa0415114 | Esophagus | ESCC | PI3K-Akt signaling pathway | 197/4205 | 354/8465 | 1.24e-02 | 2.83e-02 | 1.45e-02 | 197 |
| hsa0412041 | Liver | HCC | Ubiquitin mediated proteolysis | 110/4020 | 142/8465 | 1.67e-13 | 3.74e-12 | 2.08e-12 | 110 |
| hsa015242 | Liver | HCC | Platinum drug resistance | 52/4020 | 73/8465 | 3.14e-05 | 1.88e-04 | 1.04e-04 | 52 |
| hsa0412051 | Liver | HCC | Ubiquitin mediated proteolysis | 110/4020 | 142/8465 | 1.67e-13 | 3.74e-12 | 2.08e-12 | 110 |
| hsa015243 | Liver | HCC | Platinum drug resistance | 52/4020 | 73/8465 | 3.14e-05 | 1.88e-04 | 1.04e-04 | 52 |
| hsa0412020 | Oral cavity | OSCC | Ubiquitin mediated proteolysis | 105/3704 | 142/8465 | 1.83e-13 | 4.37e-12 | 2.23e-12 | 105 |
| hsa015246 | Oral cavity | OSCC | Platinum drug resistance | 51/3704 | 73/8465 | 5.41e-06 | 2.75e-05 | 1.40e-05 | 51 |
| Hugo Symbol | Variant Class | Variant Classification | dbSNP RS | HGVSc | HGVSp | HGVSp Short | SWISSPROT | BIOTYPE | SIFT | PolyPhen | Tumor Sample Barcode | Tissue | Histology | Sex | Age | Stage | Therapy Types | Drugs | Outcome |
| BRCA1 | SNV | Missense_Mutation | | c.25N>C | p.Glu9Gln | p.E9Q | P38398 | protein_coding | tolerated(0.1) | possibly_damaging(0.749) | TCGA-A1-A0SI-01 | Breast | breast invasive carcinoma | Female | <65 | I/II | Unknown | Unknown | SD |
| BRCA1 | SNV | Missense_Mutation | novel | c.149N>C | p.Lys50Thr | p.K50T | P38398 | protein_coding | deleterious(0) | probably_damaging(0.984) | TCGA-A2-A4S0-01 | Breast | breast invasive carcinoma | Female | >=65 | I/II | Unknown | Unknown | SD |
| BRCA1 | SNV | Missense_Mutation | | c.3292N>A | p.Leu1098Ile | p.L1098I | P38398 | protein_coding | deleterious(0.01) | benign(0.373) | TCGA-AN-A046-01 | Breast | breast invasive carcinoma | Female | >=65 | I/II | Unknown | Unknown | SD |
| BRCA1 | SNV | Missense_Mutation | rs80357069 | c.5426G>T | p.Gly1809Val | p.G1809V | P38398 | protein_coding | deleterious(0) | probably_damaging(1) | TCGA-AN-A0XU-01 | Breast | breast invasive carcinoma | Female | <65 | I/II | Unknown | Unknown | SD |
| BRCA1 | SNV | Missense_Mutation | | c.247N>T | p.Val83Phe | p.V83F | P38398 | protein_coding | deleterious(0) | probably_damaging(0.949) | TCGA-AO-A0J4-01 | Breast | breast invasive carcinoma | Female | <65 | I/II | Chemotherapy | doxorubicin | SD |
| BRCA1 | SNV | Missense_Mutation | | c.5495A>T | p.Gln1832Leu | p.Q1832L | P38398 | protein_coding | deleterious(0) | possibly_damaging(0.849) | TCGA-BH-A0DS-01 | Breast | breast invasive carcinoma | Female | >=65 | III/IV | Chemotherapy | cyclophosphamide | SD |
| BRCA1 | SNV | Missense_Mutation | novel | c.4795N>C | p.Asp1599His | p.D1599H | P38398 | protein_coding | deleterious(0.01) | possibly_damaging(0.891) | TCGA-BH-A2L8-01 | Breast | breast invasive carcinoma | Female | <65 | I/II | Chemotherapy | cytoxan | CR |
| BRCA1 | SNV | Missense_Mutation | | c.4030N>C | p.Asp1344His | p.D1344H | P38398 | protein_coding | deleterious(0.04) | benign(0.065) | TCGA-C8-A12T-01 | Breast | breast invasive carcinoma | Female | <65 | I/II | Unknown | Unknown | SD |
| BRCA1 | SNV | Missense_Mutation | | c.6N>A | p.Asp2Glu | p.D2E | P38398 | protein_coding | deleterious(0) | probably_damaging(1) | TCGA-E2-A1BD-01 | Breast | breast invasive carcinoma | Female | <65 | I/II | Hormone Therapy | arimidex | SD |
| BRCA1 | SNV | Missense_Mutation | | c.3080N>T | p.Ser1027Ile | p.S1027I | P38398 | protein_coding | tolerated(0.08) | benign(0.202) | TCGA-E2-A1L9-01 | Breast | breast invasive carcinoma | Female | <65 | I/II | Chemotherapy | cytoxan | SD |
| Entrez ID | Symbol | Category | Interaction Types | Drug Claim Name | Drug Name | PMIDs |
| 672 | BRCA1 | CLINICALLY ACTIONABLE, TUMOR SUPPRESSOR, ENZYME, DRUGGABLE GENOME, DRUG RESISTANCE | | DOXORUBICIN HYDROCHLORIDE | DOXORUBICIN HYDROCHLORIDE | |
| 672 | BRCA1 | CLINICALLY ACTIONABLE, TUMOR SUPPRESSOR, ENZYME, DRUGGABLE GENOME, DRUG RESISTANCE | | ACRIFLAVINE CHLORIDE | ACRIFLAVINE | |
| 672 | BRCA1 | CLINICALLY ACTIONABLE, TUMOR SUPPRESSOR, ENZYME, DRUGGABLE GENOME, DRUG RESISTANCE | | 7-O-ACETYLAFROMOSIN | CHEMBL446567 | |
| 672 | BRCA1 | CLINICALLY ACTIONABLE, TUMOR SUPPRESSOR, ENZYME, DRUGGABLE GENOME, DRUG RESISTANCE | | PIFEXOLE | PIFEXOLE | |
| 672 | BRCA1 | CLINICALLY ACTIONABLE, TUMOR SUPPRESSOR, ENZYME, DRUGGABLE GENOME, DRUG RESISTANCE | | DOXORUBICIN | DOXORUBICIN | 12698198 |
| 672 | BRCA1 | CLINICALLY ACTIONABLE, TUMOR SUPPRESSOR, ENZYME, DRUGGABLE GENOME, DRUG RESISTANCE | | DNDI1417078 | CHEMBL1320798 | |
| 672 | BRCA1 | CLINICALLY ACTIONABLE, TUMOR SUPPRESSOR, ENZYME, DRUGGABLE GENOME, DRUG RESISTANCE | | Cyclophosphamide | CYCLOPHOSPHAMIDE | 25589624 |
| 672 | BRCA1 | CLINICALLY ACTIONABLE, TUMOR SUPPRESSOR, ENZYME, DRUGGABLE GENOME, DRUG RESISTANCE | | HORMONES | | 9133444 |
| 672 | BRCA1 | CLINICALLY ACTIONABLE, TUMOR SUPPRESSOR, ENZYME, DRUGGABLE GENOME, DRUG RESISTANCE | | MITOMYCIN C | | 15782115 |
| 672 | BRCA1 | CLINICALLY ACTIONABLE, TUMOR SUPPRESSOR, ENZYME, DRUGGABLE GENOME, DRUG RESISTANCE | | ABT-767 | | |


