
|
|||||
|
 | |
| |
| |
| |
| |
| |
|
Gene: BRAF |
Gene summary for BRAF |
| Gene information | Species | Human | Gene symbol | BRAF | Gene ID | 673 |
| Gene name | B-Raf proto-oncogene, serine/threonine kinase | |
| Gene Alias | B-RAF1 | |
| Cytomap | 7q34 | |
| Gene Type | protein-coding | GO ID | GO:0000165 | UniProtAcc | P15056 |
Top |
Malignant transformation analysis |
| Identification of the aberrant gene expression in precancerous and cancerous lesions by comparing the gene expression of stem-like cells in diseased tissues with normal stem cells |
| Entrez ID | Symbol | Replicates | Species | Organ | Tissue | Adj P-value | Log2FC | Malignancy |
| 673 | BRAF | CCI_3 | Human | Cervix | CC | 3.83e-03 | 5.86e-01 | 0.516 |
| 673 | BRAF | HTA11_3410_2000001011 | Human | Colorectum | AD | 3.44e-10 | -3.82e-01 | 0.0155 |
| 673 | BRAF | HTA11_347_2000001011 | Human | Colorectum | AD | 1.74e-02 | 4.16e-01 | -0.1954 |
| 673 | BRAF | HTA11_866_3004761011 | Human | Colorectum | AD | 3.43e-04 | -3.75e-01 | 0.096 |
| 673 | BRAF | HTA11_99999974143_84620 | Human | Colorectum | MSS | 3.40e-04 | -3.57e-01 | 0.3005 |
| 673 | BRAF | A001-C-207 | Human | Colorectum | FAP | 2.43e-05 | -3.29e-01 | 0.1278 |
| 673 | BRAF | A015-C-203 | Human | Colorectum | FAP | 5.20e-39 | -7.01e-01 | -0.1294 |
| 673 | BRAF | A015-C-204 | Human | Colorectum | FAP | 2.11e-11 | -4.81e-01 | -0.0228 |
| 673 | BRAF | A014-C-040 | Human | Colorectum | FAP | 8.13e-06 | -3.58e-01 | -0.1184 |
| 673 | BRAF | A002-C-201 | Human | Colorectum | FAP | 4.49e-18 | -4.36e-01 | 0.0324 |
| 673 | BRAF | A001-C-119 | Human | Colorectum | FAP | 1.39e-11 | -5.17e-01 | -0.1557 |
| 673 | BRAF | A001-C-108 | Human | Colorectum | FAP | 4.76e-20 | -4.38e-01 | -0.0272 |
| 673 | BRAF | A002-C-205 | Human | Colorectum | FAP | 5.27e-27 | -4.54e-01 | -0.1236 |
| 673 | BRAF | A001-C-104 | Human | Colorectum | FAP | 7.13e-07 | -2.98e-01 | 0.0184 |
| 673 | BRAF | A015-C-005 | Human | Colorectum | FAP | 2.75e-05 | -3.01e-01 | -0.0336 |
| 673 | BRAF | A015-C-006 | Human | Colorectum | FAP | 1.71e-25 | -7.36e-01 | -0.0994 |
| 673 | BRAF | A015-C-106 | Human | Colorectum | FAP | 6.28e-13 | -3.85e-01 | -0.0511 |
| 673 | BRAF | A002-C-114 | Human | Colorectum | FAP | 3.23e-30 | -6.78e-01 | -0.1561 |
| 673 | BRAF | A015-C-104 | Human | Colorectum | FAP | 3.69e-43 | -7.49e-01 | -0.1899 |
| 673 | BRAF | A001-C-014 | Human | Colorectum | FAP | 7.78e-17 | -3.72e-01 | 0.0135 |
| Page: 1 2 3 4 5 6 7 8 |
| Tissue | Expression Dynamics | Abbreviation |
| Cervix | 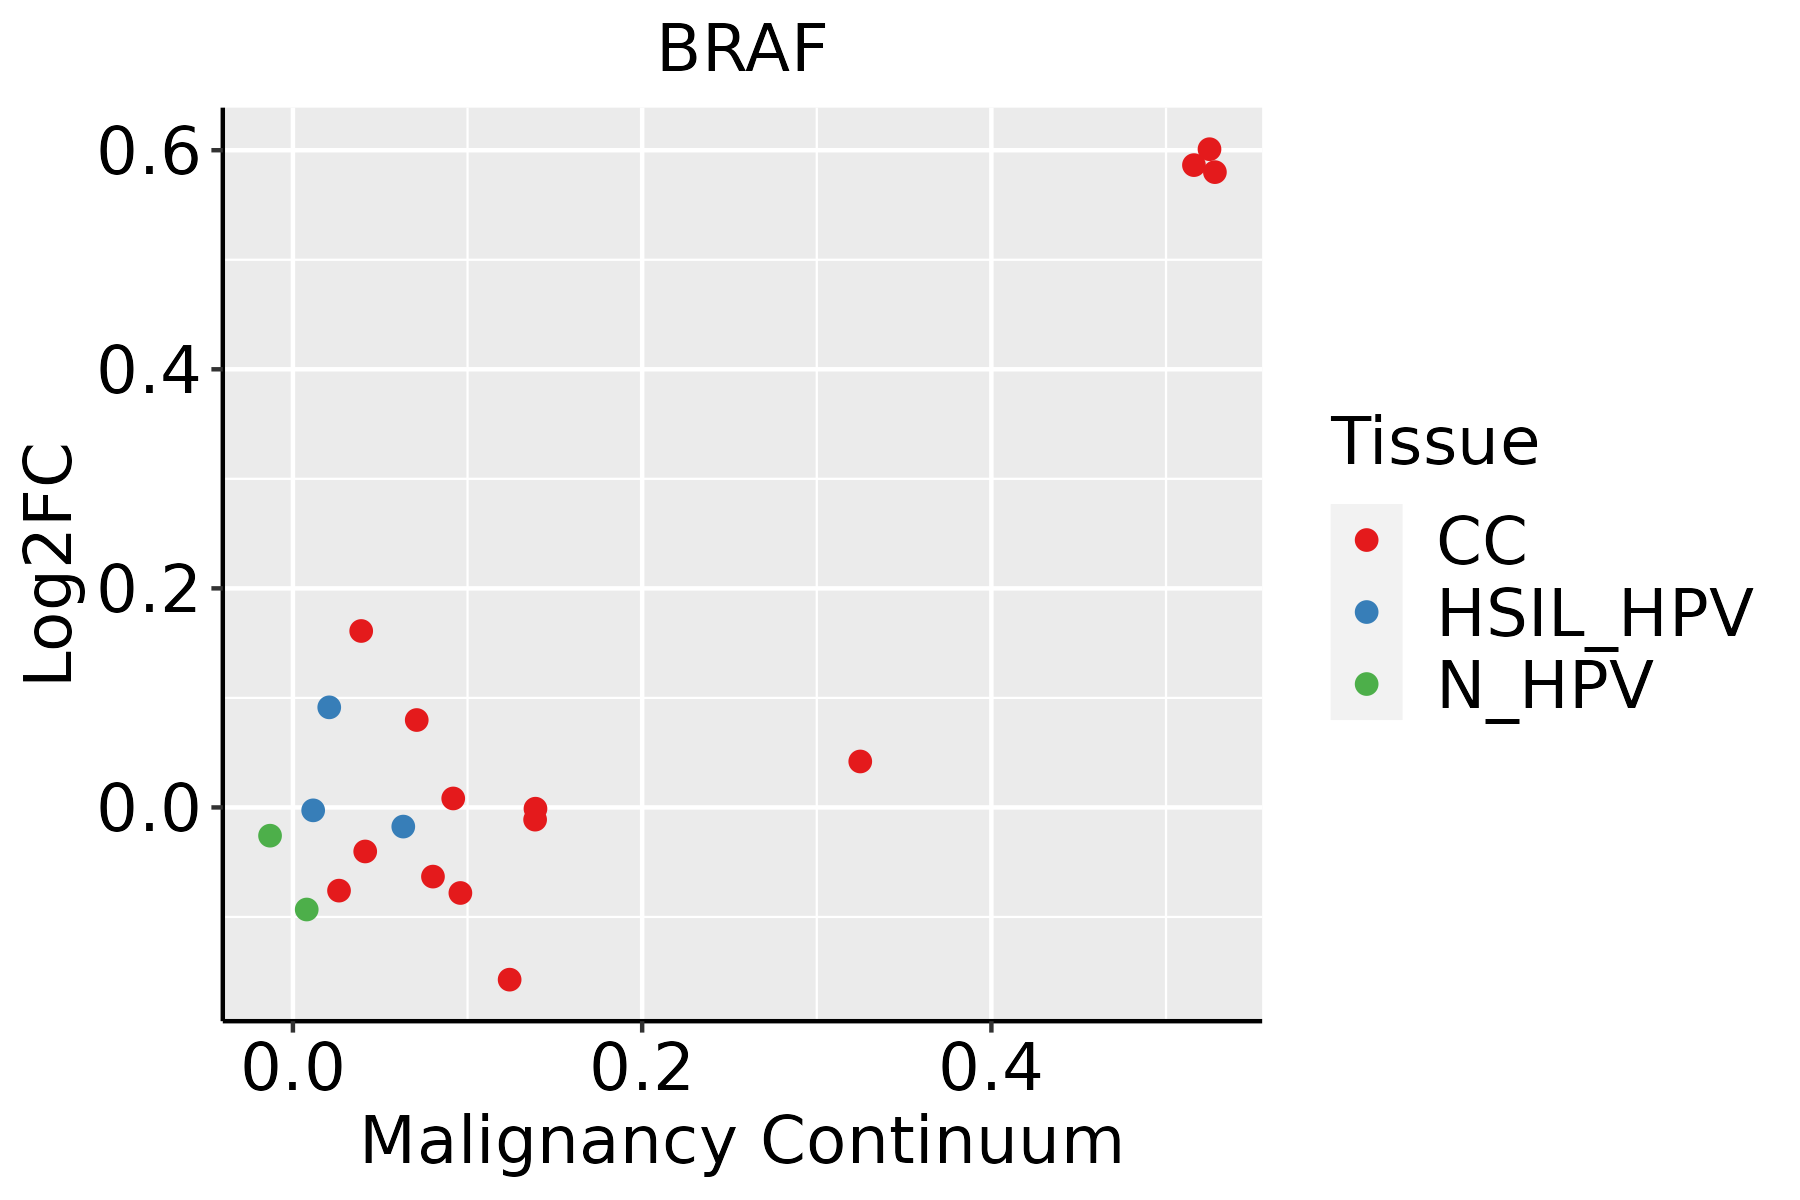 | CC: Cervix cancer |
| HSIL_HPV: HPV-infected high-grade squamous intraepithelial lesions | ||
| N_HPV: HPV-infected normal cervix | ||
| Colorectum (GSE201348) |  | FAP: Familial adenomatous polyposis |
| CRC: Colorectal cancer | ||
| Colorectum (HTA11) |  | AD: Adenomas |
| SER: Sessile serrated lesions | ||
| MSI-H: Microsatellite-high colorectal cancer | ||
| MSS: Microsatellite stable colorectal cancer | ||
| Endometrium | 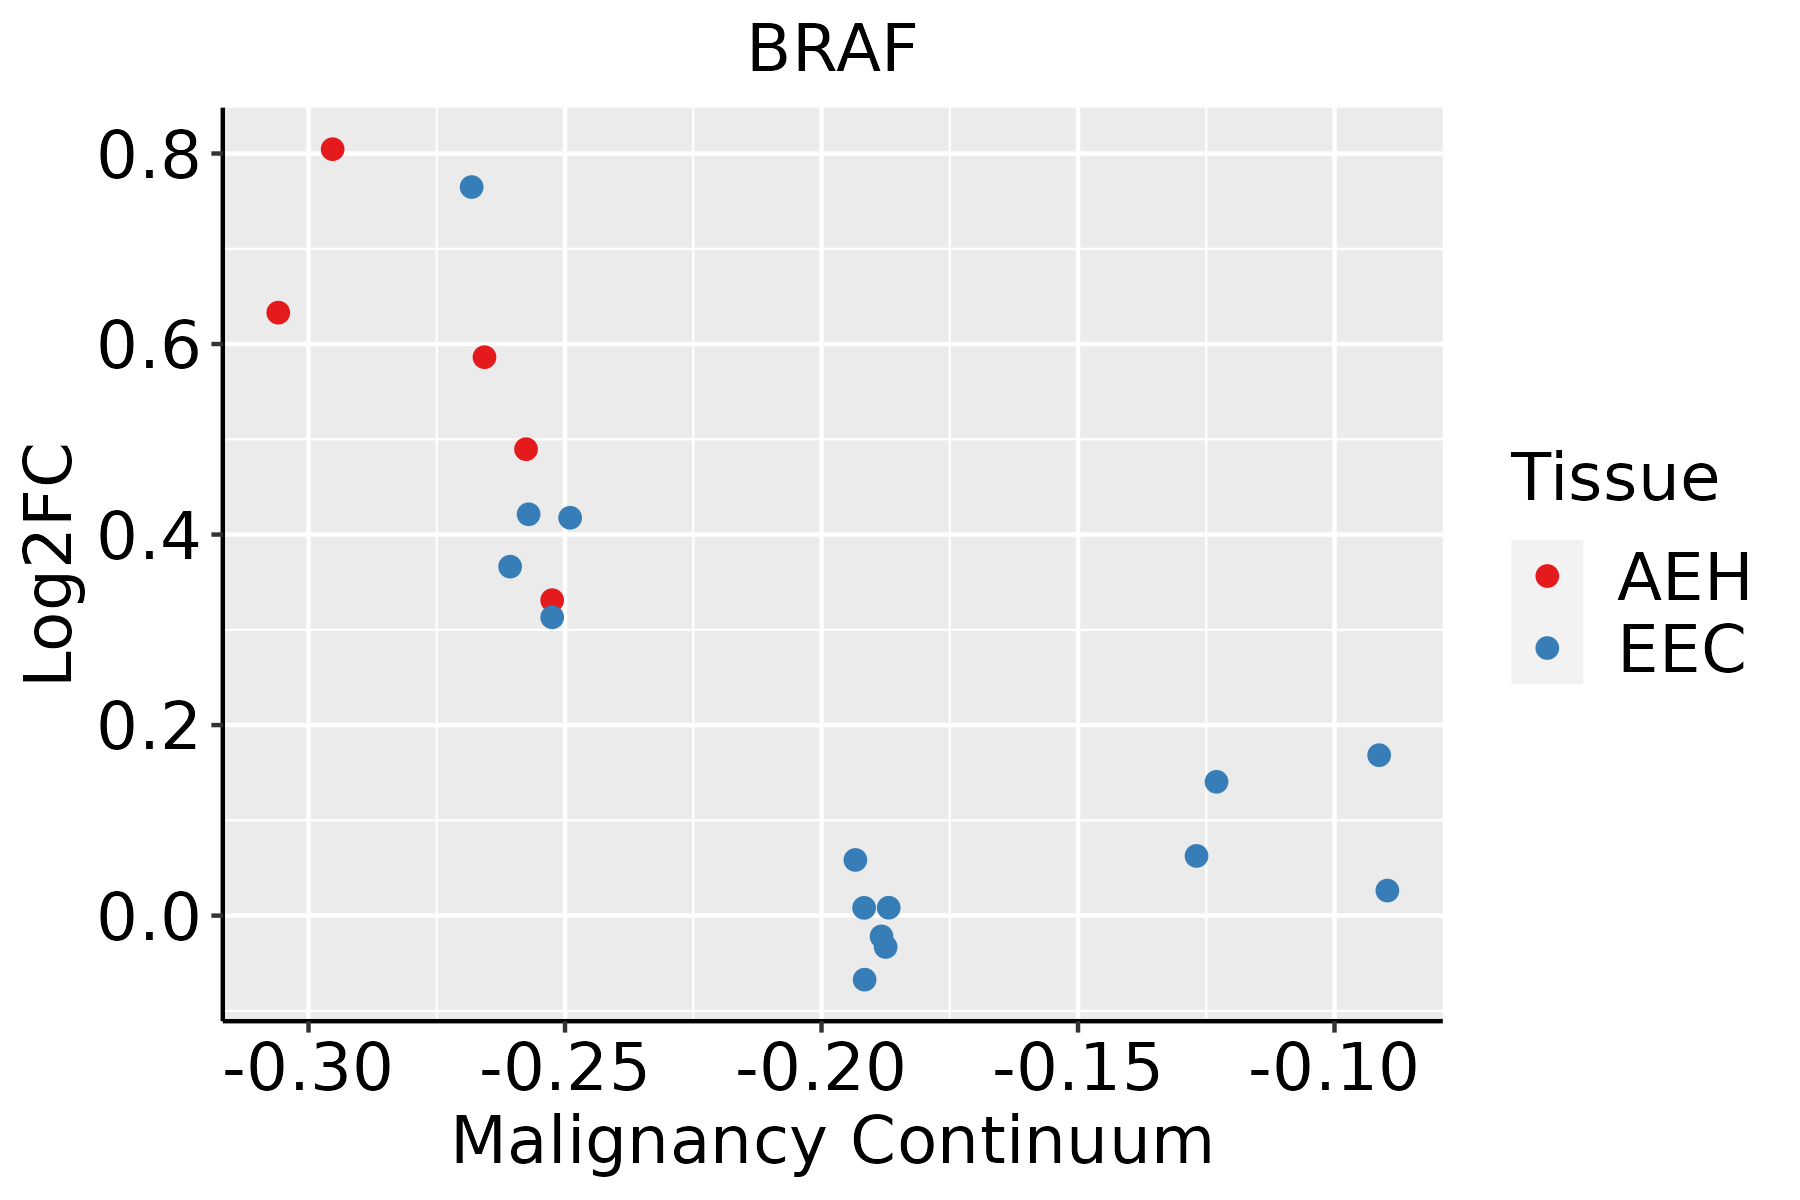 | AEH: Atypical endometrial hyperplasia |
| EEC: Endometrioid Cancer | ||
| Esophagus | 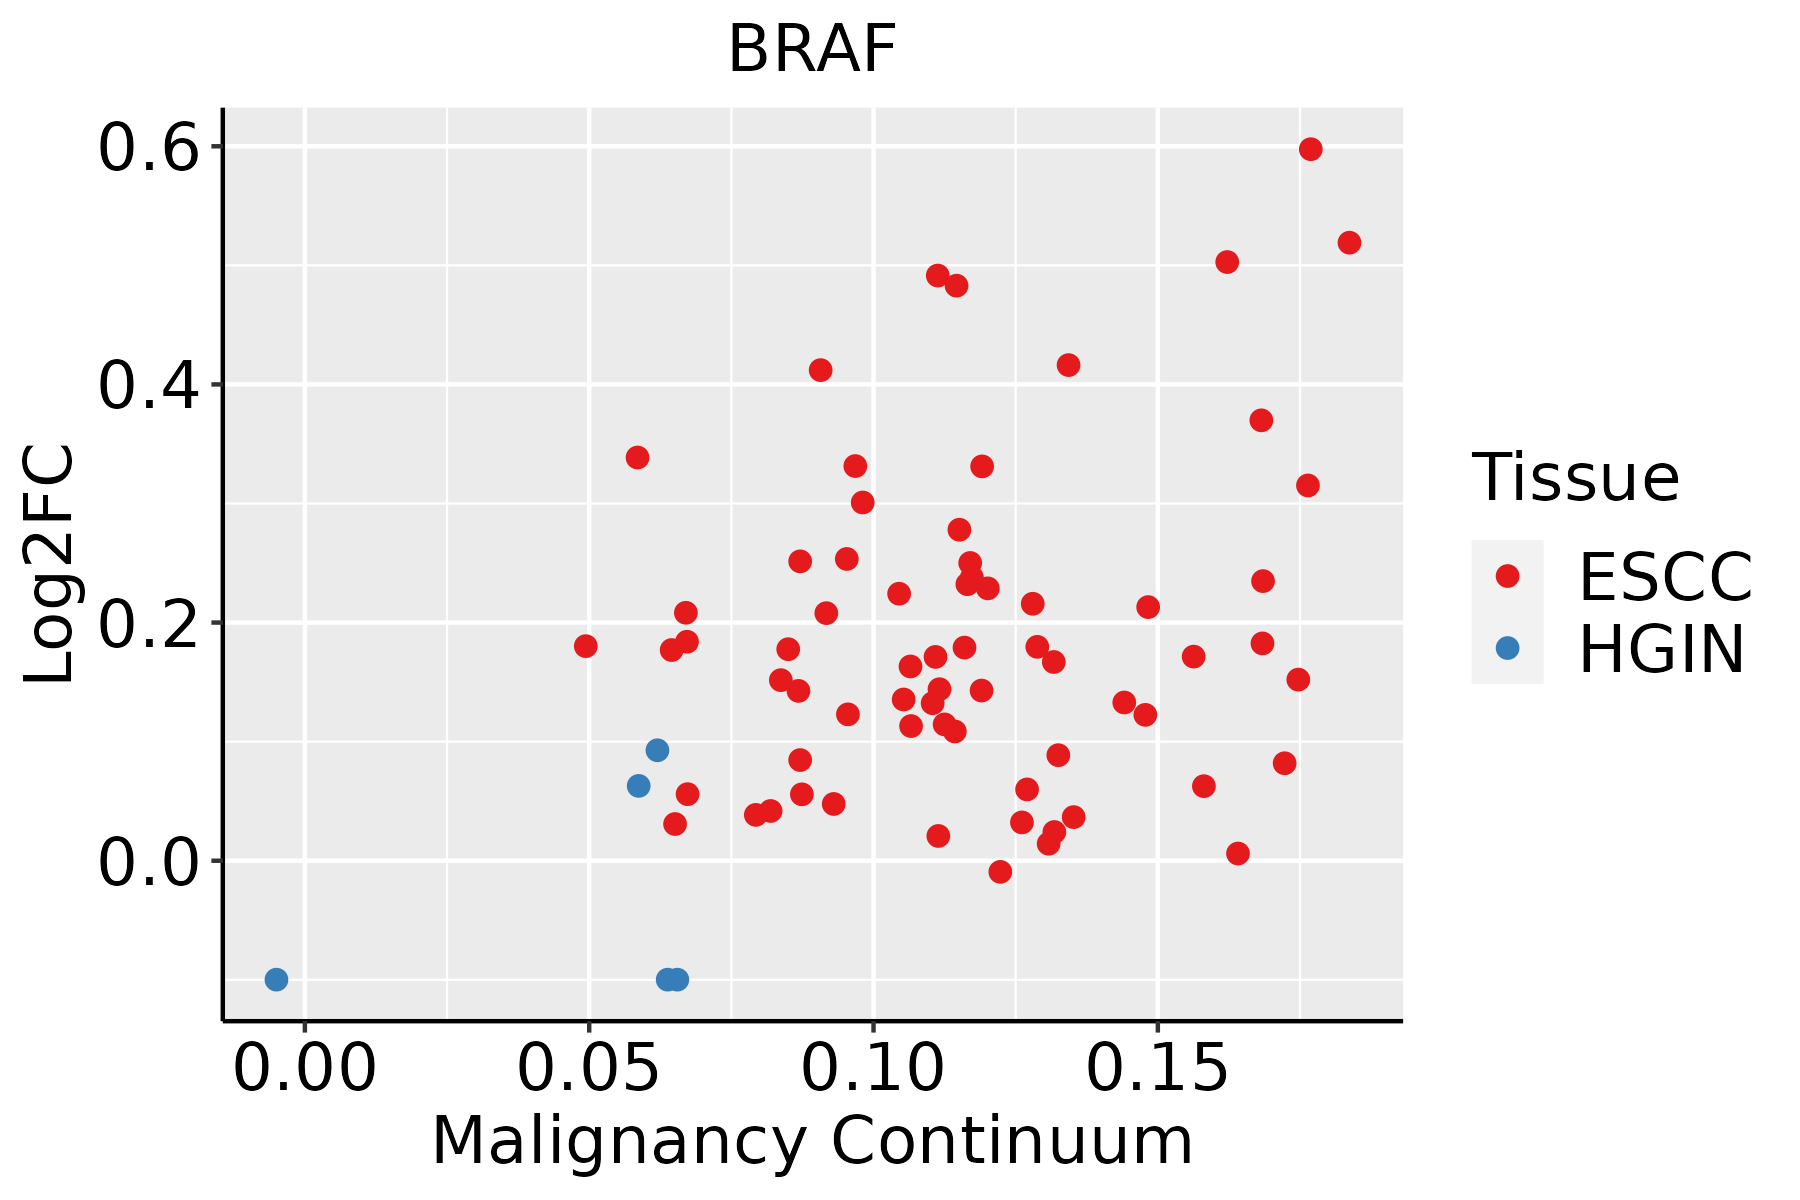 | ESCC: Esophageal squamous cell carcinoma |
| HGIN: High-grade intraepithelial neoplasias | ||
| LGIN: Low-grade intraepithelial neoplasias | ||
| Lung | 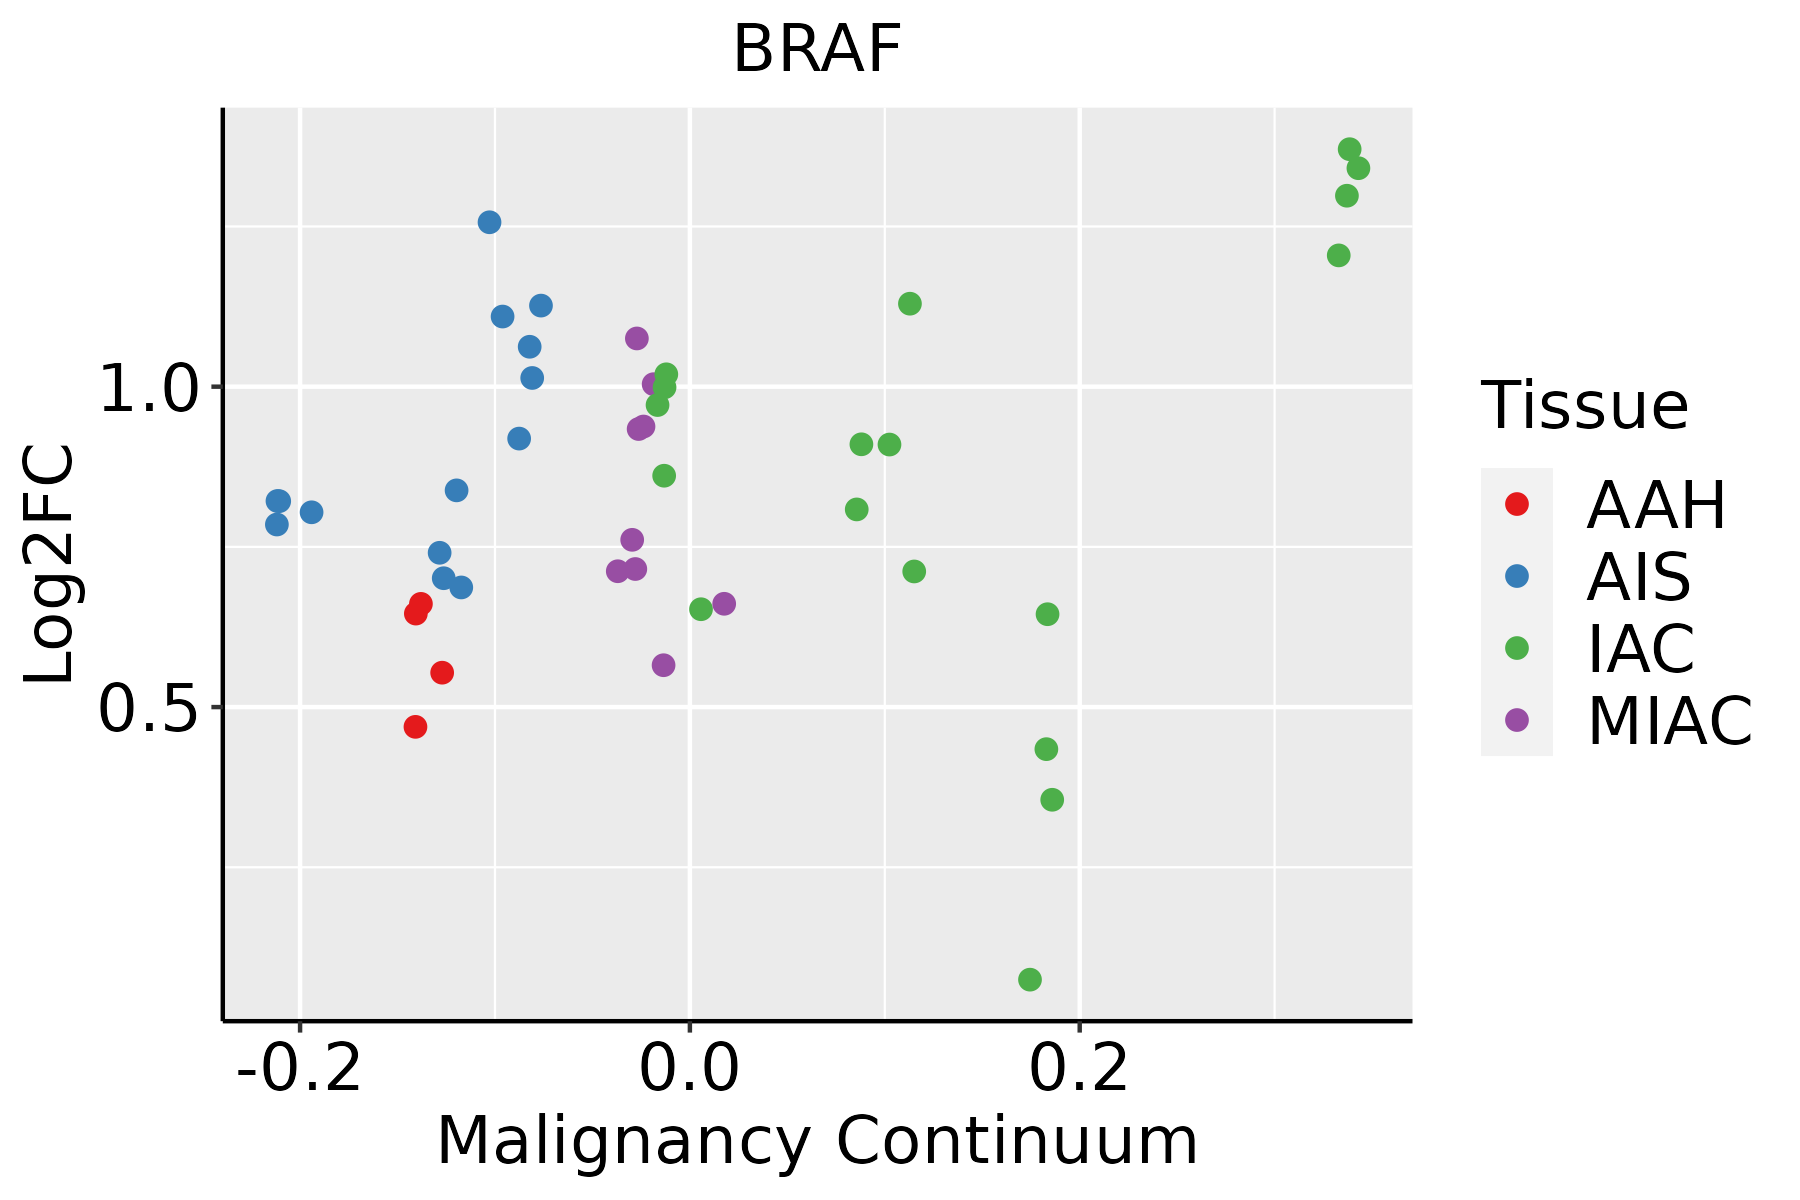 | AAH: Atypical adenomatous hyperplasia |
| AIS: Adenocarcinoma in situ | ||
| IAC: Invasive lung adenocarcinoma | ||
| MIA: Minimally invasive adenocarcinoma | ||
| Prostate | 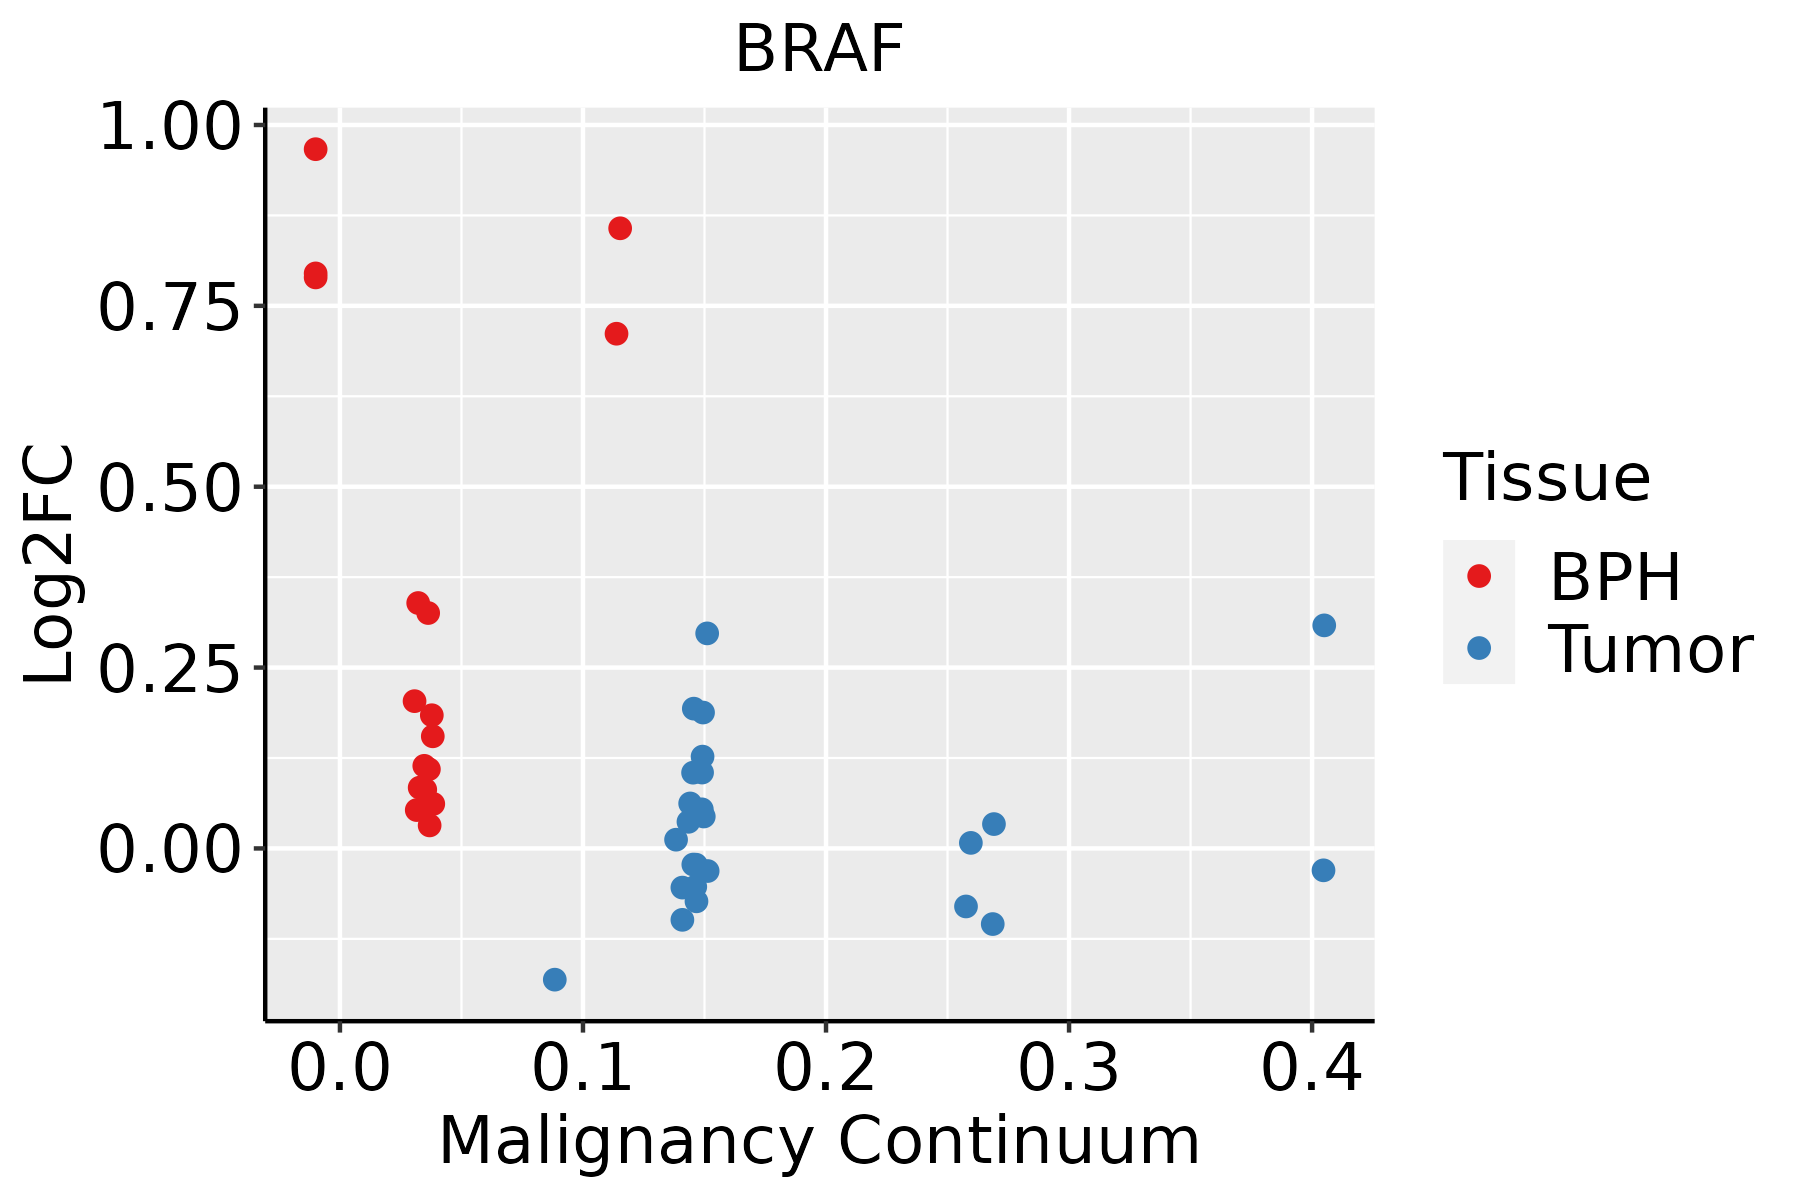 | BPH: Benign Prostatic Hyperplasia |
| Skin |  | AK: Actinic keratosis |
| cSCC: Cutaneous squamous cell carcinoma | ||
| SCCIS:squamous cell carcinoma in situ | ||
| Thyroid | 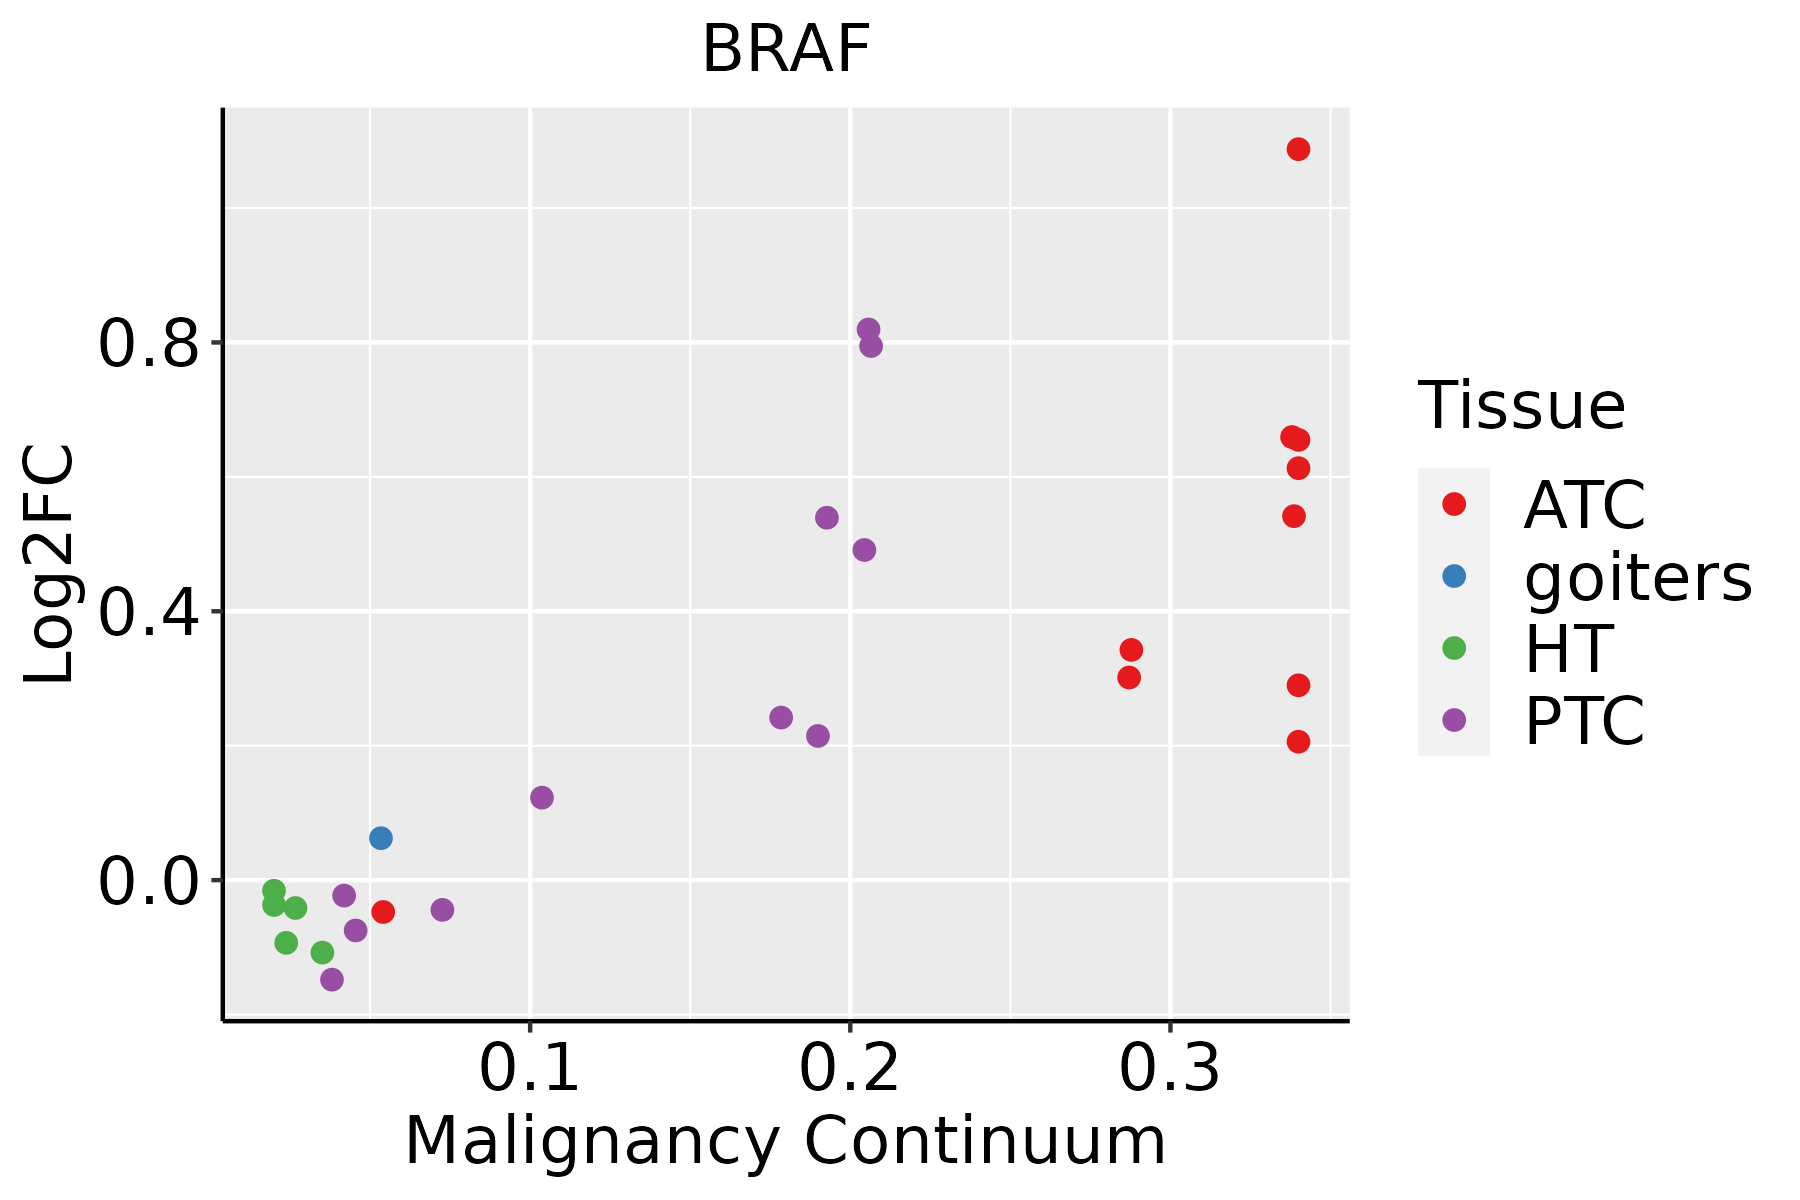 | ATC: Anaplastic thyroid cancer |
| HT: Hashimoto's thyroiditis | ||
| PTC: Papillary thyroid cancer |
| ∗log2FC in expression of this searched gene in stem-like cells from each diseased tissue sample relative to stem-like cells in normal samples in each tissue plotted against the malignancy continuum. Samples are colored based on if they are from different disease stage. |
Top |
Malignant transformation related pathway analysis |
| Find out the enriched GO biological processes and KEGG pathways involved in transition from healthy to precancer to cancer |
| Tissue | Disease Stage | Enriched GO biological Processes |
| Colorectum | AD |  |
| Colorectum | SER |  |
| Colorectum | MSS |  |
| Colorectum | MSI-H |  |
| Colorectum | FAP |  |
| ∗Top 15 enriched GO BP terms are showed in the bar plot of each disease state in each tissue. Each row represents a significant GO biological process which is colored according to the -log10(p.adjust). |
| Page: 1 2 3 4 5 6 7 8 9 |
| GO ID | Tissue | Disease Stage | Description | Gene Ratio | Bg Ratio | pvalue | p.adjust | Count |
| GO:00071738 | Cervix | CC | epidermal growth factor receptor signaling pathway | 36/2311 | 108/18723 | 1.04e-08 | 8.44e-07 | 36 |
| GO:00381278 | Cervix | CC | ERBB signaling pathway | 37/2311 | 121/18723 | 8.57e-08 | 4.88e-06 | 37 |
| GO:00434104 | Cervix | CC | positive regulation of MAPK cascade | 90/2311 | 480/18723 | 2.92e-05 | 4.83e-04 | 90 |
| GO:00181057 | Cervix | CC | peptidyl-serine phosphorylation | 63/2311 | 315/18723 | 6.65e-05 | 9.47e-04 | 63 |
| GO:00901509 | Cervix | CC | establishment of protein localization to membrane | 54/2311 | 260/18723 | 7.67e-05 | 1.05e-03 | 54 |
| GO:00182096 | Cervix | CC | peptidyl-serine modification | 66/2311 | 338/18723 | 9.58e-05 | 1.25e-03 | 66 |
| GO:001003810 | Cervix | CC | response to metal ion | 67/2311 | 373/18723 | 9.67e-04 | 8.10e-03 | 67 |
| GO:00703714 | Cervix | CC | ERK1 and ERK2 cascade | 60/2311 | 330/18723 | 1.28e-03 | 1.02e-02 | 60 |
| GO:00515926 | Cervix | CC | response to calcium ion | 31/2311 | 149/18723 | 2.31e-03 | 1.65e-02 | 31 |
| GO:00331353 | Cervix | CC | regulation of peptidyl-serine phosphorylation | 29/2311 | 144/18723 | 5.10e-03 | 3.01e-02 | 29 |
| GO:00703723 | Cervix | CC | regulation of ERK1 and ERK2 cascade | 54/2311 | 309/18723 | 5.11e-03 | 3.02e-02 | 54 |
| GO:00347645 | Cervix | CC | positive regulation of transmembrane transport | 40/2311 | 219/18723 | 6.97e-03 | 3.76e-02 | 40 |
| GO:0090150 | Colorectum | AD | establishment of protein localization to membrane | 100/3918 | 260/18723 | 6.01e-11 | 6.33e-09 | 100 |
| GO:0038127 | Colorectum | AD | ERBB signaling pathway | 55/3918 | 121/18723 | 1.19e-09 | 8.85e-08 | 55 |
| GO:0007173 | Colorectum | AD | epidermal growth factor receptor signaling pathway | 50/3918 | 108/18723 | 3.08e-09 | 2.07e-07 | 50 |
| GO:0044262 | Colorectum | AD | cellular carbohydrate metabolic process | 87/3918 | 283/18723 | 6.00e-05 | 1.01e-03 | 87 |
| GO:0010038 | Colorectum | AD | response to metal ion | 106/3918 | 373/18723 | 3.22e-04 | 3.83e-03 | 106 |
| GO:0071248 | Colorectum | AD | cellular response to metal ion | 61/3918 | 197/18723 | 5.74e-04 | 6.09e-03 | 61 |
| GO:0071241 | Colorectum | AD | cellular response to inorganic substance | 68/3918 | 226/18723 | 6.98e-04 | 7.10e-03 | 68 |
| GO:0018105 | Colorectum | AD | peptidyl-serine phosphorylation | 88/3918 | 315/18723 | 1.73e-03 | 1.43e-02 | 88 |
| Page: 1 2 3 4 5 6 7 8 9 |
| Pathway ID | Tissue | Disease Stage | Description | Gene Ratio | Bg Ratio | pvalue | p.adjust | qvalue | Count |
| hsa0520820 | Cervix | CC | Chemical carcinogenesis - reactive oxygen species | 92/1267 | 223/8465 | 4.71e-22 | 5.09e-20 | 3.01e-20 | 92 |
| hsa0501018 | Cervix | CC | Alzheimer disease | 113/1267 | 384/8465 | 9.67e-14 | 3.92e-12 | 2.32e-12 | 113 |
| hsa0502218 | Cervix | CC | Pathways of neurodegeneration - multiple diseases | 128/1267 | 476/8465 | 2.87e-12 | 9.29e-11 | 5.50e-11 | 128 |
| hsa0520516 | Cervix | CC | Proteoglycans in cancer | 60/1267 | 205/8465 | 9.13e-08 | 1.18e-06 | 7.00e-07 | 60 |
| hsa0451010 | Cervix | CC | Focal adhesion | 59/1267 | 203/8465 | 1.53e-07 | 1.84e-06 | 1.09e-06 | 59 |
| hsa0481016 | Cervix | CC | Regulation of actin cytoskeleton | 64/1267 | 229/8465 | 2.24e-07 | 2.59e-06 | 1.53e-06 | 64 |
| hsa0401512 | Cervix | CC | Rap1 signaling pathway | 56/1267 | 210/8465 | 6.23e-06 | 5.61e-05 | 3.32e-05 | 56 |
| hsa0401210 | Cervix | CC | ErbB signaling pathway | 28/1267 | 85/8465 | 2.40e-05 | 1.82e-04 | 1.08e-04 | 28 |
| hsa0521010 | Cervix | CC | Colorectal cancer | 27/1267 | 86/8465 | 8.60e-05 | 5.57e-04 | 3.30e-04 | 27 |
| hsa052197 | Cervix | CC | Bladder cancer | 16/1267 | 41/8465 | 1.45e-04 | 9.05e-04 | 5.35e-04 | 16 |
| hsa052148 | Cervix | CC | Glioma | 24/1267 | 75/8465 | 1.51e-04 | 9.20e-04 | 5.44e-04 | 24 |
| hsa052128 | Cervix | CC | Pancreatic cancer | 24/1267 | 76/8465 | 1.89e-04 | 1.11e-03 | 6.55e-04 | 24 |
| hsa015223 | Cervix | CC | Endocrine resistance | 28/1267 | 98/8465 | 3.82e-04 | 1.87e-03 | 1.11e-03 | 28 |
| hsa052157 | Cervix | CC | Prostate cancer | 27/1267 | 97/8465 | 7.54e-04 | 3.39e-03 | 2.01e-03 | 27 |
| hsa0521310 | Cervix | CC | Endometrial cancer | 18/1267 | 58/8465 | 1.46e-03 | 6.30e-03 | 3.73e-03 | 18 |
| hsa052234 | Cervix | CC | Non-small cell lung cancer | 21/1267 | 72/8465 | 1.48e-03 | 6.32e-03 | 3.74e-03 | 21 |
| hsa0522510 | Cervix | CC | Hepatocellular carcinoma | 40/1267 | 168/8465 | 1.52e-03 | 6.39e-03 | 3.78e-03 | 40 |
| hsa052119 | Cervix | CC | Renal cell carcinoma | 20/1267 | 69/8465 | 2.07e-03 | 8.17e-03 | 4.83e-03 | 20 |
| hsa0522014 | Cervix | CC | Chronic myeloid leukemia | 21/1267 | 76/8465 | 3.08e-03 | 1.19e-02 | 7.03e-03 | 21 |
| hsa0492812 | Cervix | CC | Parathyroid hormone synthesis, secretion and action | 27/1267 | 106/8465 | 3.12e-03 | 1.19e-02 | 7.03e-03 | 27 |
| Page: 1 2 3 4 5 6 7 8 9 10 11 12 13 14 15 16 17 18 19 20 21 22 23 24 25 26 |
Top |
Cell-cell communication analysis |
| Identification of potential cell-cell interactions between two cell types and their ligand-receptor pairs for different disease states |
| Ligand | Receptor | LRpair | Pathway | Tissue | Disease Stage |
| Page: 1 |
Top |
Single-cell gene regulatory network inference analysis |
| Find out the significant the regulons (TFs) and the target genes of each regulon across cell types for different disease states |
| TF | Cell Type | Tissue | Disease Stage | Target Gene | RSS | Regulon Activity |
| ∗The dot plots of a searched regulon are shown for all cell subpopulations in each disease state of each tissue based on the regulon specific score inferred using pySCENIC and by calculating the average expression. |
| Page: 1 |
Top |
Somatic mutation of malignant transformation related genes |
| Annotation of somatic variants for genes involved in malignant transformation |
| Hugo Symbol | Variant Class | Variant Classification | dbSNP RS | HGVSc | HGVSp | HGVSp Short | SWISSPROT | BIOTYPE | SIFT | PolyPhen | Tumor Sample Barcode | Tissue | Histology | Sex | Age | Stage | Therapy Types | Drugs | Outcome |
| BRAF | SNV | Missense_Mutation | novel | c.335N>G | p.Ser112Cys | p.S112C | P15056 | protein_coding | deleterious(0.04) | possibly_damaging(0.846) | TCGA-5L-AAT1-01 | Breast | breast invasive carcinoma | Female | <65 | III/IV | Hormone Therapy | letrozol | SD |
| BRAF | SNV | Missense_Mutation | c.1345N>A | p.Asp449Asn | p.D449N | P15056 | protein_coding | tolerated(0.67) | possibly_damaging(0.876) | TCGA-AC-A23H-01 | Breast | breast invasive carcinoma | Female | >=65 | I/II | Unknown | Unknown | PD | |
| BRAF | SNV | Missense_Mutation | c.2093A>G | p.Lys698Arg | p.K698R | P15056 | protein_coding | deleterious(0.01) | benign(0.011) | TCGA-AN-A0FN-01 | Breast | breast invasive carcinoma | Female | <65 | I/II | Unknown | Unknown | SD | |
| BRAF | SNV | Missense_Mutation | novel | c.1297N>A | p.Glu433Lys | p.E433K | P15056 | protein_coding | tolerated(0.22) | benign(0.04) | TCGA-D8-A27V-01 | Breast | breast invasive carcinoma | Female | <65 | I/II | Hormone Therapy | tamoxiphen | SD |
| BRAF | SNV | Missense_Mutation | c.1610T>C | p.Leu537Ser | p.L537S | P15056 | protein_coding | deleterious(0) | probably_damaging(1) | TCGA-E2-A150-01 | Breast | breast invasive carcinoma | Female | <65 | I/II | Chemotherapy | doxorubicin | SD | |
| BRAF | SNV | Missense_Mutation | c.1040N>T | p.Arg347Leu | p.R347L | P15056 | protein_coding | tolerated(0.18) | benign(0.224) | TCGA-E2-A1B5-01 | Breast | breast invasive carcinoma | Female | <65 | I/II | Hormone Therapy | tamoxiphen | SD | |
| BRAF | SNV | Missense_Mutation | novel | c.1706N>A | p.Ala569Asp | p.A569D | P15056 | protein_coding | deleterious(0) | benign(0.265) | TCGA-S3-AA10-01 | Breast | breast invasive carcinoma | Female | >=65 | I/II | Chemotherapy | cytoxan | CR |
| BRAF | insertion | Nonsense_Mutation | novel | c.267_268insAATAAGTAACTTGTTCTTGTCCGTCATACTCCCAGTTTAACAATT | p.Leu89_Asp90insAsnLysTerLeuValLeuValArgHisThrProSerLeuThrIle | p.L89_D90insNK*LVLVRHTPSLTI | P15056 | protein_coding | TCGA-A8-A09N-01 | Breast | breast invasive carcinoma | Female | <65 | III/IV | Unknown | Unknown | SD | ||
| BRAF | insertion | Frame_Shift_Ins | novel | c.2146_2147insCACCTCGCCGGCCTGGTTTTTATTT | p.Leu716ProfsTer37 | p.L716Pfs*37 | P15056 | protein_coding | TCGA-AN-A0FN-01 | Breast | breast invasive carcinoma | Female | <65 | I/II | Unknown | Unknown | SD | ||
| BRAF | SNV | Missense_Mutation | c.1202N>T | p.Thr401Ile | p.T401I | P15056 | protein_coding | tolerated(0.08) | benign(0.026) | TCGA-EA-A1QT-01 | Cervix | cervical & endocervical cancer | Female | <65 | I/II | Unknown | Unknown | SD |
| Page: 1 2 3 4 5 6 7 8 9 10 11 12 13 14 15 16 17 18 19 20 21 22 23 24 25 26 27 28 29 30 31 32 33 34 35 36 37 38 39 40 41 42 43 44 45 46 47 48 49 |
Top |
Related drugs of malignant transformation related genes |
| Identification of chemicals and drugs interact with genes involved in malignant transfromation |
| (DGIdb 4.0) |
| Entrez ID | Symbol | Category | Interaction Types | Drug Claim Name | Drug Name | PMIDs |
| 673 | BRAF | KINASE, SERINE THREONINE KINASE, CLINICALLY ACTIONABLE, DRUG RESISTANCE, ENZYME, DRUGGABLE GENOME | TRAMETINIB DIMETHYL SULFOXIDE | 25435907,28480077,28078132 | ||
| 673 | BRAF | KINASE, SERINE THREONINE KINASE, CLINICALLY ACTIONABLE, DRUG RESISTANCE, ENZYME, DRUGGABLE GENOME | DUAL IGF-1R/INSR INHIBITOR BMS-754807 | 25527633 | ||
| 673 | BRAF | KINASE, SERINE THREONINE KINASE, CLINICALLY ACTIONABLE, DRUG RESISTANCE, ENZYME, DRUGGABLE GENOME | AMG 232 | 25567130 | ||
| 673 | BRAF | KINASE, SERINE THREONINE KINASE, CLINICALLY ACTIONABLE, DRUG RESISTANCE, ENZYME, DRUGGABLE GENOME | PLX3397 | PEXIDARTINIB | 25939769 | |
| 673 | BRAF | KINASE, SERINE THREONINE KINASE, CLINICALLY ACTIONABLE, DRUG RESISTANCE, ENZYME, DRUGGABLE GENOME | PLX7904 | 26466569,27523909 | ||
| 673 | BRAF | KINASE, SERINE THREONINE KINASE, CLINICALLY ACTIONABLE, DRUG RESISTANCE, ENZYME, DRUGGABLE GENOME | PLX8394 | PLX8394 | 27834212,24422853 | |
| 673 | BRAF | KINASE, SERINE THREONINE KINASE, CLINICALLY ACTIONABLE, DRUG RESISTANCE, ENZYME, DRUGGABLE GENOME | Vemurafenib | VEMURAFENIB | ||
| 673 | BRAF | KINASE, SERINE THREONINE KINASE, CLINICALLY ACTIONABLE, DRUG RESISTANCE, ENZYME, DRUGGABLE GENOME | Pimasertib | PIMASERTIB | 23629727 | |
| 673 | BRAF | KINASE, SERINE THREONINE KINASE, CLINICALLY ACTIONABLE, DRUG RESISTANCE, ENZYME, DRUGGABLE GENOME | vemurafenib | VEMURAFENIB | ||
| 673 | BRAF | KINASE, SERINE THREONINE KINASE, CLINICALLY ACTIONABLE, DRUG RESISTANCE, ENZYME, DRUGGABLE GENOME | GSK2126458 | OMIPALISIB | 22389471 |
| Page: 1 2 3 4 5 6 7 8 9 10 11 12 13 14 15 16 17 18 19 20 21 22 23 24 25 26 27 28 29 30 |

Copyright 2023-Present -The University of Texas Health Science Center at Houston |