
|
|||||
|
 | |
| |
| |
| |
| |
| |
|
Gene: BPNT1 |
Gene summary for BPNT1 |
| Gene information | Species | Human | Gene symbol | BPNT1 | Gene ID | 10380 |
| Gene name | 3'(2'), 5'-bisphosphate nucleotidase 1 | |
| Gene Alias | HEL20 | |
| Cytomap | 1q41 | |
| Gene Type | protein-coding | GO ID | GO:0005975 | UniProtAcc | O95861 |
Top |
Malignant transformation analysis |
| Identification of the aberrant gene expression in precancerous and cancerous lesions by comparing the gene expression of stem-like cells in diseased tissues with normal stem cells |
| Entrez ID | Symbol | Replicates | Species | Organ | Tissue | Adj P-value | Log2FC | Malignancy |
| 10380 | BPNT1 | HTA11_2487_2000001011 | Human | Colorectum | SER | 8.96e-08 | 4.84e-01 | -0.1808 |
| 10380 | BPNT1 | HTA11_1938_2000001011 | Human | Colorectum | AD | 1.97e-06 | 3.82e-01 | -0.0811 |
| 10380 | BPNT1 | HTA11_347_2000001011 | Human | Colorectum | AD | 1.22e-12 | 4.20e-01 | -0.1954 |
| 10380 | BPNT1 | HTA11_696_2000001011 | Human | Colorectum | AD | 2.70e-04 | 2.54e-01 | -0.1464 |
| 10380 | BPNT1 | LZE4T | Human | Esophagus | ESCC | 1.10e-02 | 5.53e-02 | 0.0811 |
| 10380 | BPNT1 | LZE7T | Human | Esophagus | ESCC | 2.01e-07 | 3.12e-01 | 0.0667 |
| 10380 | BPNT1 | LZE20T | Human | Esophagus | ESCC | 2.98e-03 | 1.64e-01 | 0.0662 |
| 10380 | BPNT1 | LZE22T | Human | Esophagus | ESCC | 4.61e-04 | 2.81e-01 | 0.068 |
| 10380 | BPNT1 | LZE24T | Human | Esophagus | ESCC | 9.91e-08 | 2.11e-01 | 0.0596 |
| 10380 | BPNT1 | P1T-E | Human | Esophagus | ESCC | 7.43e-03 | 2.23e-01 | 0.0875 |
| 10380 | BPNT1 | P2T-E | Human | Esophagus | ESCC | 3.93e-18 | 2.18e-01 | 0.1177 |
| 10380 | BPNT1 | P4T-E | Human | Esophagus | ESCC | 2.69e-13 | 1.87e-01 | 0.1323 |
| 10380 | BPNT1 | P5T-E | Human | Esophagus | ESCC | 5.06e-07 | 1.61e-01 | 0.1327 |
| 10380 | BPNT1 | P8T-E | Human | Esophagus | ESCC | 3.79e-18 | 2.08e-01 | 0.0889 |
| 10380 | BPNT1 | P9T-E | Human | Esophagus | ESCC | 2.43e-04 | 6.01e-02 | 0.1131 |
| 10380 | BPNT1 | P10T-E | Human | Esophagus | ESCC | 1.09e-11 | 1.71e-01 | 0.116 |
| 10380 | BPNT1 | P11T-E | Human | Esophagus | ESCC | 1.37e-10 | 2.67e-01 | 0.1426 |
| 10380 | BPNT1 | P12T-E | Human | Esophagus | ESCC | 3.55e-06 | 1.52e-01 | 0.1122 |
| 10380 | BPNT1 | P15T-E | Human | Esophagus | ESCC | 4.02e-15 | 2.35e-01 | 0.1149 |
| 10380 | BPNT1 | P16T-E | Human | Esophagus | ESCC | 4.67e-10 | 2.00e-01 | 0.1153 |
| Page: 1 2 3 4 5 |
| Tissue | Expression Dynamics | Abbreviation |
| Colorectum (GSE201348) |  | FAP: Familial adenomatous polyposis |
| CRC: Colorectal cancer | ||
| Colorectum (HTA11) |  | AD: Adenomas |
| SER: Sessile serrated lesions | ||
| MSI-H: Microsatellite-high colorectal cancer | ||
| MSS: Microsatellite stable colorectal cancer | ||
| Esophagus | 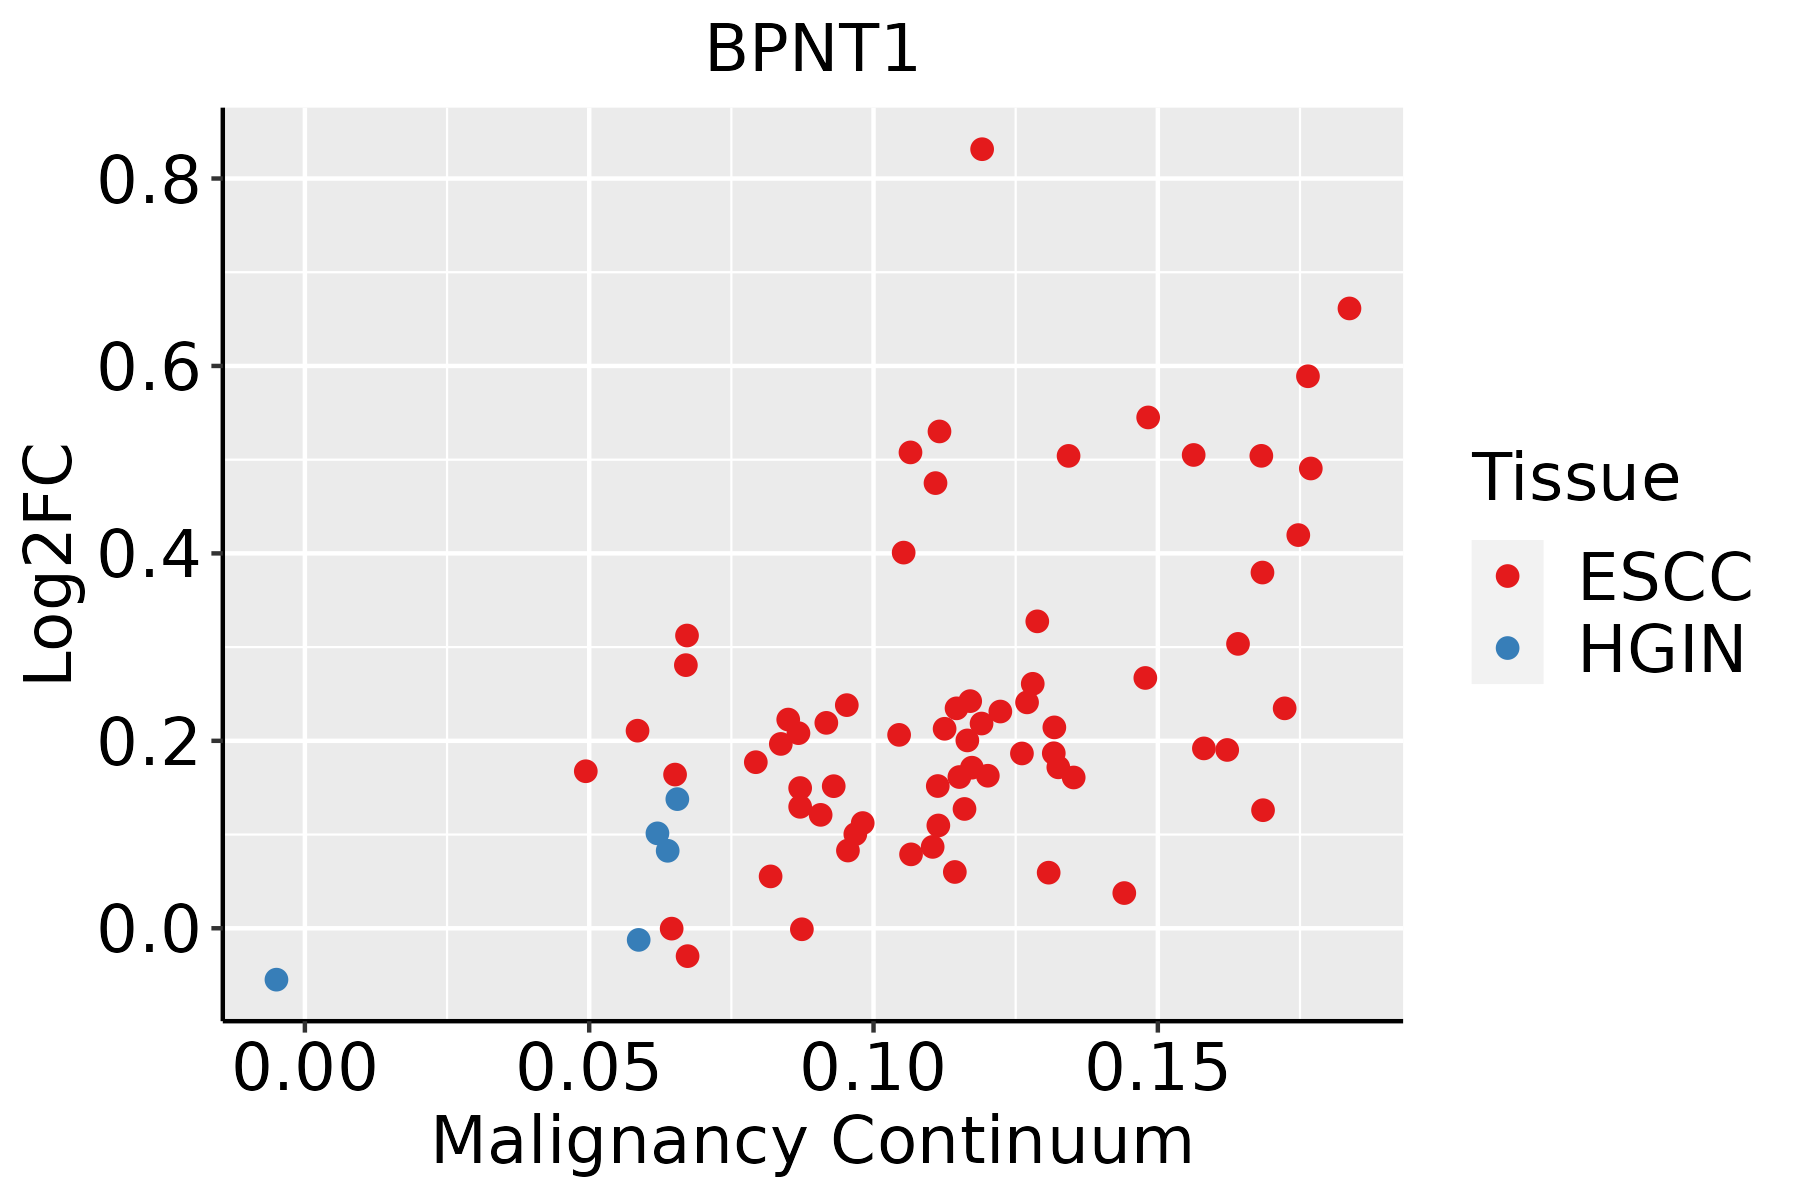 | ESCC: Esophageal squamous cell carcinoma |
| HGIN: High-grade intraepithelial neoplasias | ||
| LGIN: Low-grade intraepithelial neoplasias | ||
| Liver |  | HCC: Hepatocellular carcinoma |
| NAFLD: Non-alcoholic fatty liver disease | ||
| Oral Cavity | 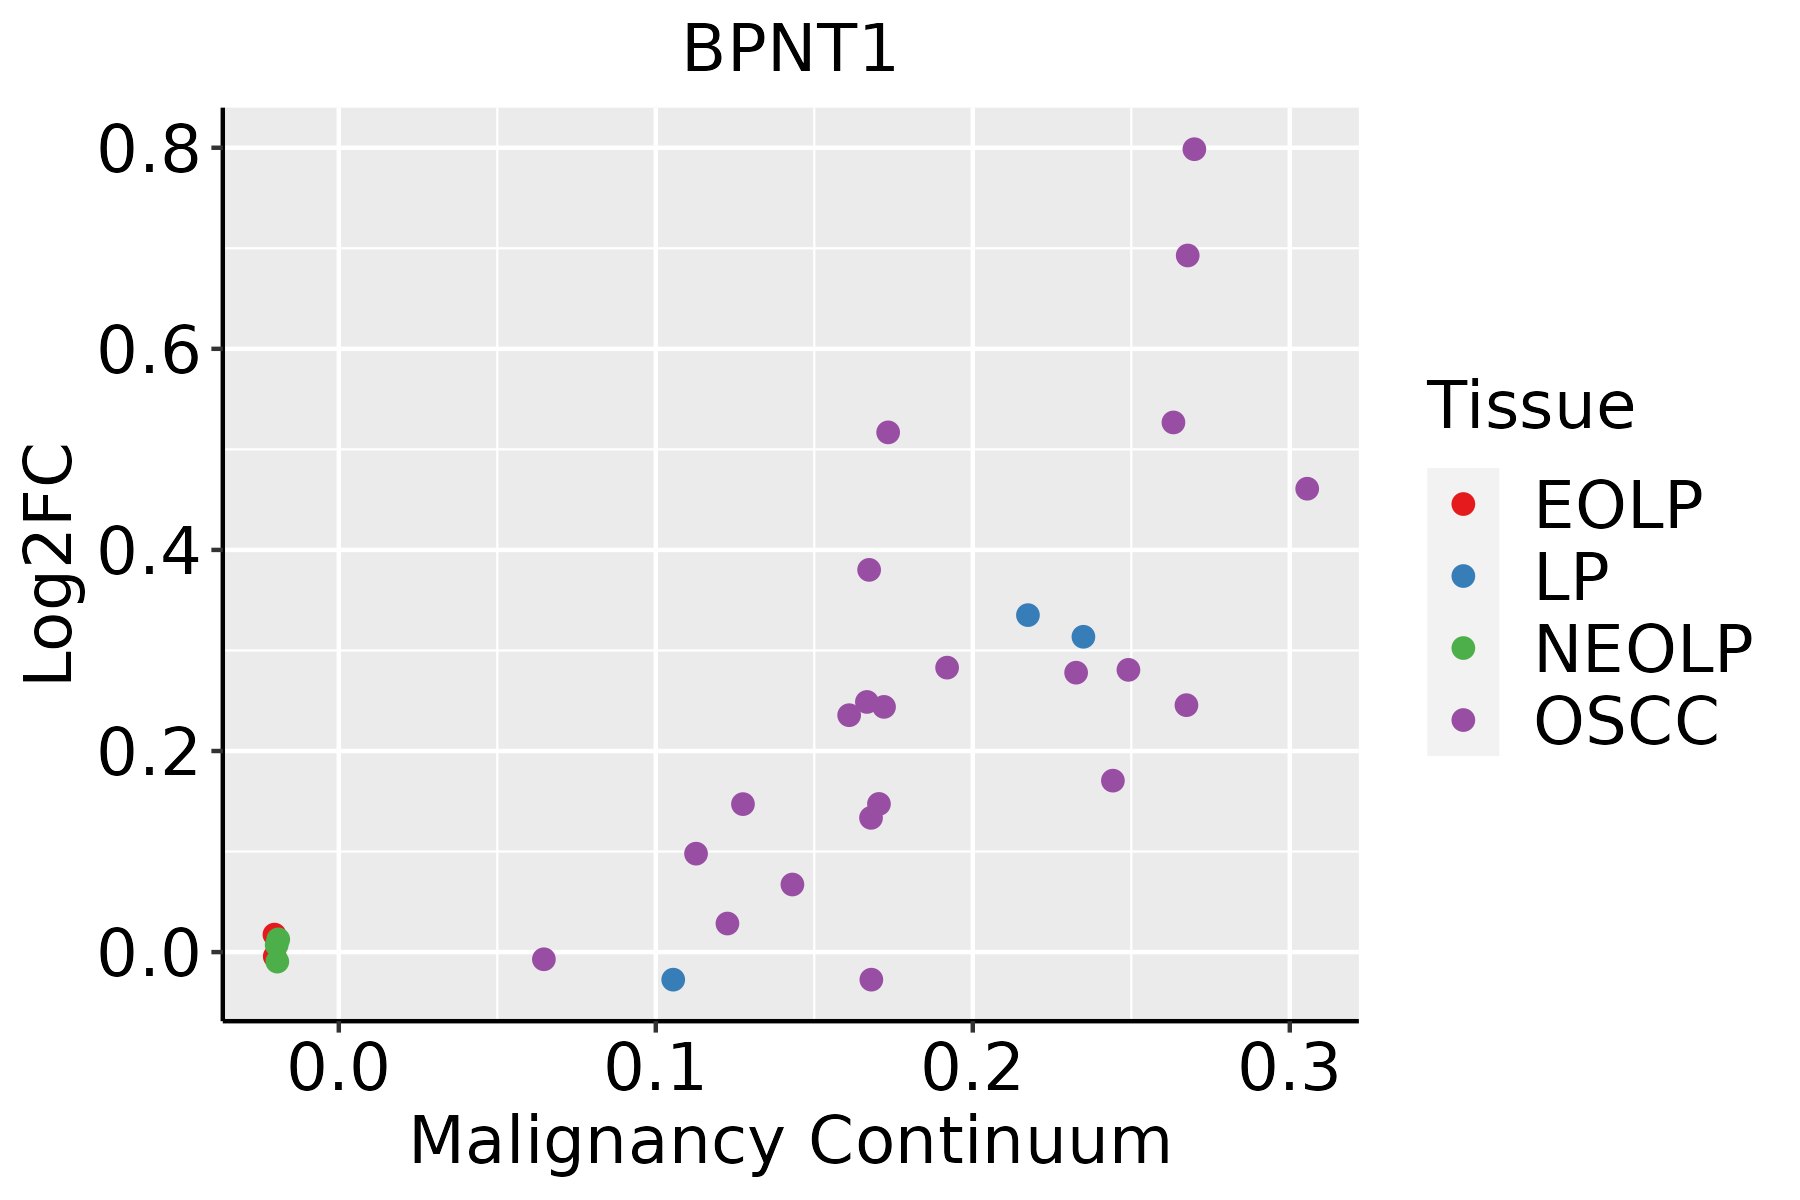 | EOLP: Erosive Oral lichen planus |
| LP: leukoplakia | ||
| NEOLP: Non-erosive oral lichen planus | ||
| OSCC: Oral squamous cell carcinoma |
| ∗log2FC in expression of this searched gene in stem-like cells from each diseased tissue sample relative to stem-like cells in normal samples in each tissue plotted against the malignancy continuum. Samples are colored based on if they are from different disease stage. |
Top |
Malignant transformation related pathway analysis |
| Find out the enriched GO biological processes and KEGG pathways involved in transition from healthy to precancer to cancer |
| Tissue | Disease Stage | Enriched GO biological Processes |
| Colorectum | AD |  |
| Colorectum | SER |  |
| Colorectum | MSS |  |
| Colorectum | MSI-H |  |
| Colorectum | FAP |  |
| ∗Top 15 enriched GO BP terms are showed in the bar plot of each disease state in each tissue. Each row represents a significant GO biological process which is colored according to the -log10(p.adjust). |
| Page: 1 2 3 4 5 6 7 8 9 |
| GO ID | Tissue | Disease Stage | Description | Gene Ratio | Bg Ratio | pvalue | p.adjust | Count |
| GO:0009150 | Colorectum | AD | purine ribonucleotide metabolic process | 142/3918 | 368/18723 | 4.29e-15 | 1.17e-12 | 142 |
| GO:0006163 | Colorectum | AD | purine nucleotide metabolic process | 149/3918 | 396/18723 | 1.08e-14 | 2.80e-12 | 149 |
| GO:0072521 | Colorectum | AD | purine-containing compound metabolic process | 153/3918 | 416/18723 | 4.34e-14 | 1.01e-11 | 153 |
| GO:0009259 | Colorectum | AD | ribonucleotide metabolic process | 144/3918 | 385/18723 | 5.25e-14 | 1.13e-11 | 144 |
| GO:0019693 | Colorectum | AD | ribose phosphate metabolic process | 145/3918 | 396/18723 | 3.01e-13 | 5.71e-11 | 145 |
| GO:0009117 | Colorectum | AD | nucleotide metabolic process | 168/3918 | 489/18723 | 2.20e-12 | 3.36e-10 | 168 |
| GO:0006753 | Colorectum | AD | nucleoside phosphate metabolic process | 169/3918 | 497/18723 | 4.99e-12 | 6.98e-10 | 169 |
| GO:0044282 | Colorectum | AD | small molecule catabolic process | 118/3918 | 376/18723 | 1.05e-06 | 3.55e-05 | 118 |
| GO:0016311 | Colorectum | AD | dephosphorylation | 123/3918 | 417/18723 | 1.84e-05 | 3.82e-04 | 123 |
| GO:0006066 | Colorectum | AD | alcohol metabolic process | 106/3918 | 353/18723 | 3.02e-05 | 5.57e-04 | 106 |
| GO:0044262 | Colorectum | AD | cellular carbohydrate metabolic process | 87/3918 | 283/18723 | 6.00e-05 | 1.01e-03 | 87 |
| GO:0006790 | Colorectum | AD | sulfur compound metabolic process | 101/3918 | 339/18723 | 6.46e-05 | 1.07e-03 | 101 |
| GO:0033865 | Colorectum | AD | nucleoside bisphosphate metabolic process | 42/3918 | 128/18723 | 1.12e-03 | 1.02e-02 | 42 |
| GO:0033875 | Colorectum | AD | ribonucleoside bisphosphate metabolic process | 42/3918 | 128/18723 | 1.12e-03 | 1.02e-02 | 42 |
| GO:0034032 | Colorectum | AD | purine nucleoside bisphosphate metabolic process | 42/3918 | 128/18723 | 1.12e-03 | 1.02e-02 | 42 |
| GO:0034035 | Colorectum | AD | purine ribonucleoside bisphosphate metabolic process | 11/3918 | 21/18723 | 1.43e-03 | 1.22e-02 | 11 |
| GO:0050427 | Colorectum | AD | 3'-phosphoadenosine 5'-phosphosulfate metabolic process | 11/3918 | 21/18723 | 1.43e-03 | 1.22e-02 | 11 |
| GO:0006650 | Colorectum | AD | glycerophospholipid metabolic process | 83/3918 | 306/18723 | 5.40e-03 | 3.55e-02 | 83 |
| GO:0006644 | Colorectum | AD | phospholipid metabolic process | 101/3918 | 383/18723 | 5.80e-03 | 3.67e-02 | 101 |
| GO:0046164 | Colorectum | AD | alcohol catabolic process | 20/3918 | 55/18723 | 6.03e-03 | 3.78e-02 | 20 |
| Page: 1 2 3 4 5 6 |
| Pathway ID | Tissue | Disease Stage | Description | Gene Ratio | Bg Ratio | pvalue | p.adjust | qvalue | Count |
| hsa00920 | Colorectum | AD | Sulfur metabolism | 8/2092 | 10/8465 | 3.78e-04 | 2.82e-03 | 1.80e-03 | 8 |
| hsa009201 | Colorectum | AD | Sulfur metabolism | 8/2092 | 10/8465 | 3.78e-04 | 2.82e-03 | 1.80e-03 | 8 |
| hsa0092010 | Esophagus | ESCC | Sulfur metabolism | 9/4205 | 10/8465 | 1.01e-02 | 2.38e-02 | 1.22e-02 | 9 |
| hsa0092011 | Esophagus | ESCC | Sulfur metabolism | 9/4205 | 10/8465 | 1.01e-02 | 2.38e-02 | 1.22e-02 | 9 |
| Page: 1 |
Top |
Cell-cell communication analysis |
| Identification of potential cell-cell interactions between two cell types and their ligand-receptor pairs for different disease states |
| Ligand | Receptor | LRpair | Pathway | Tissue | Disease Stage |
| Page: 1 |
Top |
Single-cell gene regulatory network inference analysis |
| Find out the significant the regulons (TFs) and the target genes of each regulon across cell types for different disease states |
| TF | Cell Type | Tissue | Disease Stage | Target Gene | RSS | Regulon Activity |
| ∗The dot plots of a searched regulon are shown for all cell subpopulations in each disease state of each tissue based on the regulon specific score inferred using pySCENIC and by calculating the average expression. |
| Page: 1 |
Top |
Somatic mutation of malignant transformation related genes |
| Annotation of somatic variants for genes involved in malignant transformation |
| Hugo Symbol | Variant Class | Variant Classification | dbSNP RS | HGVSc | HGVSp | HGVSp Short | SWISSPROT | BIOTYPE | SIFT | PolyPhen | Tumor Sample Barcode | Tissue | Histology | Sex | Age | Stage | Therapy Types | Drugs | Outcome |
| BPNT1 | SNV | Missense_Mutation | c.352N>T | p.Pro118Ser | p.P118S | O95861 | protein_coding | deleterious(0) | probably_damaging(0.999) | TCGA-A8-A06Q-01 | Breast | breast invasive carcinoma | Female | <65 | III/IV | Unknown | Unknown | SD | |
| BPNT1 | SNV | Missense_Mutation | novel | c.689N>G | p.Glu230Gly | p.E230G | O95861 | protein_coding | deleterious(0) | probably_damaging(0.997) | TCGA-AC-A2QI-01 | Breast | breast invasive carcinoma | Female | >=65 | III/IV | Chemotherapy | cytoxan | CR |
| BPNT1 | SNV | Missense_Mutation | novel | c.732N>C | p.Lys244Asn | p.K244N | O95861 | protein_coding | deleterious(0) | probably_damaging(0.996) | TCGA-MY-A5BF-01 | Cervix | cervical & endocervical cancer | Female | >=65 | I/II | Chemotherapy | cisplatin | CR |
| BPNT1 | SNV | Missense_Mutation | rs760682156 | c.790N>A | p.Asp264Asn | p.D264N | O95861 | protein_coding | tolerated(0.07) | probably_damaging(0.977) | TCGA-AA-3984-01 | Colorectum | colon adenocarcinoma | Female | <65 | I/II | Unknown | Unknown | SD |
| BPNT1 | SNV | Missense_Mutation | rs776487679 | c.155N>A | p.Arg52Gln | p.R52Q | O95861 | protein_coding | deleterious(0) | probably_damaging(0.995) | TCGA-AY-6197-01 | Colorectum | colon adenocarcinoma | Male | <65 | I/II | Unknown | Unknown | SD |
| BPNT1 | SNV | Missense_Mutation | rs776487679 | c.155N>A | p.Arg52Gln | p.R52Q | O95861 | protein_coding | deleterious(0) | probably_damaging(0.995) | TCGA-CA-6717-01 | Colorectum | colon adenocarcinoma | Male | <65 | I/II | Chemotherapy | oxaliplatin | CR |
| BPNT1 | SNV | Missense_Mutation | novel | c.56C>T | p.Ala19Val | p.A19V | O95861 | protein_coding | deleterious(0.04) | possibly_damaging(0.818) | TCGA-CK-5913-01 | Colorectum | colon adenocarcinoma | Female | <65 | I/II | Unknown | Unknown | SD |
| BPNT1 | SNV | Missense_Mutation | c.82N>T | p.Arg28Cys | p.R28C | O95861 | protein_coding | deleterious(0.01) | benign(0.001) | TCGA-G4-6588-01 | Colorectum | colon adenocarcinoma | Female | <65 | I/II | Unknown | Unknown | SD | |
| BPNT1 | SNV | Missense_Mutation | novel | c.372N>C | p.Glu124Asp | p.E124D | O95861 | protein_coding | deleterious(0.03) | possibly_damaging(0.773) | TCGA-A5-A0G2-01 | Endometrium | uterine corpus endometrioid carcinoma | Female | <65 | III/IV | Unknown | Unknown | SD |
| BPNT1 | SNV | Missense_Mutation | c.82C>T | p.Arg28Cys | p.R28C | O95861 | protein_coding | deleterious(0.01) | benign(0.001) | TCGA-AP-A051-01 | Endometrium | uterine corpus endometrioid carcinoma | Female | >=65 | I/II | Unknown | Unknown | SD |
| Page: 1 2 3 4 |
Top |
Related drugs of malignant transformation related genes |
| Identification of chemicals and drugs interact with genes involved in malignant transfromation |
| (DGIdb 4.0) |
| Entrez ID | Symbol | Category | Interaction Types | Drug Claim Name | Drug Name | PMIDs |
| Page: 1 |

Copyright 2023-Present -The University of Texas Health Science Center at Houston |