
|
|||||
|
 | |
| |
| |
| |
| |
| |
|
Gene: BPIFB1 |
Gene summary for BPIFB1 |
| Gene information | Species | Human | Gene symbol | BPIFB1 | Gene ID | 92747 |
| Gene name | BPI fold containing family B member 1 | |
| Gene Alias | C20orf114 | |
| Cytomap | 20q11.21 | |
| Gene Type | protein-coding | GO ID | GO:0002221 | UniProtAcc | Q8TDL5 |
Top |
Malignant transformation analysis |
| Identification of the aberrant gene expression in precancerous and cancerous lesions by comparing the gene expression of stem-like cells in diseased tissues with normal stem cells |
| Entrez ID | Symbol | Replicates | Species | Organ | Tissue | Adj P-value | Log2FC | Malignancy |
| 92747 | BPIFB1 | CA_HPV_1 | Human | Cervix | CC | 4.88e-24 | -6.78e-01 | 0.0264 |
| 92747 | BPIFB1 | CA_HPV_2 | Human | Cervix | CC | 1.95e-18 | -6.39e-01 | 0.0391 |
| 92747 | BPIFB1 | CA_HPV_3 | Human | Cervix | CC | 1.18e-12 | -6.32e-01 | 0.0414 |
| 92747 | BPIFB1 | HSIL_HPV_1 | Human | Cervix | HSIL_HPV | 6.32e-11 | -6.07e-01 | 0.0116 |
| 92747 | BPIFB1 | HSIL_HPV_2 | Human | Cervix | HSIL_HPV | 3.58e-12 | -5.85e-01 | 0.0208 |
| 92747 | BPIFB1 | N_HPV_1 | Human | Cervix | N_HPV | 5.37e-05 | -5.17e-01 | 0.0079 |
| 92747 | BPIFB1 | N_HPV_2 | Human | Cervix | N_HPV | 4.90e-05 | -5.04e-01 | -0.0131 |
| 92747 | BPIFB1 | CCI_1 | Human | Cervix | CC | 6.18e-06 | -6.78e-01 | 0.528 |
| 92747 | BPIFB1 | CCI_2 | Human | Cervix | CC | 2.44e-05 | -6.78e-01 | 0.5249 |
| 92747 | BPIFB1 | CCI_3 | Human | Cervix | CC | 2.45e-08 | -6.78e-01 | 0.516 |
| 92747 | BPIFB1 | CCII_1 | Human | Cervix | CC | 5.08e-12 | -6.78e-01 | 0.3249 |
| 92747 | BPIFB1 | Tumor | Human | Cervix | CC | 4.88e-24 | -6.78e-01 | 0.1241 |
| 92747 | BPIFB1 | sample1 | Human | Cervix | CC | 1.89e-07 | -6.37e-01 | 0.0959 |
| 92747 | BPIFB1 | sample3 | Human | Cervix | CC | 2.75e-23 | -6.78e-01 | 0.1387 |
| 92747 | BPIFB1 | H2 | Human | Cervix | HSIL_HPV | 1.84e-30 | 8.72e-01 | 0.0632 |
| 92747 | BPIFB1 | L1 | Human | Cervix | CC | 2.67e-13 | -6.78e-01 | 0.0802 |
| 92747 | BPIFB1 | T1 | Human | Cervix | CC | 1.16e-22 | -6.78e-01 | 0.0918 |
| 92747 | BPIFB1 | T2 | Human | Cervix | CC | 2.01e-06 | 8.48e-01 | 0.0709 |
| 92747 | BPIFB1 | T3 | Human | Cervix | CC | 2.05e-24 | -6.78e-01 | 0.1389 |
| 92747 | BPIFB1 | C09 | Human | Oral cavity | OSCC | 5.71e-30 | 1.66e+00 | 0.1431 |
| Page: 1 2 |
| Tissue | Expression Dynamics | Abbreviation |
| Cervix | 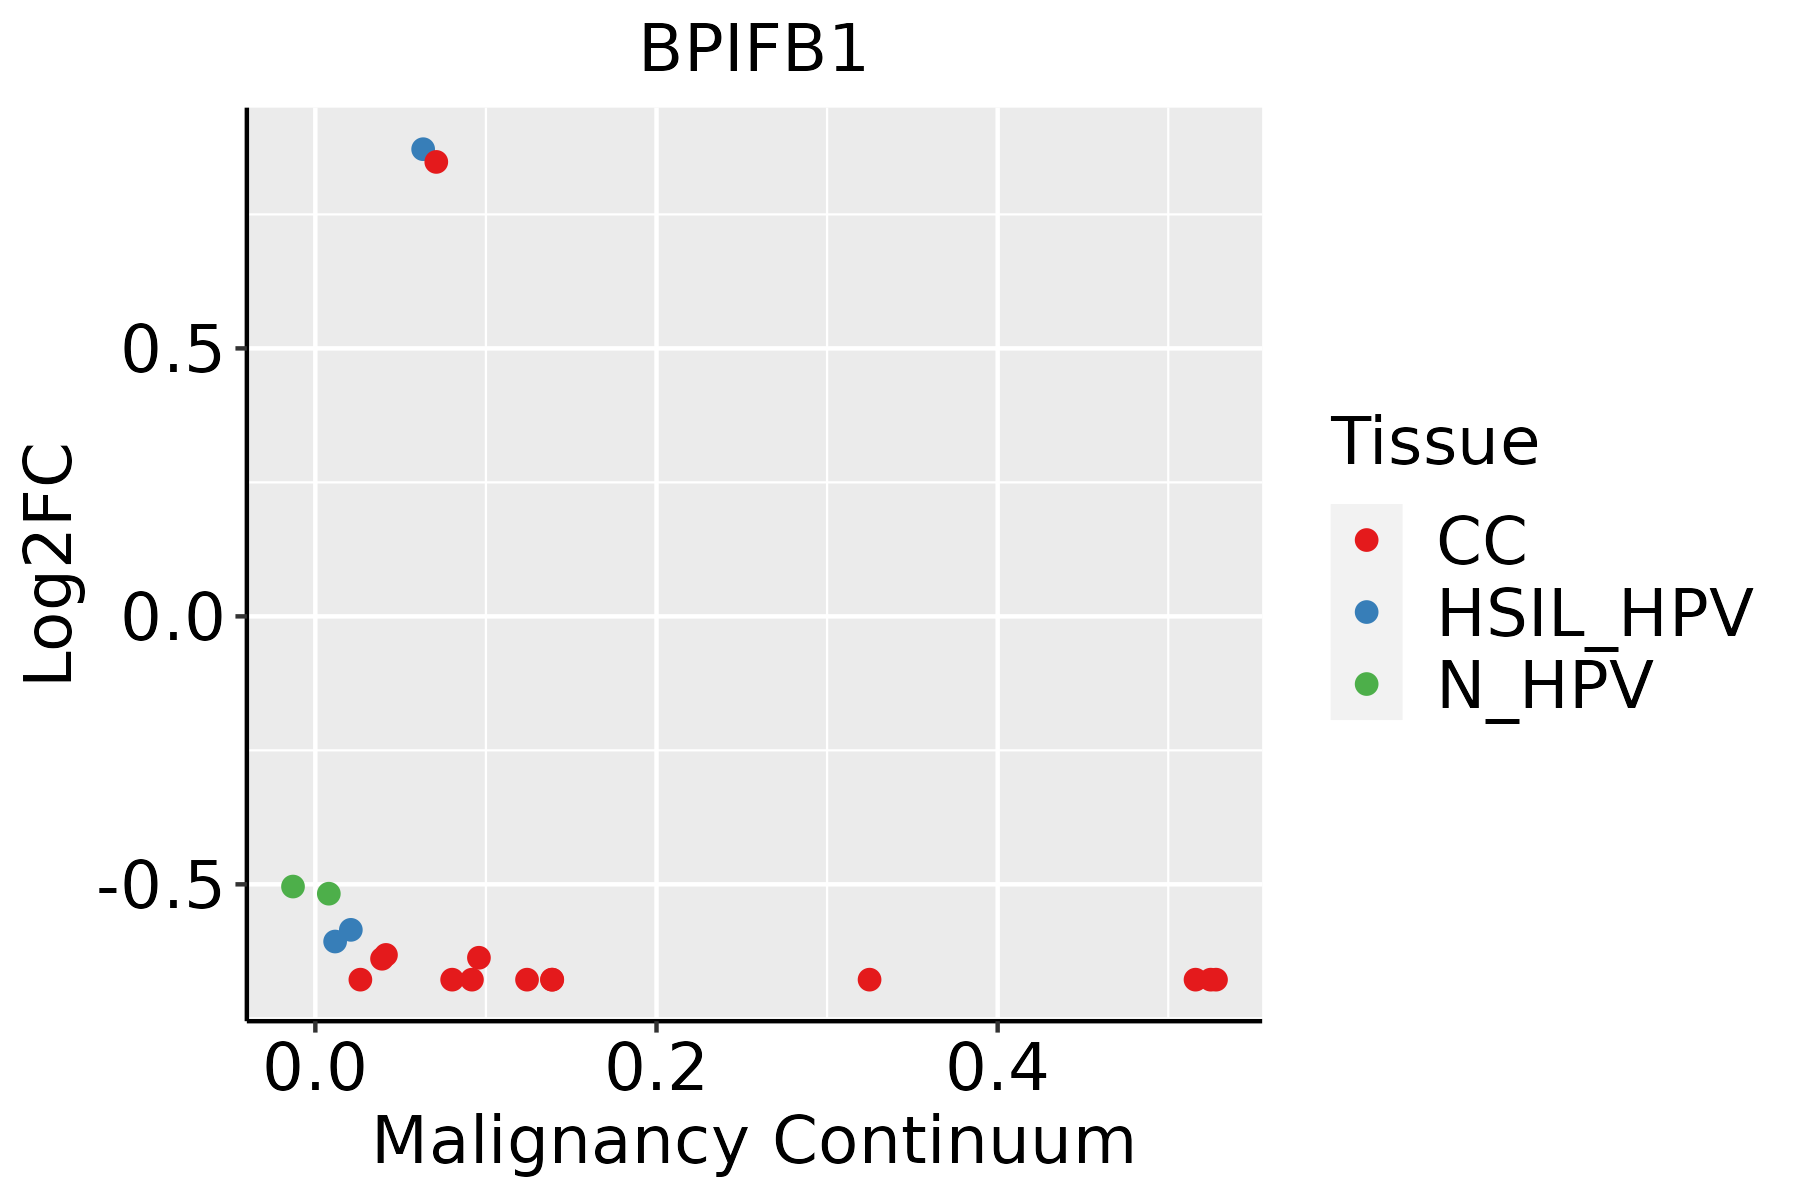 | CC: Cervix cancer |
| HSIL_HPV: HPV-infected high-grade squamous intraepithelial lesions | ||
| N_HPV: HPV-infected normal cervix | ||
| GC |  | CAG: Chronic atrophic gastritis |
| CAG with IM: Chronic atrophic gastritis with intestinal metaplasia | ||
| CSG: Chronic superficial gastritis | ||
| GC: Gastric cancer | ||
| SIM: Severe intestinal metaplasia | ||
| WIM: Wild intestinal metaplasia | ||
| Oral Cavity | 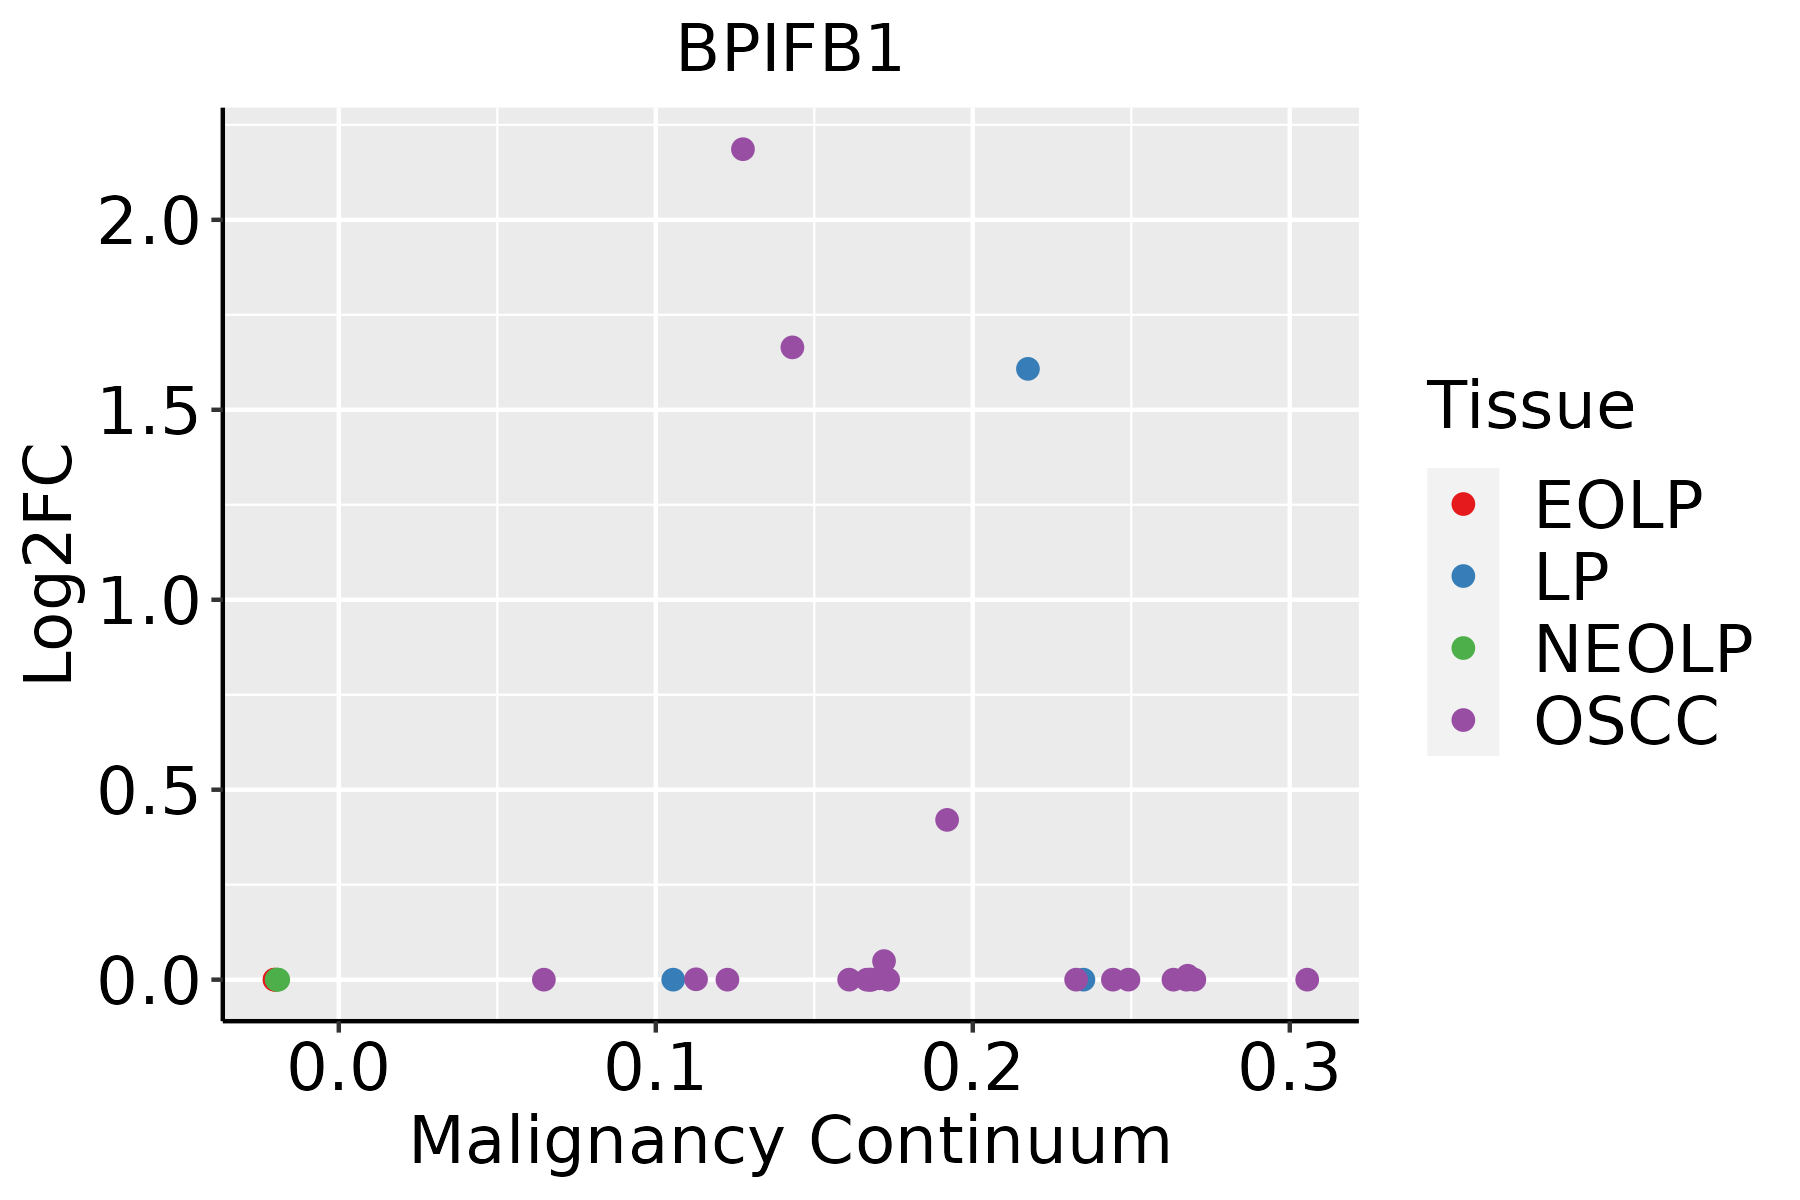 | EOLP: Erosive Oral lichen planus |
| LP: leukoplakia | ||
| NEOLP: Non-erosive oral lichen planus | ||
| OSCC: Oral squamous cell carcinoma | ||
| Prostate | 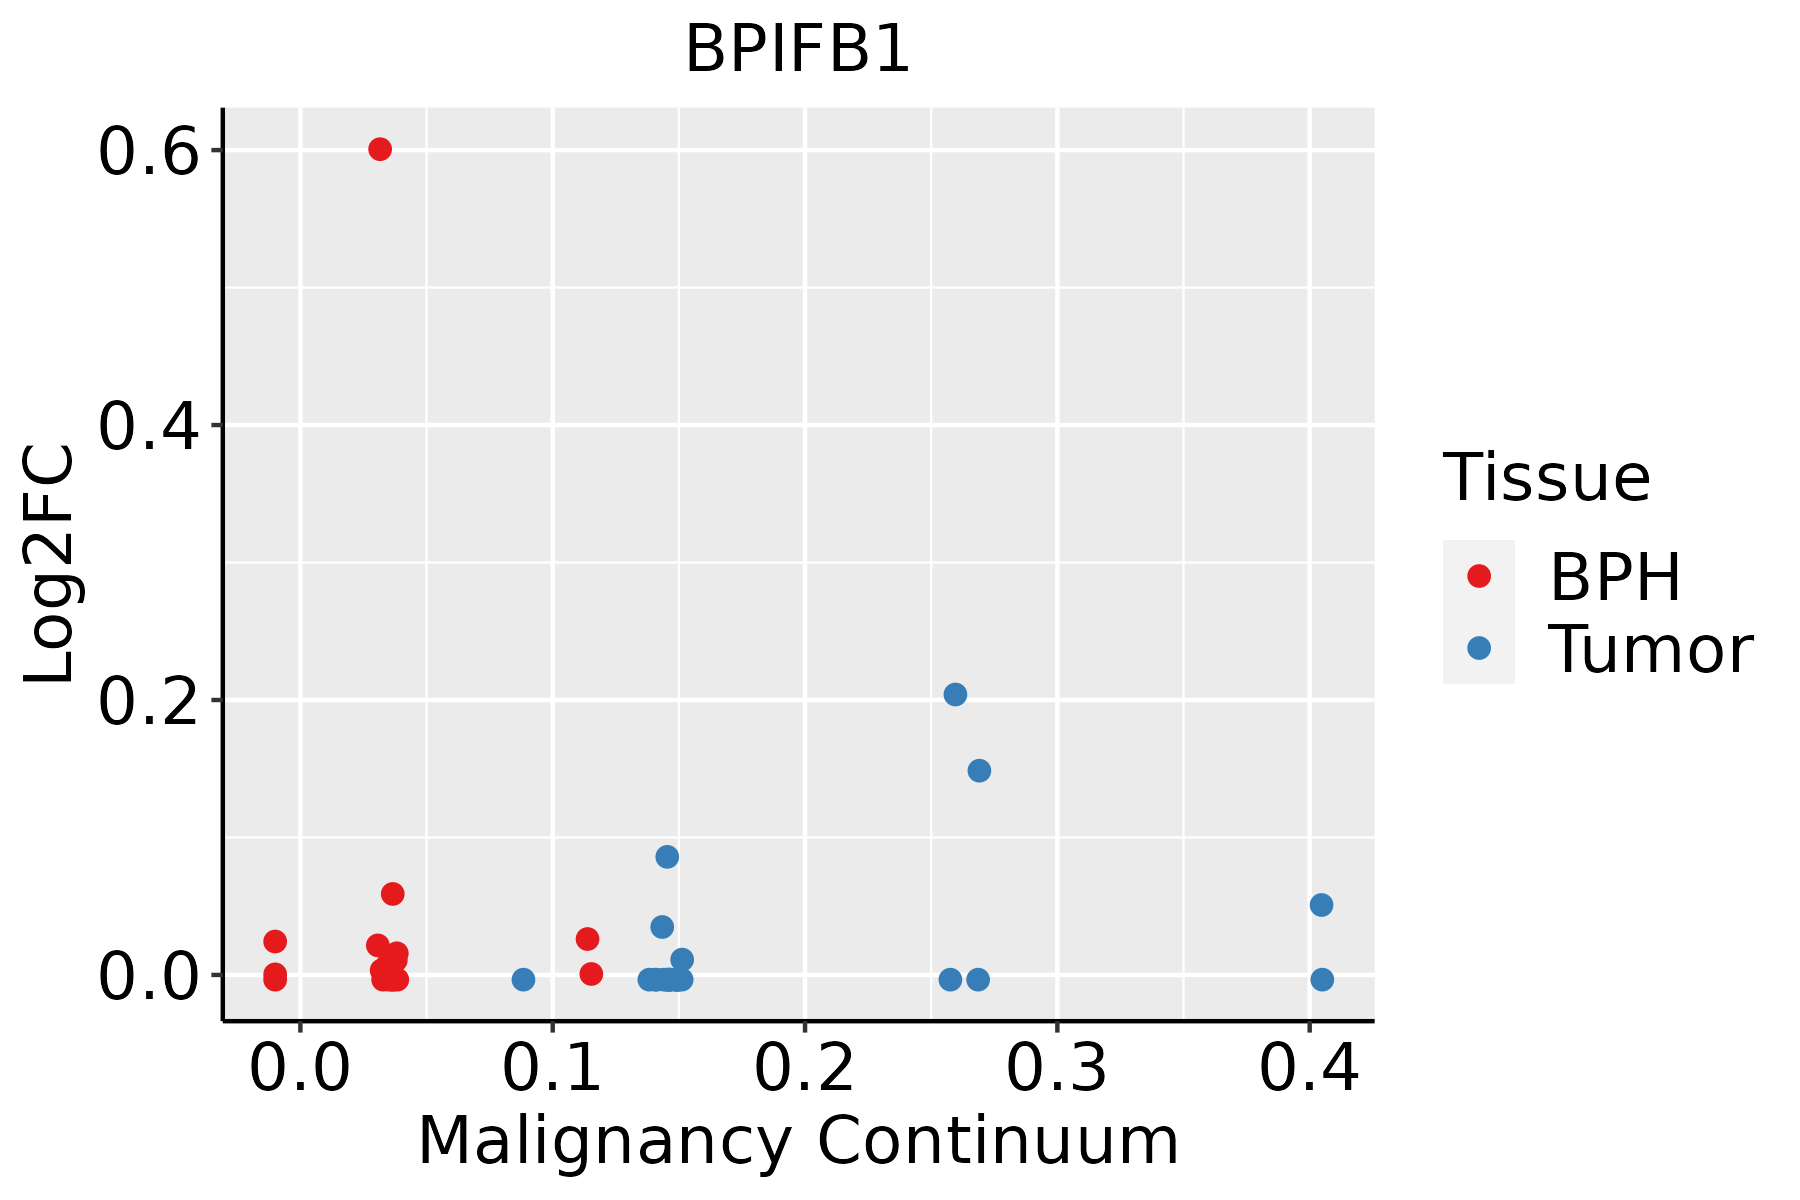 | BPH: Benign Prostatic Hyperplasia |
| ∗log2FC in expression of this searched gene in stem-like cells from each diseased tissue sample relative to stem-like cells in normal samples in each tissue plotted against the malignancy continuum. Samples are colored based on if they are from different disease stage. |
Top |
Malignant transformation related pathway analysis |
| Find out the enriched GO biological processes and KEGG pathways involved in transition from healthy to precancer to cancer |
| Tissue | Disease Stage | Enriched GO biological Processes |
| Colorectum | AD |  |
| Colorectum | SER |  |
| Colorectum | MSS |  |
| Colorectum | MSI-H |  |
| Colorectum | FAP |  |
| ∗Top 15 enriched GO BP terms are showed in the bar plot of each disease state in each tissue. Each row represents a significant GO biological process which is colored according to the -log10(p.adjust). |
| Page: 1 2 3 4 5 6 7 8 9 |
| GO ID | Tissue | Disease Stage | Description | Gene Ratio | Bg Ratio | pvalue | p.adjust | Count |
| GO:00027644 | Cervix | CC | immune response-regulating signaling pathway | 97/2311 | 468/18723 | 1.49e-07 | 7.07e-06 | 97 |
| GO:00022212 | Cervix | CC | pattern recognition receptor signaling pathway | 39/2311 | 172/18723 | 1.08e-04 | 1.38e-03 | 39 |
| GO:00622073 | Cervix | CC | regulation of pattern recognition receptor signaling pathway | 27/2311 | 105/18723 | 1.37e-04 | 1.68e-03 | 27 |
| GO:00341432 | Cervix | CC | regulation of toll-like receptor 4 signaling pathway | 9/2311 | 27/18723 | 3.82e-03 | 2.41e-02 | 9 |
| GO:00341423 | Cervix | CC | toll-like receptor 4 signaling pathway | 12/2311 | 43/18723 | 4.71e-03 | 2.83e-02 | 12 |
| GO:0034121 | Cervix | CC | regulation of toll-like receptor signaling pathway | 17/2311 | 75/18723 | 8.87e-03 | 4.53e-02 | 17 |
| GO:000276411 | Cervix | HSIL_HPV | immune response-regulating signaling pathway | 46/737 | 468/18723 | 1.17e-08 | 1.30e-06 | 46 |
| GO:006220711 | Cervix | HSIL_HPV | regulation of pattern recognition receptor signaling pathway | 11/737 | 105/18723 | 2.82e-03 | 2.67e-02 | 11 |
| GO:003414211 | Cervix | HSIL_HPV | toll-like receptor 4 signaling pathway | 6/737 | 43/18723 | 6.42e-03 | 4.97e-02 | 6 |
| GO:000276421 | Cervix | N_HPV | immune response-regulating signaling pathway | 36/534 | 468/18723 | 7.52e-08 | 7.81e-06 | 36 |
| GO:003414221 | Cervix | N_HPV | toll-like receptor 4 signaling pathway | 6/534 | 43/18723 | 1.30e-03 | 1.42e-02 | 6 |
| GO:00022241 | Cervix | N_HPV | toll-like receptor signaling pathway | 10/534 | 121/18723 | 2.45e-03 | 2.21e-02 | 10 |
| GO:000222111 | Cervix | N_HPV | pattern recognition receptor signaling pathway | 12/534 | 172/18723 | 3.92e-03 | 3.08e-02 | 12 |
| GO:0002385 | Cervix | N_HPV | mucosal immune response | 5/534 | 38/18723 | 4.27e-03 | 3.26e-02 | 5 |
| GO:0034144 | Cervix | N_HPV | negative regulation of toll-like receptor 4 signaling pathway | 3/534 | 13/18723 | 5.33e-03 | 3.84e-02 | 3 |
| GO:0002251 | Cervix | N_HPV | organ or tissue specific immune response | 5/534 | 41/18723 | 5.95e-03 | 4.16e-02 | 5 |
| GO:0002227 | Cervix | N_HPV | innate immune response in mucosa | 4/534 | 27/18723 | 6.82e-03 | 4.53e-02 | 4 |
| GO:00341431 | Cervix | N_HPV | regulation of toll-like receptor 4 signaling pathway | 4/534 | 27/18723 | 6.82e-03 | 4.53e-02 | 4 |
| GO:00022214 | Oral cavity | OSCC | pattern recognition receptor signaling pathway | 95/7305 | 172/18723 | 1.11e-05 | 1.15e-04 | 95 |
| GO:00622076 | Oral cavity | OSCC | regulation of pattern recognition receptor signaling pathway | 56/7305 | 105/18723 | 1.99e-03 | 9.23e-03 | 56 |
| Page: 1 2 |
| Pathway ID | Tissue | Disease Stage | Description | Gene Ratio | Bg Ratio | pvalue | p.adjust | qvalue | Count |
| Page: 1 |
Top |
Cell-cell communication analysis |
| Identification of potential cell-cell interactions between two cell types and their ligand-receptor pairs for different disease states |
| Ligand | Receptor | LRpair | Pathway | Tissue | Disease Stage |
| Page: 1 |
Top |
Single-cell gene regulatory network inference analysis |
| Find out the significant the regulons (TFs) and the target genes of each regulon across cell types for different disease states |
| TF | Cell Type | Tissue | Disease Stage | Target Gene | RSS | Regulon Activity |
| ∗The dot plots of a searched regulon are shown for all cell subpopulations in each disease state of each tissue based on the regulon specific score inferred using pySCENIC and by calculating the average expression. |
| Page: 1 |
Top |
Somatic mutation of malignant transformation related genes |
| Annotation of somatic variants for genes involved in malignant transformation |
| Hugo Symbol | Variant Class | Variant Classification | dbSNP RS | HGVSc | HGVSp | HGVSp Short | SWISSPROT | BIOTYPE | SIFT | PolyPhen | Tumor Sample Barcode | Tissue | Histology | Sex | Age | Stage | Therapy Types | Drugs | Outcome |
| BPIFB1 | SNV | Missense_Mutation | c.129N>T | p.Glu43Asp | p.E43D | Q8TDL5 | protein_coding | tolerated(0.13) | possibly_damaging(0.516) | TCGA-A8-A08L-01 | Breast | breast invasive carcinoma | Female | >=65 | III/IV | Unknown | Unknown | SD | |
| BPIFB1 | SNV | Missense_Mutation | c.629N>C | p.Gly210Ala | p.G210A | Q8TDL5 | protein_coding | deleterious(0.03) | benign(0.014) | TCGA-AN-A0AK-01 | Breast | breast invasive carcinoma | Female | >=65 | I/II | Unknown | Unknown | SD | |
| BPIFB1 | SNV | Missense_Mutation | c.1402C>T | p.Leu468Phe | p.L468F | Q8TDL5 | protein_coding | deleterious(0.03) | possibly_damaging(0.753) | TCGA-AN-A0FW-01 | Breast | breast invasive carcinoma | Female | >=65 | III/IV | Unknown | Unknown | SD | |
| BPIFB1 | SNV | Missense_Mutation | c.988N>A | p.Asp330Asn | p.D330N | Q8TDL5 | protein_coding | tolerated(0.82) | benign(0.003) | TCGA-BH-A208-01 | Breast | breast invasive carcinoma | Female | <65 | I/II | Unknown | Unknown | SD | |
| BPIFB1 | SNV | Missense_Mutation | rs376198152 | c.401C>T | p.Thr134Met | p.T134M | Q8TDL5 | protein_coding | deleterious(0.05) | benign(0.286) | TCGA-C8-A12U-01 | Breast | breast invasive carcinoma | Female | <65 | I/II | Unknown | Unknown | SD |
| BPIFB1 | insertion | Frame_Shift_Ins | novel | c.94_95insTGAGGCAGGAGAATGGTGTGAACTCAGGAGGTGGA | p.Gly32ValfsTer21 | p.G32Vfs*21 | Q8TDL5 | protein_coding | TCGA-AN-A0FD-01 | Breast | breast invasive carcinoma | Female | >=65 | I/II | Unknown | Unknown | SD | ||
| BPIFB1 | SNV | Missense_Mutation | novel | c.322N>A | p.Leu108Met | p.L108M | Q8TDL5 | protein_coding | tolerated(0.09) | possibly_damaging(0.871) | TCGA-C5-A8XH-01 | Cervix | cervical & endocervical cancer | Female | <65 | I/II | Unknown | Unknown | SD |
| BPIFB1 | SNV | Missense_Mutation | novel | c.172N>G | p.Leu58Val | p.L58V | Q8TDL5 | protein_coding | deleterious(0) | probably_damaging(0.998) | TCGA-5M-AAT6-01 | Colorectum | colon adenocarcinoma | Female | <65 | III/IV | Unknown | Unknown | PD |
| BPIFB1 | SNV | Missense_Mutation | c.4N>A | p.Ala2Thr | p.A2T | Q8TDL5 | protein_coding | deleterious(0.04) | benign(0.023) | TCGA-A6-2686-01 | Colorectum | colon adenocarcinoma | Female | >=65 | I/II | Unknown | Unknown | SD | |
| BPIFB1 | SNV | Missense_Mutation | rs758437993 | c.812N>A | p.Thr271Lys | p.T271K | Q8TDL5 | protein_coding | tolerated(0.08) | benign(0.025) | TCGA-A6-5667-01 | Colorectum | colon adenocarcinoma | Female | <65 | III/IV | Chemotherapy | oxaliplatin | SD |
| Page: 1 2 3 4 5 6 7 |
Top |
Related drugs of malignant transformation related genes |
| Identification of chemicals and drugs interact with genes involved in malignant transfromation |
| (DGIdb 4.0) |
| Entrez ID | Symbol | Category | Interaction Types | Drug Claim Name | Drug Name | PMIDs |
| Page: 1 |

Copyright 2023-Present -The University of Texas Health Science Center at Houston |