Schematic overview of the cellular and molecular mechanisms involved in the cancer progression, including the proposed cellular and molecular mechanisms in cancer cells trajectory. AT1: alveolar type 1 cells; AT2: alveolar type 2 cells; AAH: atypical adenomatous hyperplasia; AIS: adenocarcinoma in situ; MIA: minimally invasive adenocarcinoma; IA: invasive adenocarcinoma; EMT: epithelial-mesenchymal transition

Home

Download

Statistics

Help

Contact

Center for Computational Systems Medicine
leaf

Gene summary

leaf

Malignant transformation analysis

leaf

Malignant transformation related pathway analysis

leaf

Cell-cell communication analysis

leaf

Single-cell gene regulatory network inference analysis

leaf

Somatic mutation of malignant transformation related genes

leaf

Related drugs of malignant transformation related genes

Gene: BPHL

Gene summary for BPHL

check button Gene summary.

Gene informationSpeciesHuman
Gene symbol

BPHL

Gene ID

670

Gene namebiphenyl hydrolase like
Gene AliasBPH-RP
Cytomap6p25.2
Gene Typeprotein-coding
GO ID

GO:0006082

UniProtAcc

A0A024QZY0


Top

Malignant transformation analysis

check button Identification of the aberrant gene expression in precancerous and cancerous lesions by comparing the gene expression of stem-like cells in diseased tissues with normal stem cells
check button Malignant transformation involving gene list.
Entrez IDSymbolReplicatesSpeciesOrganTissueAdj P-valueLog2FCMalignancy
670BPHLLZE7THumanEsophagusESCC1.36e-085.29e-010.0667
670BPHLLZE20THumanEsophagusESCC7.23e-031.02e-010.0662
670BPHLLZE22THumanEsophagusESCC4.43e-043.78e-010.068
670BPHLLZE24THumanEsophagusESCC4.87e-113.35e-010.0596
670BPHLLZE6THumanEsophagusESCC8.85e-031.41e-010.0845
670BPHLP1T-EHumanEsophagusESCC1.38e-062.68e-010.0875
670BPHLP2T-EHumanEsophagusESCC1.21e-386.73e-010.1177
670BPHLP4T-EHumanEsophagusESCC1.57e-306.29e-010.1323
670BPHLP5T-EHumanEsophagusESCC2.37e-086.08e-020.1327
670BPHLP8T-EHumanEsophagusESCC1.35e-142.31e-010.0889
670BPHLP9T-EHumanEsophagusESCC8.54e-041.13e-010.1131
670BPHLP10T-EHumanEsophagusESCC4.88e-061.15e-010.116
670BPHLP11T-EHumanEsophagusESCC2.82e-125.22e-010.1426
670BPHLP12T-EHumanEsophagusESCC1.40e-224.70e-010.1122
670BPHLP15T-EHumanEsophagusESCC2.67e-194.23e-010.1149
670BPHLP16T-EHumanEsophagusESCC2.28e-263.92e-010.1153
670BPHLP17T-EHumanEsophagusESCC1.15e-042.37e-010.1278
670BPHLP19T-EHumanEsophagusESCC3.74e-055.35e-010.1662
670BPHLP20T-EHumanEsophagusESCC1.66e-081.76e-010.1124
670BPHLP21T-EHumanEsophagusESCC6.03e-315.25e-010.1617
Page: 1 2 3 4 5 

check button Transcriptomic changes along malignancy continuum.
TissueExpression DynamicsAbbreviation
EsophagusThe image shows the transcriptomic changes along malignancy continuum.log2FC in expression of this searched gene in stem-like cells from each diseased tissue sample relative to stem-like cells in normal samples in each tissue plotted against the malignancy continuum. Samples are colored based on if they are from different disease stage.
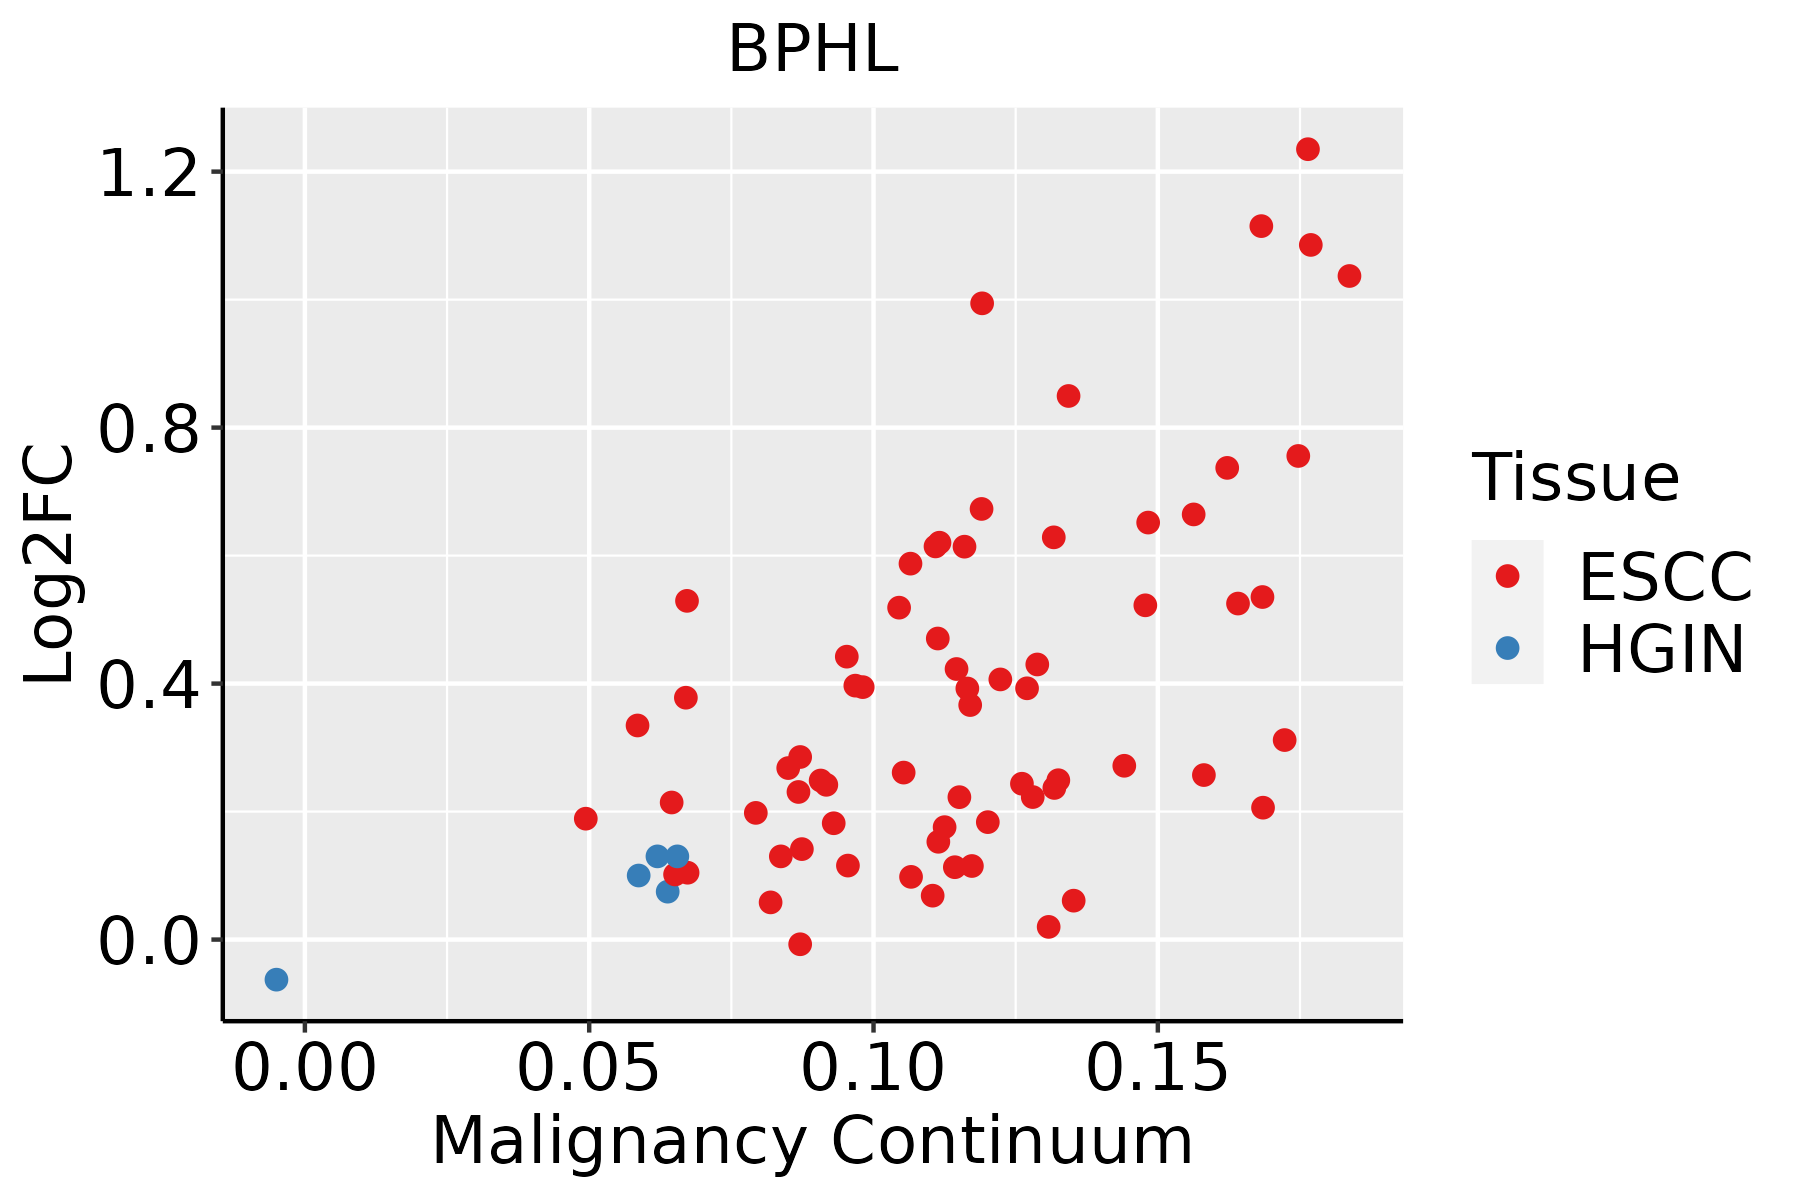
ESCC: Esophageal squamous cell carcinoma
HGIN: High-grade intraepithelial neoplasias
LGIN: Low-grade intraepithelial neoplasias
LiverThe image shows the transcriptomic changes along malignancy continuum.log2FC in expression of this searched gene in stem-like cells from each diseased tissue sample relative to stem-like cells in normal samples in each tissue plotted against the malignancy continuum. Samples are colored based on if they are from different disease stage.
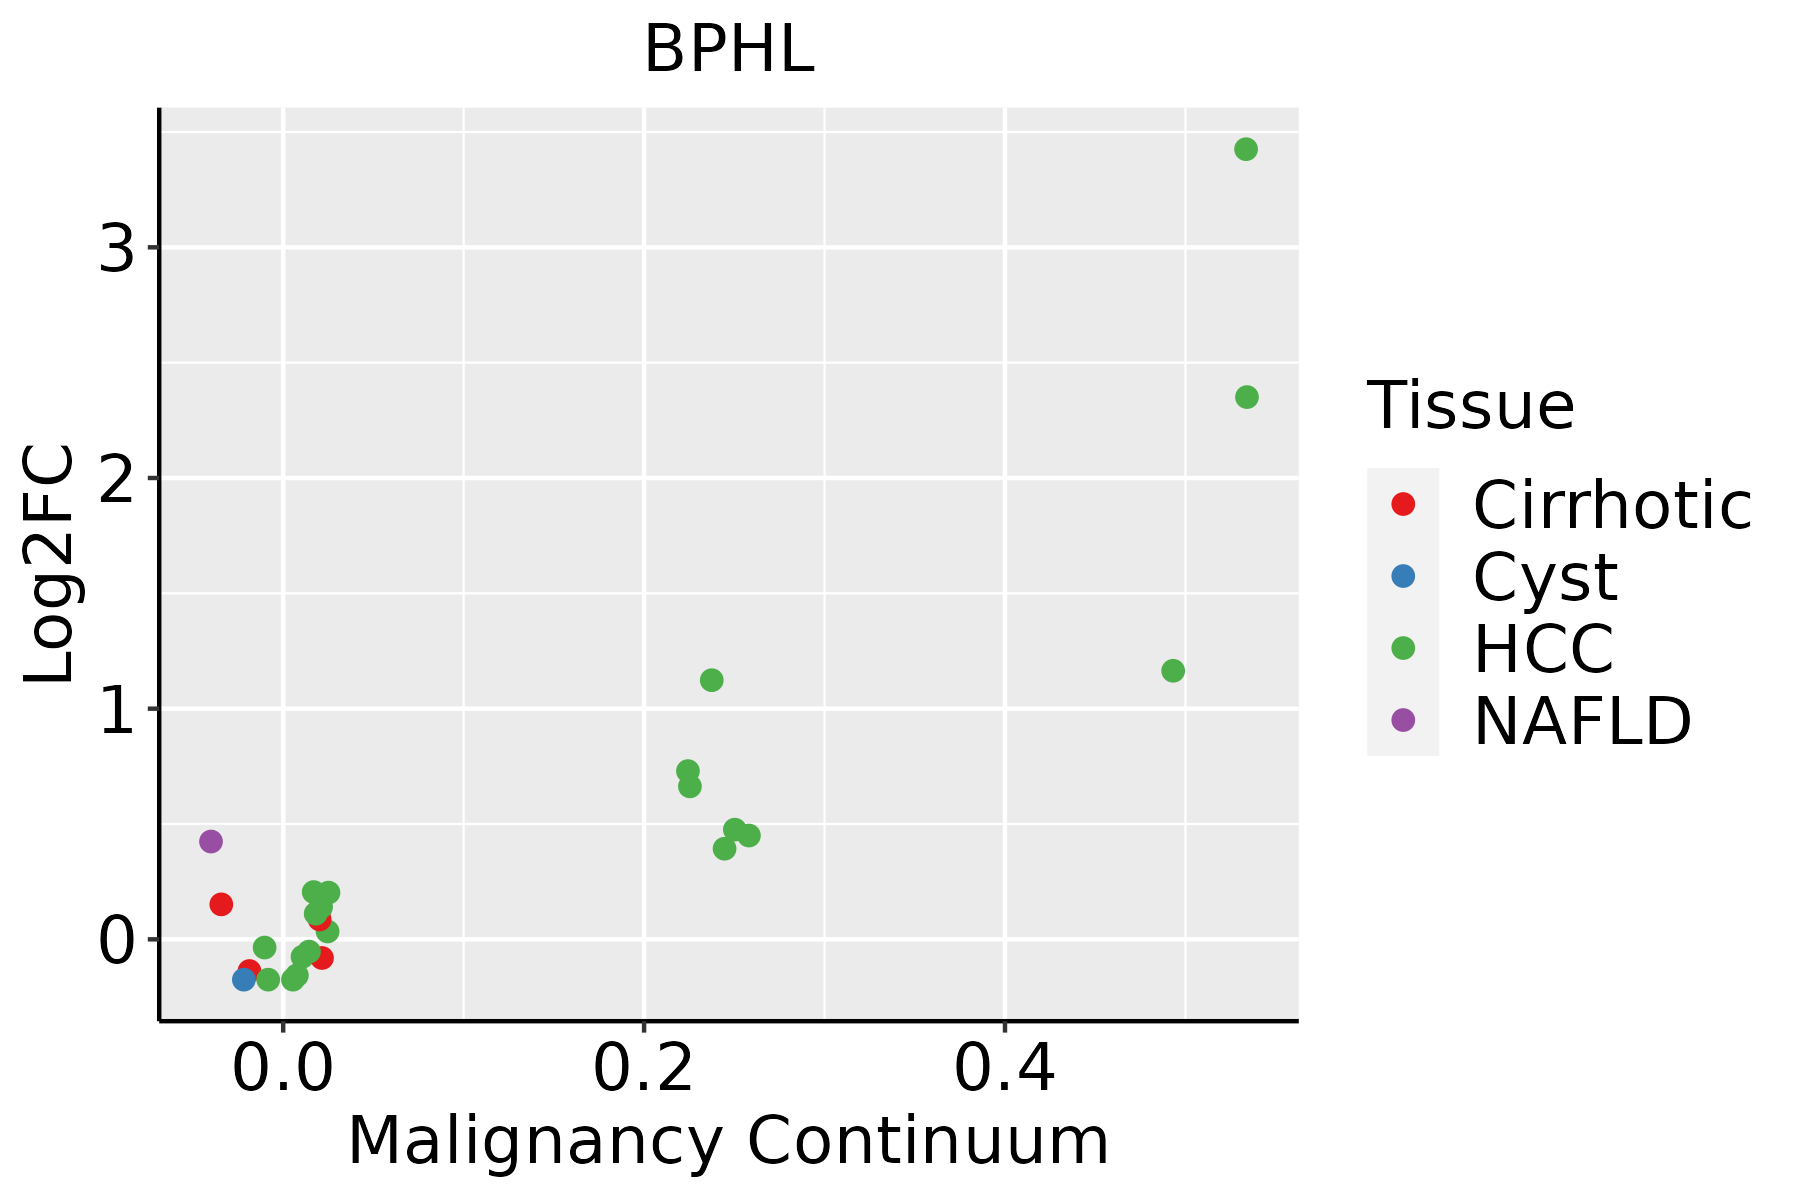
HCC: Hepatocellular carcinoma
NAFLD: Non-alcoholic fatty liver disease
Oral CavityThe image shows the transcriptomic changes along malignancy continuum.log2FC in expression of this searched gene in stem-like cells from each diseased tissue sample relative to stem-like cells in normal samples in each tissue plotted against the malignancy continuum. Samples are colored based on if they are from different disease stage.
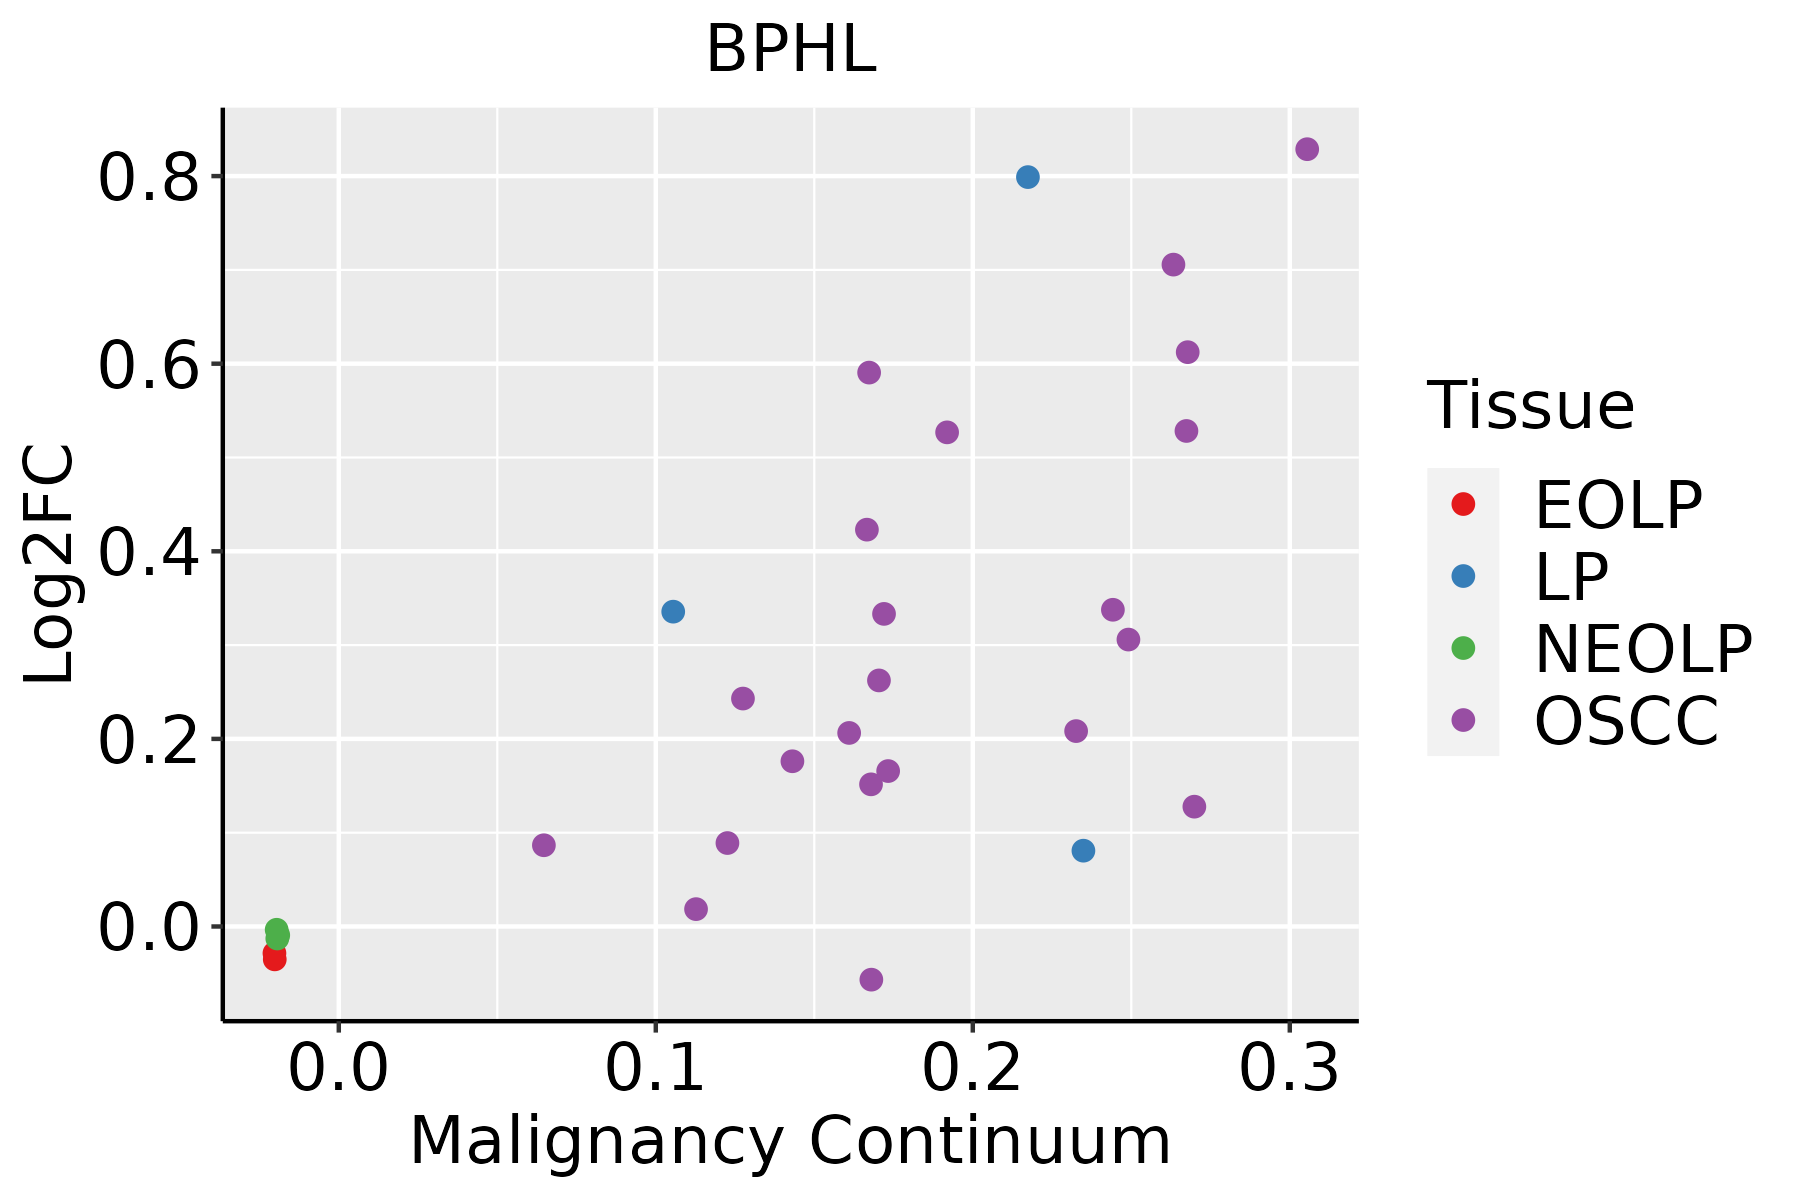
EOLP: Erosive Oral lichen planus
LP: leukoplakia
NEOLP: Non-erosive oral lichen planus
OSCC: Oral squamous cell carcinoma
SkinThe image shows the transcriptomic changes along malignancy continuum.log2FC in expression of this searched gene in stem-like cells from each diseased tissue sample relative to stem-like cells in normal samples in each tissue plotted against the malignancy continuum. Samples are colored based on if they are from different disease stage.
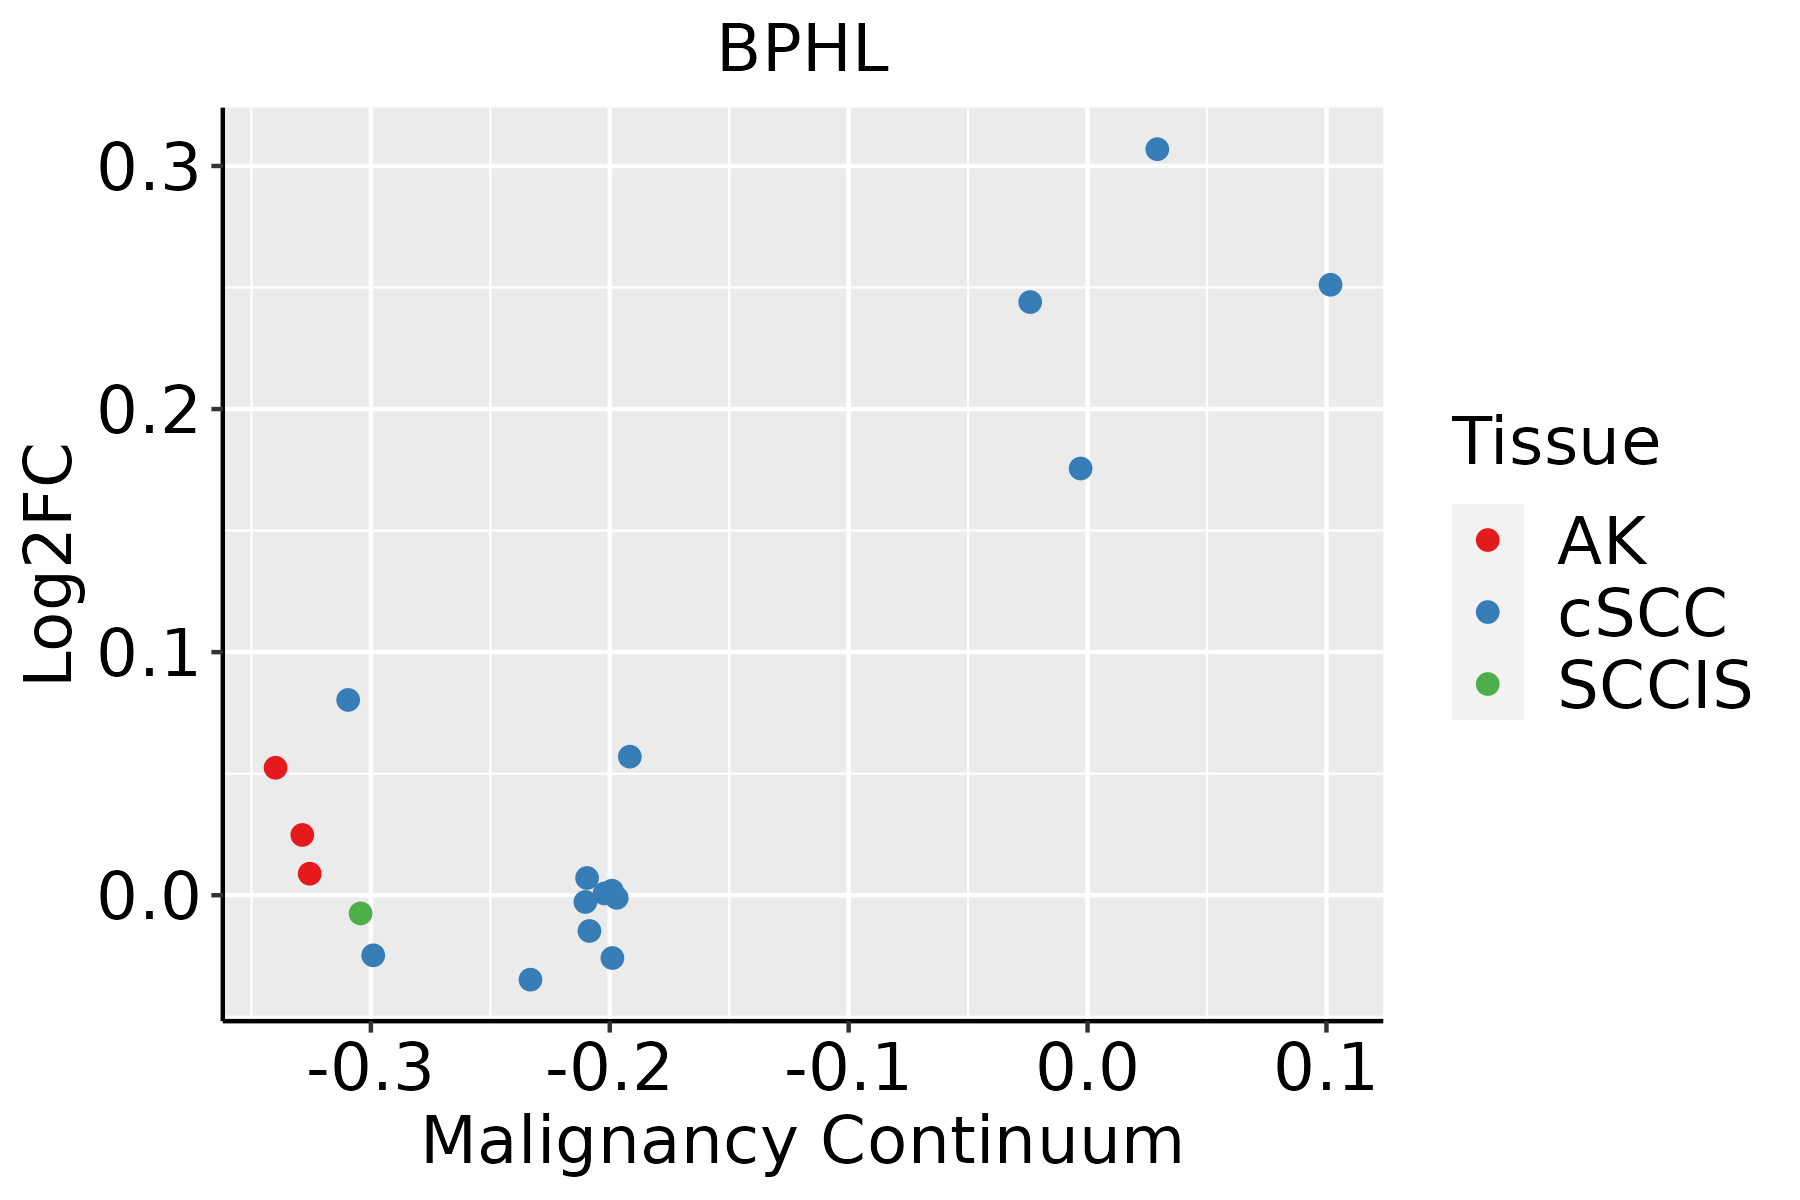
AK: Actinic keratosis
cSCC: Cutaneous squamous cell carcinoma
SCCIS:squamous cell carcinoma in situ
∗log2FC in expression of this searched gene in stem-like cells from each diseased tissue sample relative to stem-like cells in normal samples in each tissue plotted against the malignancy continuum. Samples are colored based on if they are from different disease stage.

Top

Malignant transformation related pathway analysis

check buttonFind out the enriched GO biological processes and KEGG pathways involved in transition from healthy to precancer to cancer
check button Figure of enriched GO biological processes.
TissueDisease StageEnriched GO biological Processes
ColorectumADGO analysis - Figure of enriched GO biological processes: Top 15 enriched GO BP terms are showed in the bar plot of each disease state in each tissue. Each row represents a significant GO biological process which is colored according to the -log10(p.adjust).
ColorectumSERGO analysis - Figure of enriched GO biological processes: Top 15 enriched GO BP terms are showed in the bar plot of each disease state in each tissue. Each row represents a significant GO biological process which is colored according to the -log10(p.adjust).
ColorectumMSSGO analysis - Figure of enriched GO biological processes: Top 15 enriched GO BP terms are showed in the bar plot of each disease state in each tissue. Each row represents a significant GO biological process which is colored according to the -log10(p.adjust).
ColorectumMSI-HGO analysis - Figure of enriched GO biological processes: Top 15 enriched GO BP terms are showed in the bar plot of each disease state in each tissue. Each row represents a significant GO biological process which is colored according to the -log10(p.adjust).
ColorectumFAPGO analysis - Figure of enriched GO biological processes: Top 15 enriched GO BP terms are showed in the bar plot of each disease state in each tissue. Each row represents a significant GO biological process which is colored according to the -log10(p.adjust).
∗Top 15 enriched GO BP terms are showed in the bar plot of each disease state in each tissue. Each row represents a significant GO biological process which is colored according to the -log10(p.adjust).
Page: 1 2 3 4 5 6 7 8 9 

check button Enriched GO biological processes.
GO IDTissueDisease StageDescriptionGene RatioBg Ratiopvaluep.adjustCount
GO:000941020EsophagusESCCresponse to xenobiotic stimulus253/8552462/187234.55e-053.58e-04253
GO:000963620EsophagusESCCresponse to toxic substance150/8552262/187231.00e-047.12e-04150
GO:00065203LiverNAFLDcellular amino acid metabolic process63/1882284/187231.14e-092.17e-0763
GO:00094107LiverNAFLDresponse to xenobiotic stimulus88/1882462/187232.53e-094.11e-0788
GO:00714663LiverNAFLDcellular response to xenobiotic stimulus33/1882177/187233.54e-045.36e-0333
GO:00068054LiverNAFLDxenobiotic metabolic process22/1882111/187231.42e-031.58e-0222
GO:00096367LiverNAFLDresponse to toxic substance41/1882262/187232.83e-032.57e-0241
GO:000963612LiverCirrhoticresponse to toxic substance104/4634262/187235.63e-081.74e-06104
GO:000941012LiverCirrhoticresponse to xenobiotic stimulus165/4634462/187236.82e-082.09e-06165
GO:000652011LiverCirrhoticcellular amino acid metabolic process103/4634284/187238.88e-061.30e-04103
GO:00714661LiverCirrhoticcellular response to xenobiotic stimulus66/4634177/187231.34e-041.31e-0366
GO:000680511LiverCirrhoticxenobiotic metabolic process43/4634111/187237.51e-045.54e-0343
GO:00065202LiverHCCcellular amino acid metabolic process167/7958284/187231.91e-084.56e-07167
GO:000963622LiverHCCresponse to toxic substance153/7958262/187231.37e-072.58e-06153
GO:000941022LiverHCCresponse to xenobiotic stimulus248/7958462/187236.47e-071.02e-05248
GO:00714662LiverHCCcellular response to xenobiotic stimulus93/7958177/187234.35e-031.89e-0293
GO:000170116Oral cavityOSCCin utero embryonic development207/7305367/187237.92e-122.95e-10207
GO:000963618Oral cavityOSCCresponse to toxic substance137/7305262/187237.94e-068.52e-05137
GO:000941018Oral cavityOSCCresponse to xenobiotic stimulus222/7305462/187234.00e-053.48e-04222
GO:000963619Oral cavityLPresponse to toxic substance86/4623262/187231.74e-031.32e-0286
Page: 1 2 

check button Enriched KEGG pathways.
Pathway IDTissueDisease StageDescriptionGene RatioBg Ratiopvaluep.adjustqvalueCount
Page: 1 

Top

Cell-cell communication analysis

check buttonIdentification of potential cell-cell interactions between two cell types and their ligand-receptor pairs for different disease states
LigandReceptorLRpairPathwayTissueDisease Stage
Page: 1 

Top

Single-cell gene regulatory network inference analysis

check buttonFind out the significant the regulons (TFs) and the target genes of each regulon across cell types for different disease states
TFCell TypeTissueDisease StageTarget GeneRSSRegulon Activity
∗The dot plots of a searched regulon are shown for all cell subpopulations in each disease state of each tissue based on the regulon specific score inferred using pySCENIC and by calculating the average expression.
Page: 1 

Top

Somatic mutation of malignant transformation related genes

check buttonAnnotation of somatic variants for genes involved in malignant transformation
Hugo SymbolVariant ClassVariant ClassificationdbSNP RSHGVScHGVSpHGVSp ShortSWISSPROTBIOTYPESIFTPolyPhenTumor Sample BarcodeTissueHistologySexAgeStageTherapy TypesDrugsOutcome
BPHLSNVMissense_Mutationrs774197466c.511G>Ap.Glu171Lysp.E171KQ86WA6protein_codingtolerated(0.11)benign(0.042)TCGA-AN-A046-01Breastbreast invasive carcinomaFemale>=65I/IIUnknownUnknownSD
BPHLinsertionFrame_Shift_Insnovelc.361_362insAACCTCCGCCTCCCGGGTTCAAGCAATTCTCCTGCCTCAGCCTCp.Ala121GlufsTer19p.A121Efs*19Q86WA6protein_codingTCGA-AR-A0TY-01Breastbreast invasive carcinomaFemale<65I/IIUnspecificPaclitaxelPD
BPHLinsertionIn_Frame_Insnovelc.821_822insACTTAGp.Leu274_His275insLeuArgp.L274_H275insLRQ86WA6protein_codingTCGA-B6-A0IN-01Breastbreast invasive carcinomaFemale<65I/IIUnknownUnknownPD
BPHLinsertionNonsense_Mutationnovelc.823_824insTTTCATCCTAGAAGCTTTACCACTTTTACTGTTTCTp.His275delinsLeuSerSerTerLysLeuTyrHisPheTyrCysPheTyrp.H275delinsLSS*KLYHFYCFYQ86WA6protein_codingTCGA-B6-A0IN-01Breastbreast invasive carcinomaFemale<65I/IIUnknownUnknownPD
BPHLinsertionNonsense_Mutationnovelc.396_397insCCTCCTGAGTAGCTGGGATTACAGGCACATGCCACTATp.Val133ProfsTer4p.V133Pfs*4Q86WA6protein_codingTCGA-BH-A0B4-01Breastbreast invasive carcinomaMale>=65III/IVHormone TherapytamoxiphenSD
BPHLSNVMissense_Mutationrs151267393c.830N>Ap.Arg277Hisp.R277HQ86WA6protein_codingdeleterious(0.01)probably_damaging(0.986)TCGA-IR-A3LB-01Cervixcervical & endocervical cancerFemale<65I/IIChemotherapycisplatinPD
BPHLSNVMissense_Mutationnovelc.414N>Cp.Trp138Cysp.W138CQ86WA6protein_codingdeleterious(0)probably_damaging(1)TCGA-VS-A8EI-01Cervixcervical & endocervical cancerFemale<65I/IIChemotherapycisplatinCR
BPHLSNVMissense_Mutationc.793N>Tp.His265Tyrp.H265YQ86WA6protein_codingtolerated(0.28)benign(0.031)TCGA-AA-A010-01Colorectumcolon adenocarcinomaFemale<65I/IIChemotherapyfolinicCR
BPHLSNVMissense_Mutationrs192366834c.184G>Ap.Ala62Thrp.A62TQ86WA6protein_codingtolerated(0.16)benign(0.034)TCGA-DM-A1HB-01Colorectumcolon adenocarcinomaMale>=65III/IVUnknownUnknownSD
BPHLSNVMissense_Mutationc.131N>Cp.Val44Alap.V44AQ86WA6protein_codingtolerated(0.1)benign(0.017)TCGA-F4-6570-01Colorectumcolon adenocarcinomaFemale>=65I/IIUnknownUnknownSD
Page: 1 2 3 4 

Top

Related drugs of malignant transformation related genes

check buttonIdentification of chemicals and drugs interact with genes involved in malignant transfromation
(DGIdb 4.0)
Entrez IDSymbolCategoryInteraction TypesDrug Claim NameDrug NamePMIDs
Page: 1