
|
|||||
|
 | |
| |
| |
| |
| |
| |
|
Gene: BPGM |
Gene summary for BPGM |
| Gene information | Species | Human | Gene symbol | BPGM | Gene ID | 669 |
| Gene name | bisphosphoglycerate mutase | |
| Gene Alias | DPGM | |
| Cytomap | 7q33 | |
| Gene Type | protein-coding | GO ID | GO:0002262 | UniProtAcc | A0A024R782 |
Top |
Malignant transformation analysis |
| Identification of the aberrant gene expression in precancerous and cancerous lesions by comparing the gene expression of stem-like cells in diseased tissues with normal stem cells |
| Entrez ID | Symbol | Replicates | Species | Organ | Tissue | Adj P-value | Log2FC | Malignancy |
| 669 | BPGM | LZE4T | Human | Esophagus | ESCC | 1.40e-10 | 4.14e-01 | 0.0811 |
| 669 | BPGM | LZE7T | Human | Esophagus | ESCC | 5.18e-03 | 3.79e-01 | 0.0667 |
| 669 | BPGM | LZE20T | Human | Esophagus | ESCC | 3.64e-07 | 2.70e-01 | 0.0662 |
| 669 | BPGM | LZE24T | Human | Esophagus | ESCC | 7.74e-04 | 1.80e-01 | 0.0596 |
| 669 | BPGM | P2T-E | Human | Esophagus | ESCC | 3.87e-03 | 1.22e-01 | 0.1177 |
| 669 | BPGM | P4T-E | Human | Esophagus | ESCC | 3.16e-18 | 6.20e-01 | 0.1323 |
| 669 | BPGM | P5T-E | Human | Esophagus | ESCC | 7.72e-13 | 3.54e-01 | 0.1327 |
| 669 | BPGM | P8T-E | Human | Esophagus | ESCC | 5.76e-13 | 2.07e-01 | 0.0889 |
| 669 | BPGM | P9T-E | Human | Esophagus | ESCC | 1.01e-15 | 6.18e-01 | 0.1131 |
| 669 | BPGM | P10T-E | Human | Esophagus | ESCC | 3.07e-21 | 4.79e-01 | 0.116 |
| 669 | BPGM | P11T-E | Human | Esophagus | ESCC | 1.56e-15 | 9.39e-01 | 0.1426 |
| 669 | BPGM | P12T-E | Human | Esophagus | ESCC | 4.05e-30 | 8.01e-01 | 0.1122 |
| 669 | BPGM | P15T-E | Human | Esophagus | ESCC | 8.40e-29 | 6.66e-01 | 0.1149 |
| 669 | BPGM | P16T-E | Human | Esophagus | ESCC | 2.23e-07 | 8.65e-02 | 0.1153 |
| 669 | BPGM | P19T-E | Human | Esophagus | ESCC | 1.09e-09 | 8.68e-01 | 0.1662 |
| 669 | BPGM | P20T-E | Human | Esophagus | ESCC | 1.06e-12 | 8.73e-01 | 0.1124 |
| 669 | BPGM | P21T-E | Human | Esophagus | ESCC | 1.25e-47 | 1.35e+00 | 0.1617 |
| 669 | BPGM | P24T-E | Human | Esophagus | ESCC | 6.09e-06 | 2.80e-01 | 0.1287 |
| 669 | BPGM | P26T-E | Human | Esophagus | ESCC | 1.64e-31 | 8.71e-01 | 0.1276 |
| 669 | BPGM | P27T-E | Human | Esophagus | ESCC | 4.48e-13 | 4.35e-01 | 0.1055 |
| Page: 1 2 3 4 |
| Tissue | Expression Dynamics | Abbreviation |
| Esophagus | 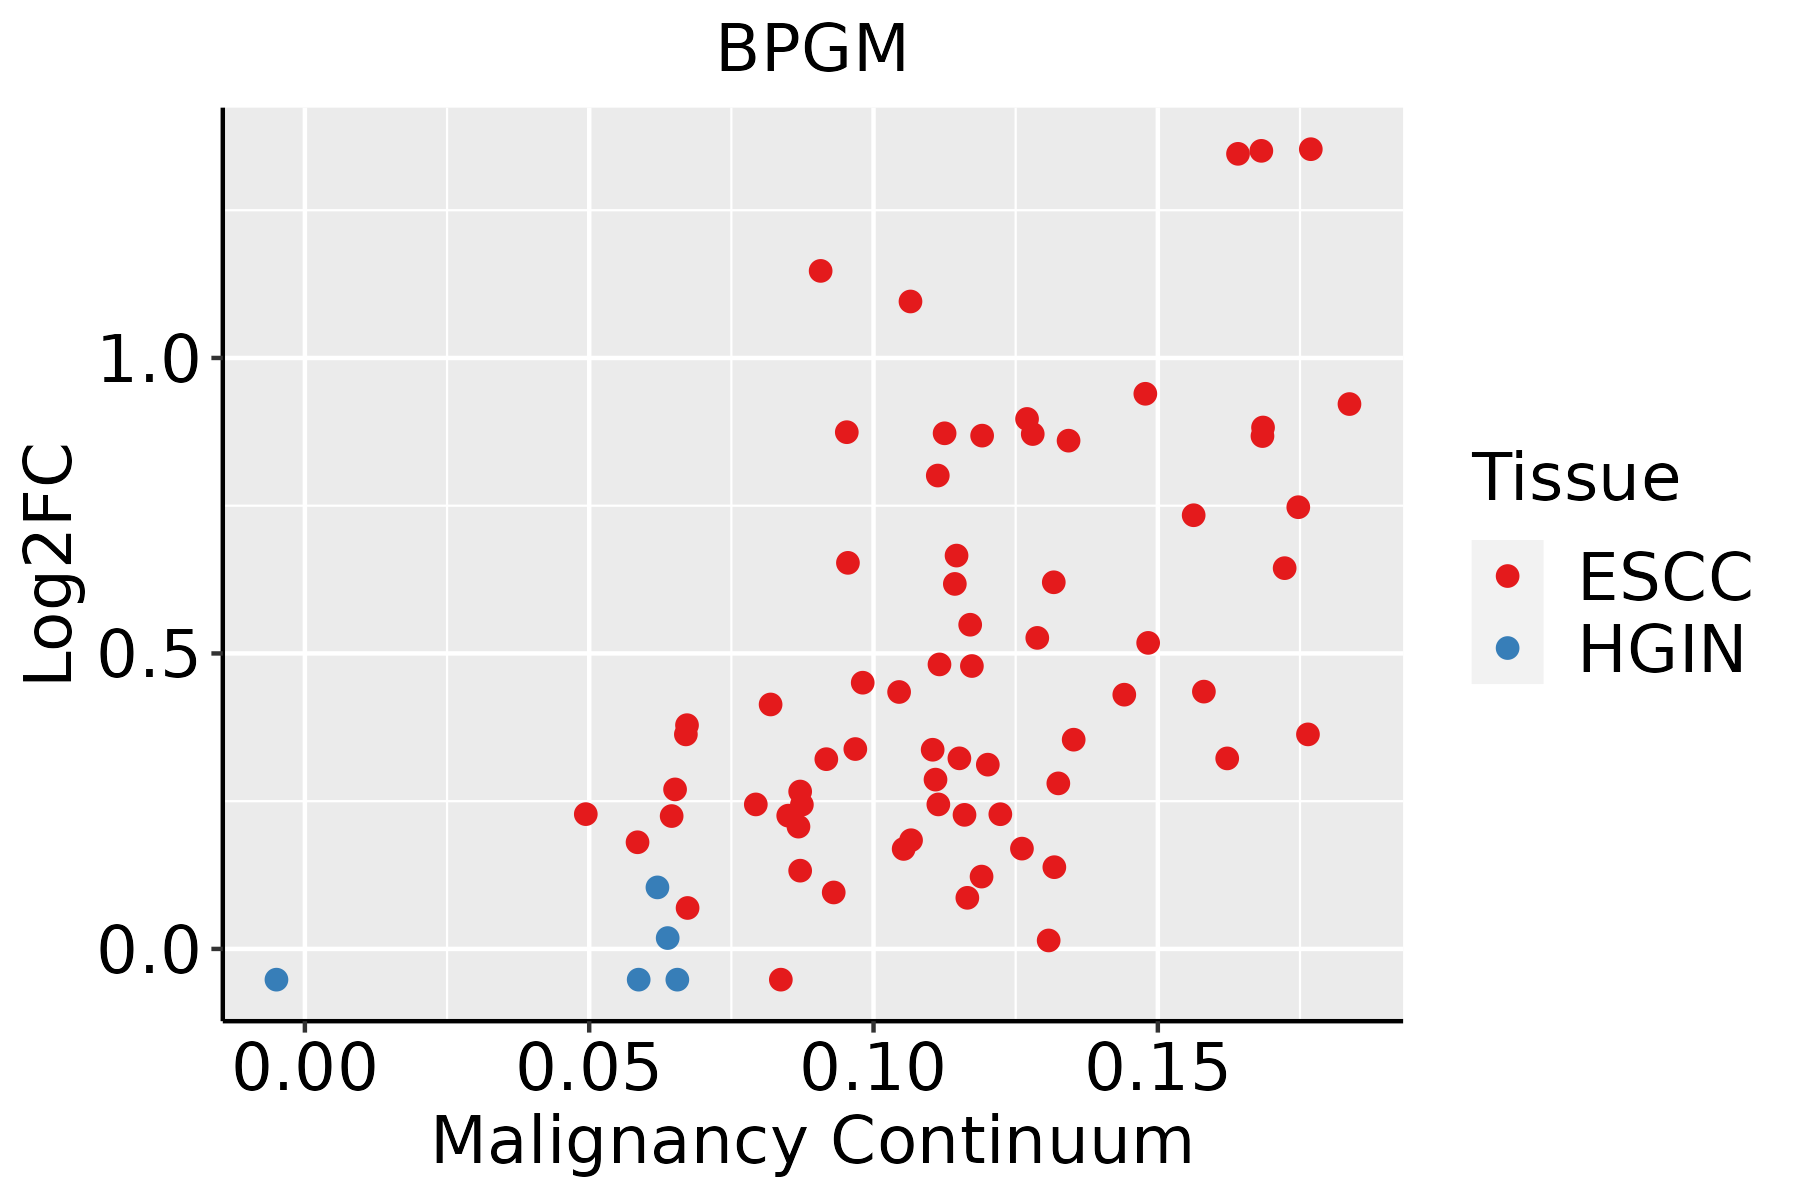 | ESCC: Esophageal squamous cell carcinoma |
| HGIN: High-grade intraepithelial neoplasias | ||
| LGIN: Low-grade intraepithelial neoplasias | ||
| Oral Cavity | 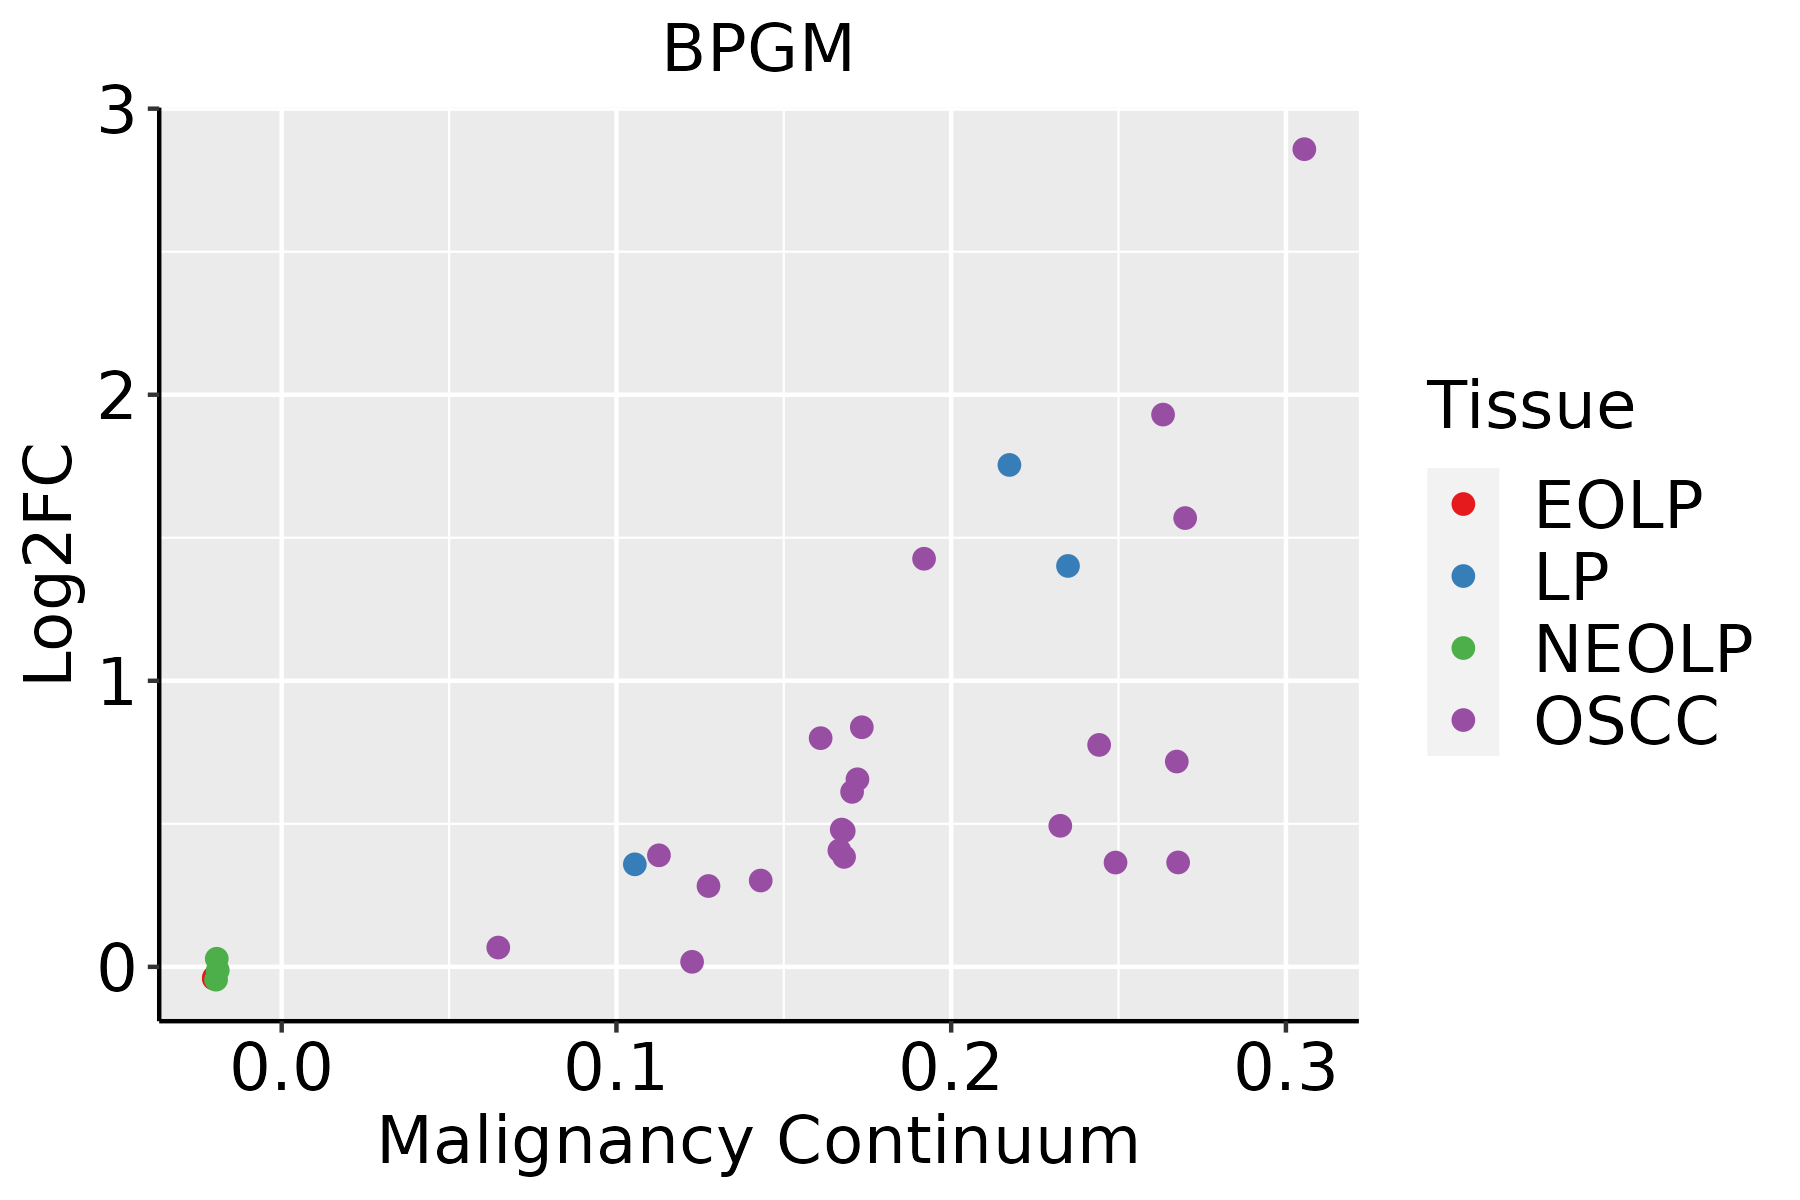 | EOLP: Erosive Oral lichen planus |
| LP: leukoplakia | ||
| NEOLP: Non-erosive oral lichen planus | ||
| OSCC: Oral squamous cell carcinoma | ||
| Skin | 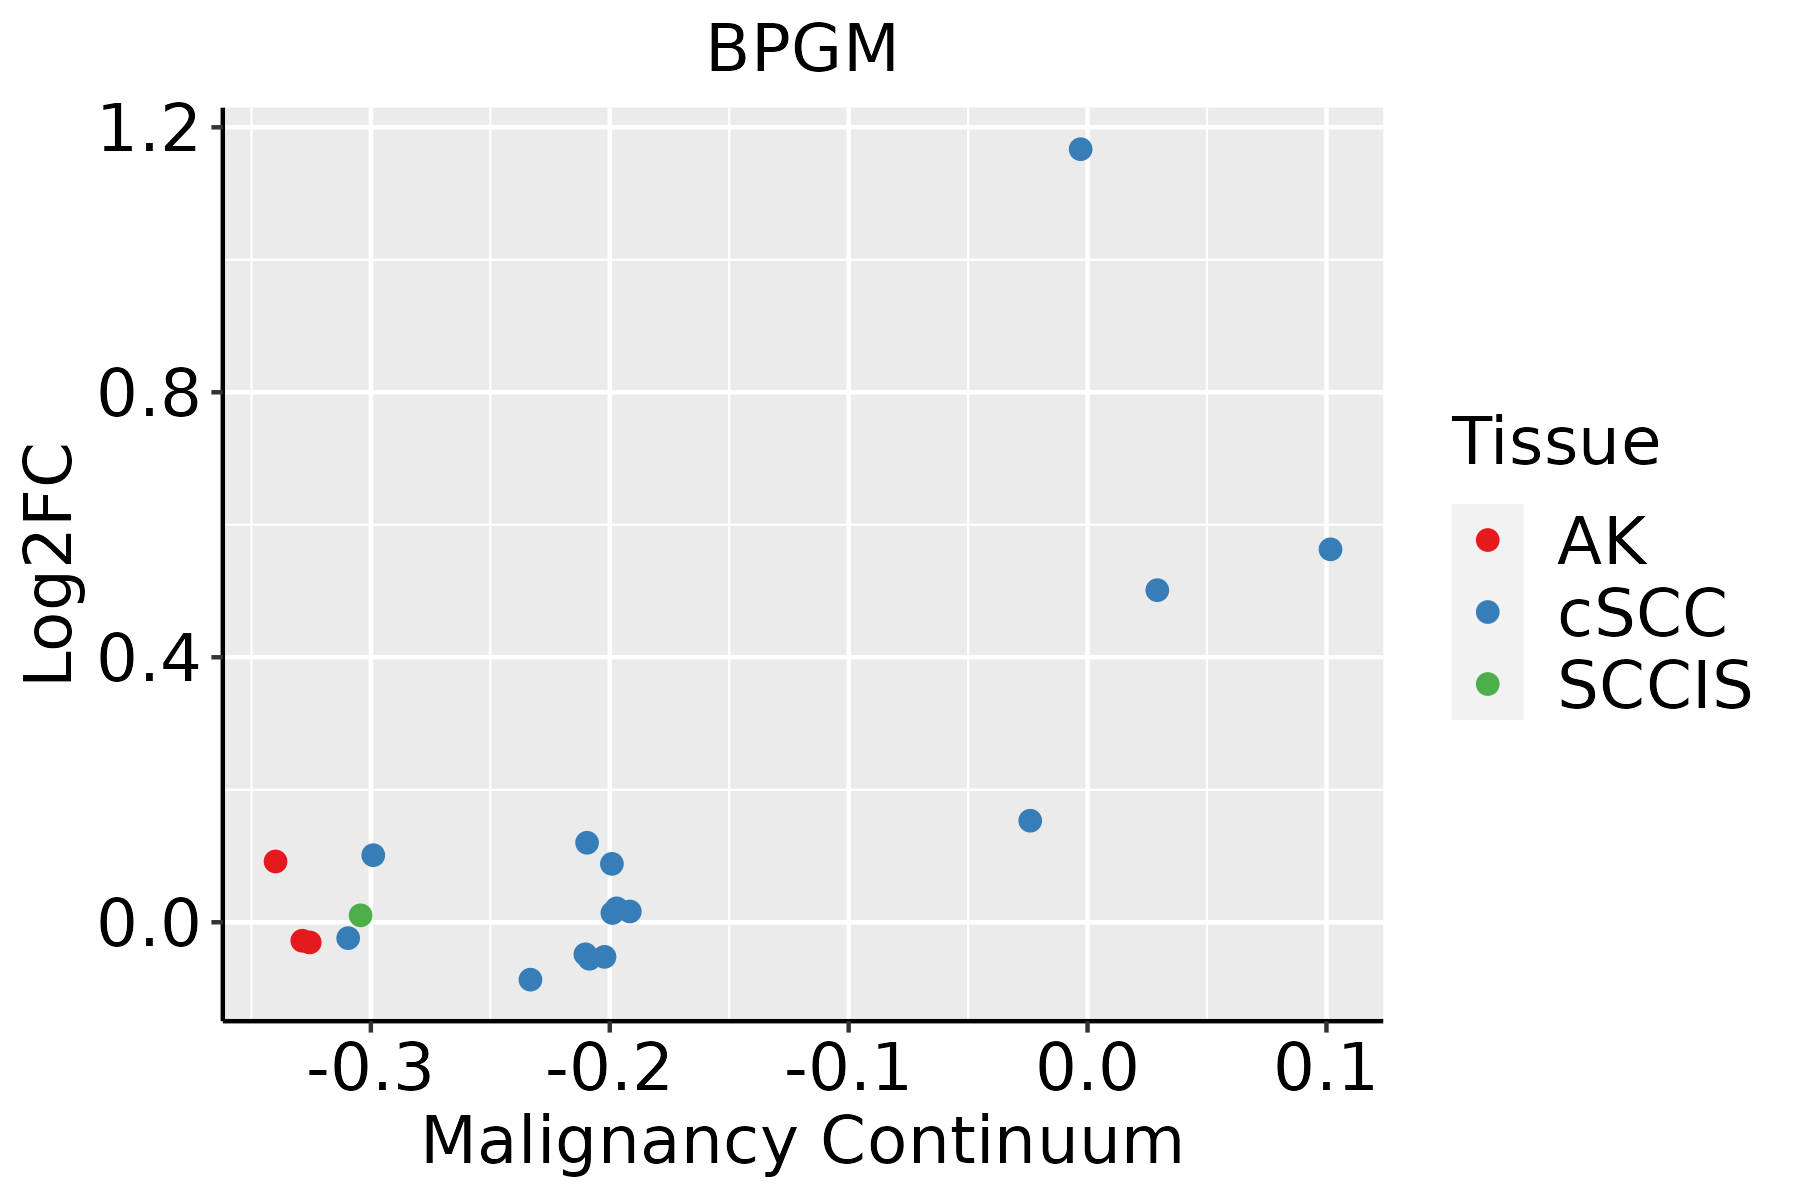 | AK: Actinic keratosis |
| cSCC: Cutaneous squamous cell carcinoma | ||
| SCCIS:squamous cell carcinoma in situ |
| ∗log2FC in expression of this searched gene in stem-like cells from each diseased tissue sample relative to stem-like cells in normal samples in each tissue plotted against the malignancy continuum. Samples are colored based on if they are from different disease stage. |
Top |
Malignant transformation related pathway analysis |
| Find out the enriched GO biological processes and KEGG pathways involved in transition from healthy to precancer to cancer |
| Tissue | Disease Stage | Enriched GO biological Processes |
| Colorectum | AD |  |
| Colorectum | SER |  |
| Colorectum | MSS |  |
| Colorectum | MSI-H |  |
| Colorectum | FAP |  |
| ∗Top 15 enriched GO BP terms are showed in the bar plot of each disease state in each tissue. Each row represents a significant GO biological process which is colored according to the -log10(p.adjust). |
| Page: 1 2 3 4 5 6 7 8 9 |
| GO ID | Tissue | Disease Stage | Description | Gene Ratio | Bg Ratio | pvalue | p.adjust | Count |
| GO:0006091110 | Esophagus | ESCC | generation of precursor metabolites and energy | 331/8552 | 490/18723 | 3.86e-23 | 8.45e-21 | 331 |
| GO:0046034111 | Esophagus | ESCC | ATP metabolic process | 189/8552 | 277/18723 | 1.99e-14 | 1.04e-12 | 189 |
| GO:0030099111 | Esophagus | ESCC | myeloid cell differentiation | 232/8552 | 381/18723 | 1.22e-09 | 2.90e-08 | 232 |
| GO:0006753110 | Esophagus | ESCC | nucleoside phosphate metabolic process | 288/8552 | 497/18723 | 1.80e-08 | 3.50e-07 | 288 |
| GO:0019693111 | Esophagus | ESCC | ribose phosphate metabolic process | 234/8552 | 396/18723 | 4.24e-08 | 7.76e-07 | 234 |
| GO:0009117111 | Esophagus | ESCC | nucleotide metabolic process | 282/8552 | 489/18723 | 4.70e-08 | 8.50e-07 | 282 |
| GO:0002262111 | Esophagus | ESCC | myeloid cell homeostasis | 104/8552 | 157/18723 | 1.49e-07 | 2.36e-06 | 104 |
| GO:0034101111 | Esophagus | ESCC | erythrocyte homeostasis | 88/8552 | 129/18723 | 1.81e-07 | 2.84e-06 | 88 |
| GO:0009259111 | Esophagus | ESCC | ribonucleotide metabolic process | 224/8552 | 385/18723 | 4.41e-07 | 6.00e-06 | 224 |
| GO:0072521111 | Esophagus | ESCC | purine-containing compound metabolic process | 238/8552 | 416/18723 | 1.20e-06 | 1.49e-05 | 238 |
| GO:0048872111 | Esophagus | ESCC | homeostasis of number of cells | 163/8552 | 272/18723 | 1.40e-06 | 1.69e-05 | 163 |
| GO:0009150111 | Esophagus | ESCC | purine ribonucleotide metabolic process | 213/8552 | 368/18723 | 1.40e-06 | 1.69e-05 | 213 |
| GO:0030218111 | Esophagus | ESCC | erythrocyte differentiation | 80/8552 | 120/18723 | 2.69e-06 | 3.08e-05 | 80 |
| GO:0006163111 | Esophagus | ESCC | purine nucleotide metabolic process | 226/8552 | 396/18723 | 2.81e-06 | 3.21e-05 | 226 |
| GO:000913219 | Esophagus | ESCC | nucleoside diphosphate metabolic process | 77/8552 | 124/18723 | 1.65e-04 | 1.09e-03 | 77 |
| GO:000918520 | Esophagus | ESCC | ribonucleoside diphosphate metabolic process | 66/8552 | 106/18723 | 4.21e-04 | 2.39e-03 | 66 |
| GO:001605216 | Esophagus | ESCC | carbohydrate catabolic process | 91/8552 | 154/18723 | 5.39e-04 | 2.97e-03 | 91 |
| GO:000913520 | Esophagus | ESCC | purine nucleoside diphosphate metabolic process | 63/8552 | 103/18723 | 1.10e-03 | 5.52e-03 | 63 |
| GO:000917920 | Esophagus | ESCC | purine ribonucleoside diphosphate metabolic process | 63/8552 | 103/18723 | 1.10e-03 | 5.52e-03 | 63 |
| GO:19011362 | Esophagus | ESCC | carbohydrate derivative catabolic process | 99/8552 | 172/18723 | 1.11e-03 | 5.54e-03 | 99 |
| Page: 1 2 3 4 5 |
| Pathway ID | Tissue | Disease Stage | Description | Gene Ratio | Bg Ratio | pvalue | p.adjust | qvalue | Count |
| hsa0001016 | Esophagus | ESCC | Glycolysis / Gluconeogenesis | 42/4205 | 67/8465 | 2.15e-02 | 4.78e-02 | 2.45e-02 | 42 |
| hsa0001017 | Esophagus | ESCC | Glycolysis / Gluconeogenesis | 42/4205 | 67/8465 | 2.15e-02 | 4.78e-02 | 2.45e-02 | 42 |
| hsa0001014 | Oral cavity | OSCC | Glycolysis / Gluconeogenesis | 40/3704 | 67/8465 | 6.08e-03 | 1.44e-02 | 7.31e-03 | 40 |
| hsa0001015 | Oral cavity | OSCC | Glycolysis / Gluconeogenesis | 40/3704 | 67/8465 | 6.08e-03 | 1.44e-02 | 7.31e-03 | 40 |
| hsa0001023 | Oral cavity | LP | Glycolysis / Gluconeogenesis | 28/2418 | 67/8465 | 1.36e-02 | 4.44e-02 | 2.86e-02 | 28 |
| hsa0001033 | Oral cavity | LP | Glycolysis / Gluconeogenesis | 28/2418 | 67/8465 | 1.36e-02 | 4.44e-02 | 2.86e-02 | 28 |
| Page: 1 |
Top |
Cell-cell communication analysis |
| Identification of potential cell-cell interactions between two cell types and their ligand-receptor pairs for different disease states |
| Ligand | Receptor | LRpair | Pathway | Tissue | Disease Stage |
| Page: 1 |
Top |
Single-cell gene regulatory network inference analysis |
| Find out the significant the regulons (TFs) and the target genes of each regulon across cell types for different disease states |
| TF | Cell Type | Tissue | Disease Stage | Target Gene | RSS | Regulon Activity |
| ∗The dot plots of a searched regulon are shown for all cell subpopulations in each disease state of each tissue based on the regulon specific score inferred using pySCENIC and by calculating the average expression. |
| Page: 1 |
Top |
Somatic mutation of malignant transformation related genes |
| Annotation of somatic variants for genes involved in malignant transformation |
| Hugo Symbol | Variant Class | Variant Classification | dbSNP RS | HGVSc | HGVSp | HGVSp Short | SWISSPROT | BIOTYPE | SIFT | PolyPhen | Tumor Sample Barcode | Tissue | Histology | Sex | Age | Stage | Therapy Types | Drugs | Outcome |
| BPGM | SNV | Missense_Mutation | novel | c.376A>G | p.Ile126Val | p.I126V | P07738 | protein_coding | tolerated(0.11) | benign(0.039) | TCGA-BH-A0DS-01 | Breast | breast invasive carcinoma | Female | >=65 | III/IV | Chemotherapy | cyclophosphamide | SD |
| BPGM | SNV | Missense_Mutation | novel | c.566N>A | p.Gly189Glu | p.G189E | P07738 | protein_coding | deleterious(0) | probably_damaging(1) | TCGA-EW-A1PC-01 | Breast | breast invasive carcinoma | Female | >=65 | I/II | Hormone Therapy | tamoxiphen | SD |
| BPGM | SNV | Missense_Mutation | novel | c.220N>G | p.Leu74Val | p.L74V | P07738 | protein_coding | tolerated(0.06) | benign(0.111) | TCGA-VS-A9V1-01 | Cervix | cervical & endocervical cancer | Female | <65 | I/II | Chemotherapy | cisplatin | PD |
| BPGM | SNV | Missense_Mutation | c.57N>T | p.Glu19Asp | p.E19D | P07738 | protein_coding | tolerated(0.06) | benign(0.007) | TCGA-EI-7002-01 | Colorectum | rectum adenocarcinoma | Male | <65 | III/IV | Chemotherapy | irinotecan+5-fluorouracilim | SD | |
| BPGM | SNV | Missense_Mutation | rs757985056 | c.62G>A | p.Arg21His | p.R21H | P07738 | protein_coding | deleterious(0.01) | probably_damaging(0.99) | TCGA-A5-A0G1-01 | Endometrium | uterine corpus endometrioid carcinoma | Female | >=65 | I/II | Unknown | Unknown | SD |
| BPGM | SNV | Missense_Mutation | novel | c.116G>A | p.Arg39Gln | p.R39Q | P07738 | protein_coding | tolerated(0.56) | benign(0) | TCGA-A5-A0G2-01 | Endometrium | uterine corpus endometrioid carcinoma | Female | <65 | III/IV | Unknown | Unknown | SD |
| BPGM | SNV | Missense_Mutation | novel | c.335N>C | p.Val112Ala | p.V112A | P07738 | protein_coding | deleterious(0) | probably_damaging(0.999) | TCGA-A5-A0GG-01 | Endometrium | uterine corpus endometrioid carcinoma | Female | >=65 | I/II | Unknown | Unknown | SD |
| BPGM | SNV | Missense_Mutation | rs771037885 | c.140C>T | p.Ala47Val | p.A47V | P07738 | protein_coding | deleterious(0.01) | benign(0.083) | TCGA-A5-A1OF-01 | Endometrium | uterine corpus endometrioid carcinoma | Female | <65 | I/II | Unknown | Unknown | SD |
| BPGM | SNV | Missense_Mutation | novel | c.461G>A | p.Arg154Gln | p.R154Q | P07738 | protein_coding | tolerated(0.58) | benign(0.003) | TCGA-A5-A1OF-01 | Endometrium | uterine corpus endometrioid carcinoma | Female | <65 | I/II | Unknown | Unknown | SD |
| BPGM | SNV | Missense_Mutation | rs746836937 | c.257N>A | p.Arg86His | p.R86H | P07738 | protein_coding | deleterious(0.04) | probably_damaging(0.999) | TCGA-AJ-A3BG-01 | Endometrium | uterine corpus endometrioid carcinoma | Female | >=65 | I/II | Chemotherapy | carboplatin | PD |
| Page: 1 2 3 4 |
Top |
Related drugs of malignant transformation related genes |
| Identification of chemicals and drugs interact with genes involved in malignant transfromation |
| (DGIdb 4.0) |
| Entrez ID | Symbol | Category | Interaction Types | Drug Claim Name | Drug Name | PMIDs |
| Page: 1 |

Copyright 2023-Present -The University of Texas Health Science Center at Houston |