
|
|||||
|
 | |
| |
| |
| |
| |
| |
|
Gene: BORCS7 |
Gene summary for BORCS7 |
| Gene information | Species | Human | Gene symbol | BORCS7 | Gene ID | 119032 |
| Gene name | BLOC-1 related complex subunit 7 | |
| Gene Alias | C10orf32 | |
| Cytomap | 10q24.32 | |
| Gene Type | protein-coding | GO ID | GO:0000323 | UniProtAcc | A0A0B4J1R7 |
Top |
Malignant transformation analysis |
| Identification of the aberrant gene expression in precancerous and cancerous lesions by comparing the gene expression of stem-like cells in diseased tissues with normal stem cells |
| Entrez ID | Symbol | Replicates | Species | Organ | Tissue | Adj P-value | Log2FC | Malignancy |
| 119032 | BORCS7 | LZE4T | Human | Esophagus | ESCC | 3.30e-07 | 9.32e-02 | 0.0811 |
| 119032 | BORCS7 | LZE5T | Human | Esophagus | ESCC | 7.85e-04 | 5.67e-02 | 0.0514 |
| 119032 | BORCS7 | LZE8T | Human | Esophagus | ESCC | 5.69e-05 | 1.05e-01 | 0.067 |
| 119032 | BORCS7 | LZE20T | Human | Esophagus | ESCC | 1.94e-06 | 5.04e-02 | 0.0662 |
| 119032 | BORCS7 | LZE24T | Human | Esophagus | ESCC | 1.32e-17 | 5.04e-01 | 0.0596 |
| 119032 | BORCS7 | LZE21T | Human | Esophagus | ESCC | 1.94e-02 | 2.54e-02 | 0.0655 |
| 119032 | BORCS7 | LZE6T | Human | Esophagus | ESCC | 1.83e-03 | -1.61e-02 | 0.0845 |
| 119032 | BORCS7 | P1T-E | Human | Esophagus | ESCC | 1.25e-04 | 1.47e-01 | 0.0875 |
| 119032 | BORCS7 | P2T-E | Human | Esophagus | ESCC | 1.86e-13 | 1.86e-01 | 0.1177 |
| 119032 | BORCS7 | P4T-E | Human | Esophagus | ESCC | 2.02e-21 | 4.16e-01 | 0.1323 |
| 119032 | BORCS7 | P5T-E | Human | Esophagus | ESCC | 3.53e-16 | 1.95e-01 | 0.1327 |
| 119032 | BORCS7 | P8T-E | Human | Esophagus | ESCC | 9.48e-27 | 5.13e-01 | 0.0889 |
| 119032 | BORCS7 | P9T-E | Human | Esophagus | ESCC | 2.69e-07 | 2.06e-01 | 0.1131 |
| 119032 | BORCS7 | P10T-E | Human | Esophagus | ESCC | 1.01e-25 | 1.58e-01 | 0.116 |
| 119032 | BORCS7 | P11T-E | Human | Esophagus | ESCC | 3.13e-11 | 5.66e-01 | 0.1426 |
| 119032 | BORCS7 | P12T-E | Human | Esophagus | ESCC | 9.83e-28 | 5.79e-01 | 0.1122 |
| 119032 | BORCS7 | P15T-E | Human | Esophagus | ESCC | 2.67e-10 | 8.45e-02 | 0.1149 |
| 119032 | BORCS7 | P16T-E | Human | Esophagus | ESCC | 8.44e-19 | 1.39e-01 | 0.1153 |
| 119032 | BORCS7 | P17T-E | Human | Esophagus | ESCC | 8.89e-06 | 6.31e-02 | 0.1278 |
| 119032 | BORCS7 | P19T-E | Human | Esophagus | ESCC | 3.88e-02 | 2.40e-01 | 0.1662 |
| Page: 1 2 3 4 5 6 |
| Tissue | Expression Dynamics | Abbreviation |
| Esophagus |  | ESCC: Esophageal squamous cell carcinoma |
| HGIN: High-grade intraepithelial neoplasias | ||
| LGIN: Low-grade intraepithelial neoplasias | ||
| Liver | 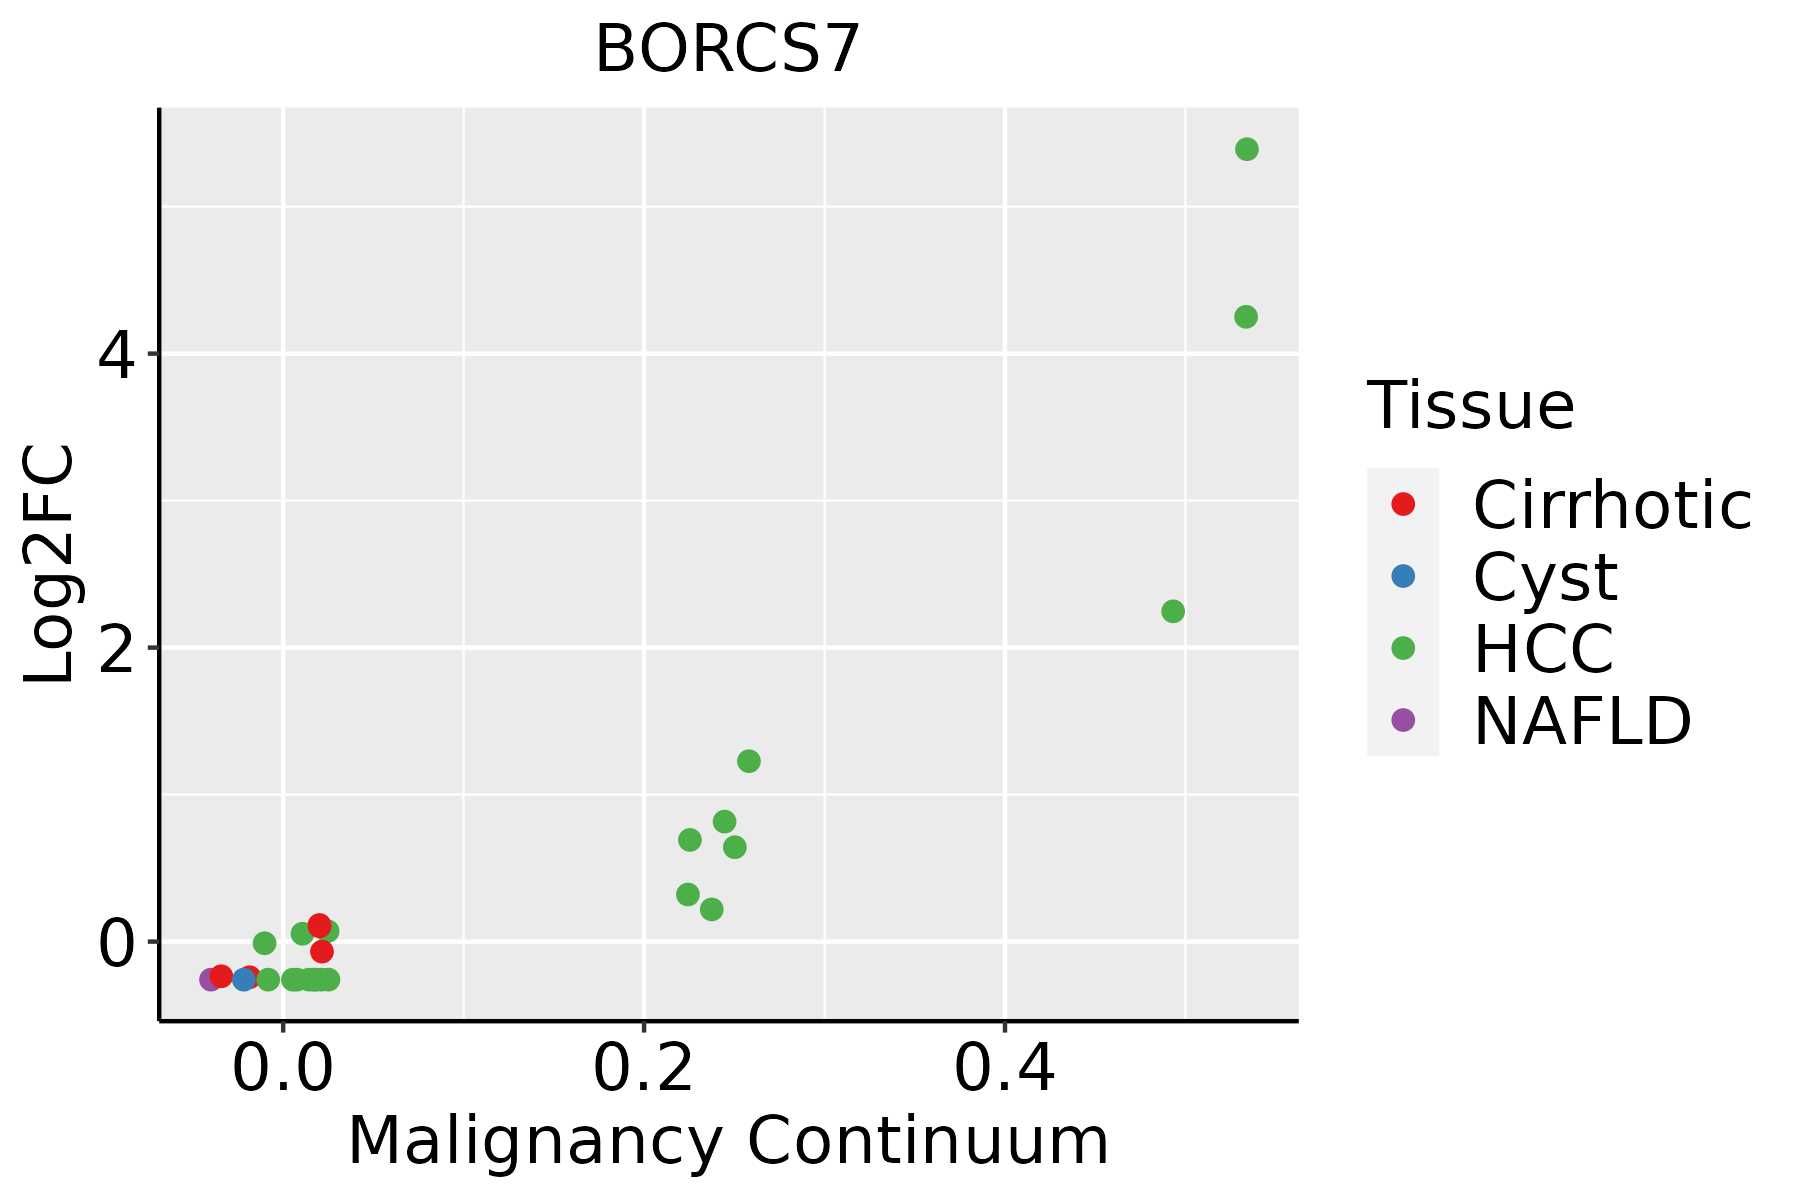 | HCC: Hepatocellular carcinoma |
| NAFLD: Non-alcoholic fatty liver disease | ||
| Oral Cavity | 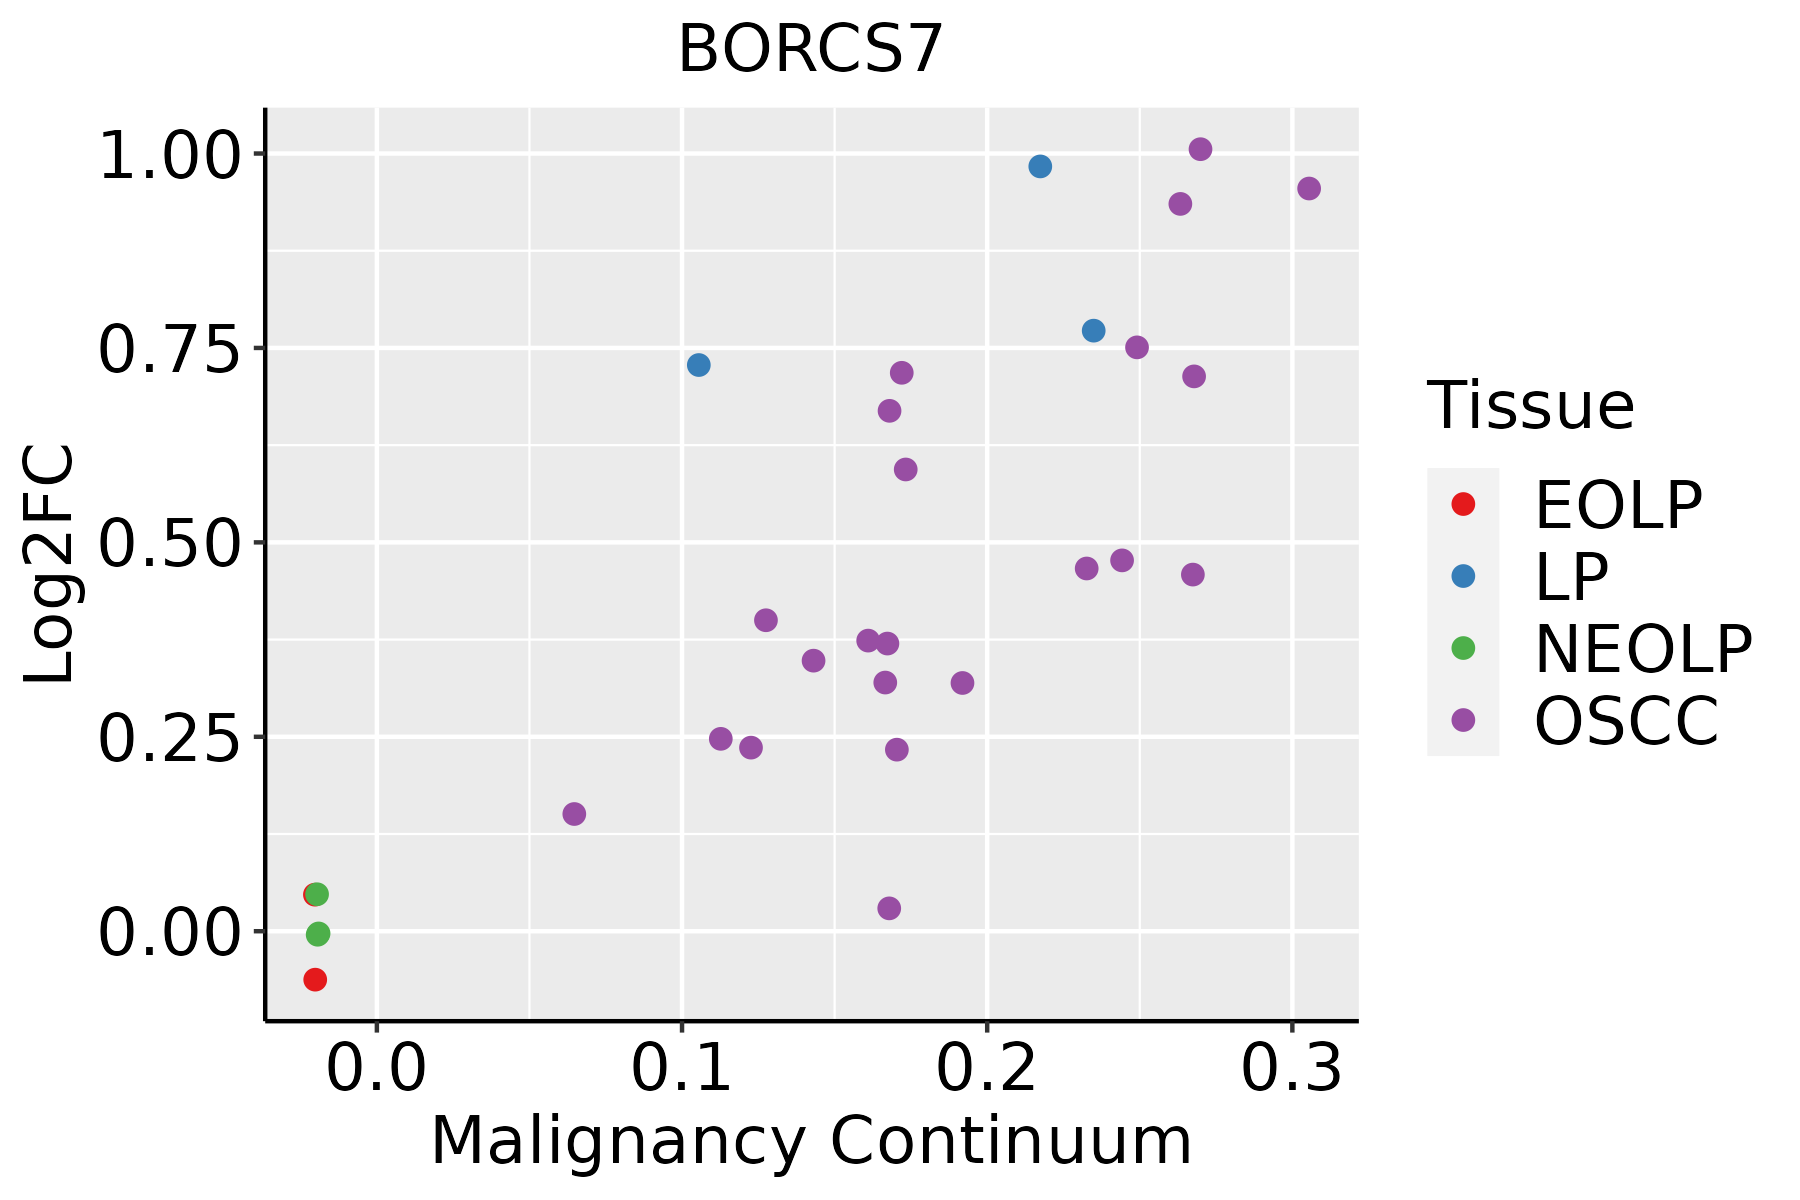 | EOLP: Erosive Oral lichen planus |
| LP: leukoplakia | ||
| NEOLP: Non-erosive oral lichen planus | ||
| OSCC: Oral squamous cell carcinoma | ||
| Thyroid |  | ATC: Anaplastic thyroid cancer |
| HT: Hashimoto's thyroiditis | ||
| PTC: Papillary thyroid cancer |
| ∗log2FC in expression of this searched gene in stem-like cells from each diseased tissue sample relative to stem-like cells in normal samples in each tissue plotted against the malignancy continuum. Samples are colored based on if they are from different disease stage. |
Top |
Malignant transformation related pathway analysis |
| Find out the enriched GO biological processes and KEGG pathways involved in transition from healthy to precancer to cancer |
| Tissue | Disease Stage | Enriched GO biological Processes |
| Colorectum | AD |  |
| Colorectum | SER |  |
| Colorectum | MSS |  |
| Colorectum | MSI-H |  |
| Colorectum | FAP |  |
| ∗Top 15 enriched GO BP terms are showed in the bar plot of each disease state in each tissue. Each row represents a significant GO biological process which is colored according to the -log10(p.adjust). |
| Page: 1 2 3 4 5 6 7 8 9 |
| GO ID | Tissue | Disease Stage | Description | Gene Ratio | Bg Ratio | pvalue | p.adjust | Count |
| Page: 1 |
| Pathway ID | Tissue | Disease Stage | Description | Gene Ratio | Bg Ratio | pvalue | p.adjust | qvalue | Count |
| Page: 1 |
Top |
Cell-cell communication analysis |
| Identification of potential cell-cell interactions between two cell types and their ligand-receptor pairs for different disease states |
| Ligand | Receptor | LRpair | Pathway | Tissue | Disease Stage |
| Page: 1 |
Top |
Single-cell gene regulatory network inference analysis |
| Find out the significant the regulons (TFs) and the target genes of each regulon across cell types for different disease states |
| TF | Cell Type | Tissue | Disease Stage | Target Gene | RSS | Regulon Activity |
| ∗The dot plots of a searched regulon are shown for all cell subpopulations in each disease state of each tissue based on the regulon specific score inferred using pySCENIC and by calculating the average expression. |
| Page: 1 |
Top |
Somatic mutation of malignant transformation related genes |
| Annotation of somatic variants for genes involved in malignant transformation |
| Hugo Symbol | Variant Class | Variant Classification | dbSNP RS | HGVSc | HGVSp | HGVSp Short | SWISSPROT | BIOTYPE | SIFT | PolyPhen | Tumor Sample Barcode | Tissue | Histology | Sex | Age | Stage | Therapy Types | Drugs | Outcome |
| BORCS7 | SNV | Missense_Mutation | rs765943098 | c.65N>T | p.Thr22Met | p.T22M | Q96B45 | protein_coding | deleterious(0.03) | possibly_damaging(0.795) | TCGA-BH-A0BR-01 | Breast | breast invasive carcinoma | Female | <65 | I/II | Unknown | Unknown | SD |
| BORCS7 | insertion | In_Frame_Ins | novel | c.303_304insGCCCAGGCTGGTCTT | p.Leu101_Asn102insAlaGlnAlaGlyLeu | p.L101_N102insAQAGL | Q96B45 | protein_coding | TCGA-BH-A0HX-01 | Breast | breast invasive carcinoma | Female | <65 | I/II | Chemotherapy | adrimycin | SD | ||
| BORCS7 | insertion | Frame_Shift_Ins | novel | c.305_306insAC | p.Asn102LysfsTer5 | p.N102Kfs*5 | Q96B45 | protein_coding | TCGA-BH-A0HX-01 | Breast | breast invasive carcinoma | Female | <65 | I/II | Chemotherapy | adrimycin | SD | ||
| BORCS7 | SNV | Missense_Mutation | c.202N>T | p.Asp68Tyr | p.D68Y | Q96B45 | protein_coding | deleterious(0.02) | possibly_damaging(0.673) | TCGA-AA-A010-01 | Colorectum | colon adenocarcinoma | Female | <65 | I/II | Chemotherapy | folinic | CR | |
| BORCS7 | SNV | Missense_Mutation | c.103N>T | p.Leu35Phe | p.L35F | Q96B45 | protein_coding | deleterious(0.03) | benign(0.315) | TCGA-AD-A5EJ-01 | Colorectum | colon adenocarcinoma | Female | >=65 | I/II | Unknown | Unknown | SD | |
| BORCS7 | SNV | Missense_Mutation | rs748603513 | c.227N>C | p.Ile76Thr | p.I76T | Q96B45 | protein_coding | tolerated(0.1) | benign(0.049) | TCGA-CM-5861-01 | Colorectum | colon adenocarcinoma | Female | <65 | I/II | Unknown | Unknown | PD |
| BORCS7 | SNV | Missense_Mutation | novel | c.161G>A | p.Arg54Gln | p.R54Q | Q96B45 | protein_coding | tolerated(0.07) | benign(0.177) | TCGA-F5-6814-01 | Colorectum | rectum adenocarcinoma | Male | <65 | I/II | Unknown | Unknown | SD |
| BORCS7 | SNV | Missense_Mutation | novel | c.294N>T | p.Gln98His | p.Q98H | Q96B45 | protein_coding | deleterious(0.02) | possibly_damaging(0.789) | TCGA-A5-A1OF-01 | Endometrium | uterine corpus endometrioid carcinoma | Female | <65 | I/II | Unknown | Unknown | SD |
| BORCS7 | SNV | Missense_Mutation | novel | c.149N>A | p.Gly50Asp | p.G50D | Q96B45 | protein_coding | tolerated(0.13) | possibly_damaging(0.676) | TCGA-AP-A059-01 | Endometrium | uterine corpus endometrioid carcinoma | Female | >=65 | I/II | Unknown | Unknown | SD |
| BORCS7 | SNV | Missense_Mutation | novel | c.219G>T | p.Met73Ile | p.M73I | Q96B45 | protein_coding | tolerated(0.07) | possibly_damaging(0.465) | TCGA-AX-A2HC-01 | Endometrium | uterine corpus endometrioid carcinoma | Female | <65 | III/IV | Chemotherapy | paclitaxel | PD |
| Page: 1 2 |
Top |
Related drugs of malignant transformation related genes |
| Identification of chemicals and drugs interact with genes involved in malignant transfromation |
| (DGIdb 4.0) |
| Entrez ID | Symbol | Category | Interaction Types | Drug Claim Name | Drug Name | PMIDs |
| Page: 1 |

Copyright 2023-Present -The University of Texas Health Science Center at Houston |