
|
|||||
|
 | |
| |
| |
| |
| |
| |
|
Gene: BORCS6 |
Gene summary for BORCS6 |
| Gene information | Species | Human | Gene symbol | BORCS6 | Gene ID | 54785 |
| Gene name | BLOC-1 related complex subunit 6 | |
| Gene Alias | C17orf59 | |
| Cytomap | 17p13.1 | |
| Gene Type | protein-coding | GO ID | GO:0008150 | UniProtAcc | Q96GS4 |
Top |
Malignant transformation analysis |
| Identification of the aberrant gene expression in precancerous and cancerous lesions by comparing the gene expression of stem-like cells in diseased tissues with normal stem cells |
| Entrez ID | Symbol | Replicates | Species | Organ | Tissue | Adj P-value | Log2FC | Malignancy |
| 54785 | BORCS6 | LZE4T | Human | Esophagus | ESCC | 4.26e-03 | 2.41e-01 | 0.0811 |
| 54785 | BORCS6 | LZE20T | Human | Esophagus | ESCC | 4.25e-02 | 1.11e-01 | 0.0662 |
| 54785 | BORCS6 | LZE22T | Human | Esophagus | ESCC | 6.78e-03 | 2.02e-01 | 0.068 |
| 54785 | BORCS6 | LZE24T | Human | Esophagus | ESCC | 8.76e-16 | 4.75e-01 | 0.0596 |
| 54785 | BORCS6 | LZE21T | Human | Esophagus | ESCC | 2.17e-03 | 1.86e-01 | 0.0655 |
| 54785 | BORCS6 | P1T-E | Human | Esophagus | ESCC | 1.56e-06 | 3.28e-01 | 0.0875 |
| 54785 | BORCS6 | P2T-E | Human | Esophagus | ESCC | 2.63e-07 | 1.84e-01 | 0.1177 |
| 54785 | BORCS6 | P4T-E | Human | Esophagus | ESCC | 2.26e-12 | 4.01e-01 | 0.1323 |
| 54785 | BORCS6 | P5T-E | Human | Esophagus | ESCC | 1.23e-02 | 1.07e-01 | 0.1327 |
| 54785 | BORCS6 | P8T-E | Human | Esophagus | ESCC | 1.30e-12 | 1.20e-01 | 0.0889 |
| 54785 | BORCS6 | P10T-E | Human | Esophagus | ESCC | 9.44e-09 | 7.76e-02 | 0.116 |
| 54785 | BORCS6 | P11T-E | Human | Esophagus | ESCC | 2.68e-07 | 4.70e-01 | 0.1426 |
| 54785 | BORCS6 | P12T-E | Human | Esophagus | ESCC | 9.34e-13 | 2.53e-01 | 0.1122 |
| 54785 | BORCS6 | P15T-E | Human | Esophagus | ESCC | 4.56e-10 | 1.14e-01 | 0.1149 |
| 54785 | BORCS6 | P16T-E | Human | Esophagus | ESCC | 1.53e-12 | 2.00e-01 | 0.1153 |
| 54785 | BORCS6 | P17T-E | Human | Esophagus | ESCC | 3.80e-10 | 3.09e-01 | 0.1278 |
| 54785 | BORCS6 | P19T-E | Human | Esophagus | ESCC | 3.43e-04 | 5.25e-01 | 0.1662 |
| 54785 | BORCS6 | P20T-E | Human | Esophagus | ESCC | 4.36e-13 | 2.24e-01 | 0.1124 |
| 54785 | BORCS6 | P21T-E | Human | Esophagus | ESCC | 4.47e-11 | 1.63e-01 | 0.1617 |
| 54785 | BORCS6 | P22T-E | Human | Esophagus | ESCC | 2.44e-09 | 2.17e-01 | 0.1236 |
| Page: 1 2 3 |
| Tissue | Expression Dynamics | Abbreviation |
| Esophagus | 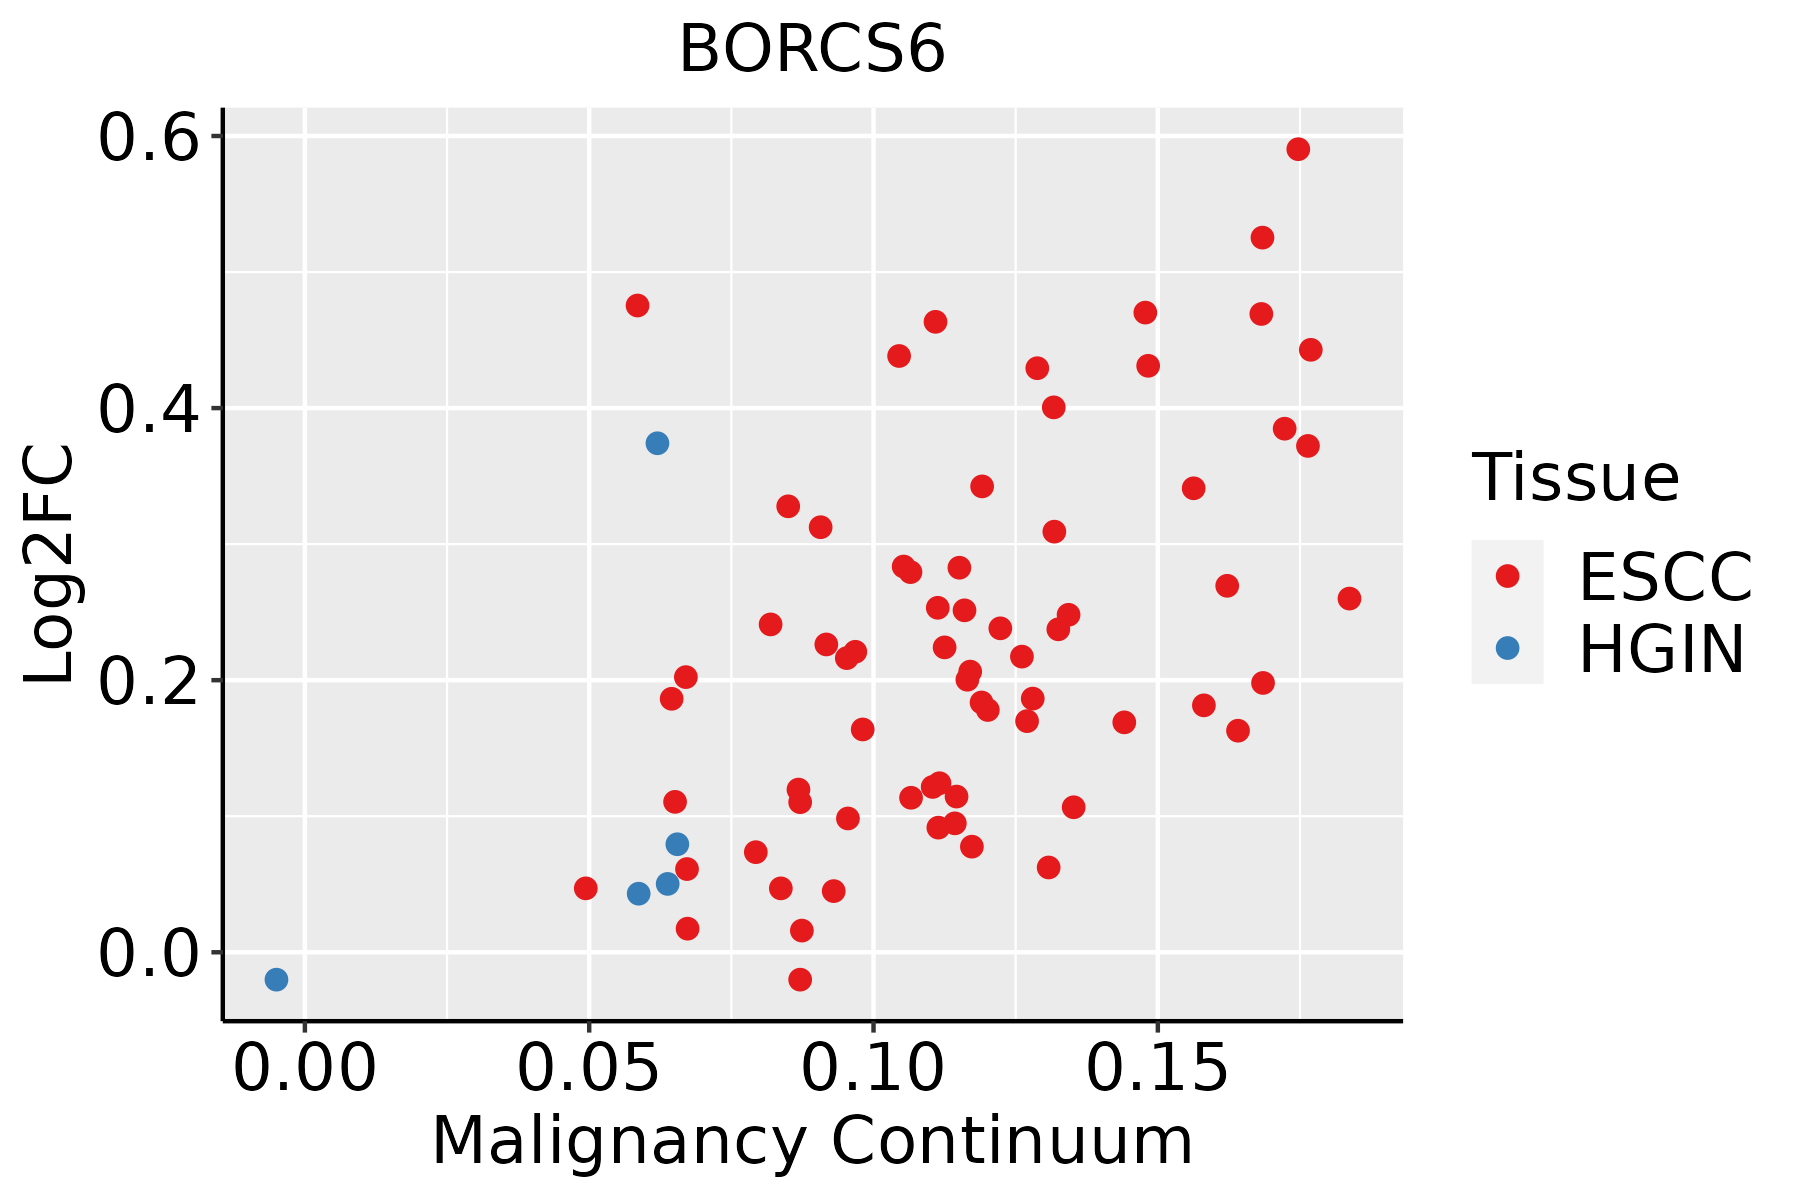 | ESCC: Esophageal squamous cell carcinoma |
| HGIN: High-grade intraepithelial neoplasias | ||
| LGIN: Low-grade intraepithelial neoplasias |
| ∗log2FC in expression of this searched gene in stem-like cells from each diseased tissue sample relative to stem-like cells in normal samples in each tissue plotted against the malignancy continuum. Samples are colored based on if they are from different disease stage. |
Top |
Malignant transformation related pathway analysis |
| Find out the enriched GO biological processes and KEGG pathways involved in transition from healthy to precancer to cancer |
| Tissue | Disease Stage | Enriched GO biological Processes |
| Colorectum | AD |  |
| Colorectum | SER |  |
| Colorectum | MSS |  |
| Colorectum | MSI-H |  |
| Colorectum | FAP |  |
| ∗Top 15 enriched GO BP terms are showed in the bar plot of each disease state in each tissue. Each row represents a significant GO biological process which is colored according to the -log10(p.adjust). |
| Page: 1 2 3 4 5 6 7 8 9 |
| GO ID | Tissue | Disease Stage | Description | Gene Ratio | Bg Ratio | pvalue | p.adjust | Count |
| Page: 1 |
| Pathway ID | Tissue | Disease Stage | Description | Gene Ratio | Bg Ratio | pvalue | p.adjust | qvalue | Count |
| Page: 1 |
Top |
Cell-cell communication analysis |
| Identification of potential cell-cell interactions between two cell types and their ligand-receptor pairs for different disease states |
| Ligand | Receptor | LRpair | Pathway | Tissue | Disease Stage |
| Page: 1 |
Top |
Single-cell gene regulatory network inference analysis |
| Find out the significant the regulons (TFs) and the target genes of each regulon across cell types for different disease states |
| TF | Cell Type | Tissue | Disease Stage | Target Gene | RSS | Regulon Activity |
| ∗The dot plots of a searched regulon are shown for all cell subpopulations in each disease state of each tissue based on the regulon specific score inferred using pySCENIC and by calculating the average expression. |
| Page: 1 |
Top |
Somatic mutation of malignant transformation related genes |
| Annotation of somatic variants for genes involved in malignant transformation |
| Hugo Symbol | Variant Class | Variant Classification | dbSNP RS | HGVSc | HGVSp | HGVSp Short | SWISSPROT | BIOTYPE | SIFT | PolyPhen | Tumor Sample Barcode | Tissue | Histology | Sex | Age | Stage | Therapy Types | Drugs | Outcome |
| BORCS6 | SNV | Missense_Mutation | c.985N>A | p.Glu329Lys | p.E329K | Q96GS4 | protein_coding | deleterious(0.02) | probably_damaging(0.966) | TCGA-AC-A23H-01 | Breast | breast invasive carcinoma | Female | >=65 | I/II | Unknown | Unknown | PD | |
| BORCS6 | SNV | Missense_Mutation | c.13N>T | p.Arg5Trp | p.R5W | Q96GS4 | protein_coding | tolerated_low_confidence(0.06) | benign(0.003) | TCGA-UC-A7PF-01 | Cervix | cervical & endocervical cancer | Female | <65 | I/II | Unknown | Unknown | SD | |
| BORCS6 | SNV | Missense_Mutation | novel | c.826G>A | p.Asp276Asn | p.D276N | Q96GS4 | protein_coding | deleterious(0.03) | probably_damaging(0.924) | TCGA-AA-3949-01 | Colorectum | colon adenocarcinoma | Female | >=65 | III/IV | Unknown | Unknown | SD |
| BORCS6 | SNV | Missense_Mutation | rs766704278 | c.938T>C | p.Met313Thr | p.M313T | Q96GS4 | protein_coding | tolerated(0.1) | probably_damaging(0.953) | TCGA-AA-A01R-01 | Colorectum | colon adenocarcinoma | Male | <65 | III/IV | Chemotherapy | 5-fluorouracil | PD |
| BORCS6 | SNV | Missense_Mutation | c.649N>A | p.Val217Ile | p.V217I | Q96GS4 | protein_coding | tolerated(0.09) | possibly_damaging(0.557) | TCGA-EI-6882-01 | Colorectum | rectum adenocarcinoma | Male | <65 | I/II | Unknown | Unknown | SD | |
| BORCS6 | SNV | Missense_Mutation | novel | c.790N>A | p.Leu264Met | p.L264M | Q96GS4 | protein_coding | deleterious(0.02) | probably_damaging(0.999) | TCGA-A5-A0G2-01 | Endometrium | uterine corpus endometrioid carcinoma | Female | <65 | III/IV | Unknown | Unknown | SD |
| BORCS6 | SNV | Missense_Mutation | c.824N>C | p.Val275Ala | p.V275A | Q96GS4 | protein_coding | deleterious(0) | possibly_damaging(0.841) | TCGA-AP-A054-01 | Endometrium | uterine corpus endometrioid carcinoma | Female | <65 | III/IV | Chemotherapy | carboplatin | PD | |
| BORCS6 | SNV | Missense_Mutation | novel | c.894G>T | p.Gln298His | p.Q298H | Q96GS4 | protein_coding | deleterious(0) | probably_damaging(0.999) | TCGA-AX-A2HC-01 | Endometrium | uterine corpus endometrioid carcinoma | Female | <65 | III/IV | Chemotherapy | paclitaxel | PD |
| BORCS6 | SNV | Missense_Mutation | novel | c.467N>A | p.Gly156Asp | p.G156D | Q96GS4 | protein_coding | deleterious_low_confidence(0) | benign(0.276) | TCGA-4R-AA8I-01 | Liver | liver hepatocellular carcinoma | Male | >=65 | I/II | Unknown | Unknown | PD |
| BORCS6 | insertion | Frame_Shift_Ins | novel | c.29_30insGCCCC | p.Glu11ProfsTer9 | p.E11Pfs*9 | Q96GS4 | protein_coding | TCGA-DD-A11D-01 | Liver | liver hepatocellular carcinoma | Female | <65 | I/II | Targeted Molecular therapy | sorafenib | PD |
| Page: 1 2 |
Top |
Related drugs of malignant transformation related genes |
| Identification of chemicals and drugs interact with genes involved in malignant transfromation |
| (DGIdb 4.0) |
| Entrez ID | Symbol | Category | Interaction Types | Drug Claim Name | Drug Name | PMIDs |
| Page: 1 |

Copyright 2023-Present -The University of Texas Health Science Center at Houston |