
|
|||||
|
 | |
| |
| |
| |
| |
| |
|
Gene: BORCS5 |
Gene summary for BORCS5 |
| Gene information | Species | Human | Gene symbol | BORCS5 | Gene ID | 118426 |
| Gene name | BLOC-1 related complex subunit 5 | |
| Gene Alias | LOH12CR1 | |
| Cytomap | 12p13.2 | |
| Gene Type | protein-coding | GO ID | GO:0006810 | UniProtAcc | G3V1P3 |
Top |
Malignant transformation analysis |
| Identification of the aberrant gene expression in precancerous and cancerous lesions by comparing the gene expression of stem-like cells in diseased tissues with normal stem cells |
| Entrez ID | Symbol | Replicates | Species | Organ | Tissue | Adj P-value | Log2FC | Malignancy |
| 118426 | BORCS5 | LZE4T | Human | Esophagus | ESCC | 5.40e-08 | 2.66e-01 | 0.0811 |
| 118426 | BORCS5 | LZE7T | Human | Esophagus | ESCC | 6.39e-13 | 4.48e-01 | 0.0667 |
| 118426 | BORCS5 | LZE8T | Human | Esophagus | ESCC | 3.27e-08 | 2.19e-01 | 0.067 |
| 118426 | BORCS5 | LZE20T | Human | Esophagus | ESCC | 8.75e-03 | 1.17e-01 | 0.0662 |
| 118426 | BORCS5 | LZE21D1 | Human | Esophagus | HGIN | 1.95e-02 | 2.49e-01 | 0.0632 |
| 118426 | BORCS5 | LZE22D1 | Human | Esophagus | HGIN | 8.30e-07 | 2.24e-01 | 0.0595 |
| 118426 | BORCS5 | LZE22T | Human | Esophagus | ESCC | 4.39e-03 | 2.38e-01 | 0.068 |
| 118426 | BORCS5 | LZE24T | Human | Esophagus | ESCC | 3.92e-09 | 1.98e-01 | 0.0596 |
| 118426 | BORCS5 | LZE21T | Human | Esophagus | ESCC | 9.21e-07 | 3.30e-01 | 0.0655 |
| 118426 | BORCS5 | LZE6T | Human | Esophagus | ESCC | 9.57e-14 | 3.83e-01 | 0.0845 |
| 118426 | BORCS5 | P1T-E | Human | Esophagus | ESCC | 7.33e-10 | 2.99e-01 | 0.0875 |
| 118426 | BORCS5 | P2T-E | Human | Esophagus | ESCC | 4.61e-33 | 5.63e-01 | 0.1177 |
| 118426 | BORCS5 | P4T-E | Human | Esophagus | ESCC | 3.06e-41 | 7.98e-01 | 0.1323 |
| 118426 | BORCS5 | P5T-E | Human | Esophagus | ESCC | 3.91e-24 | 4.40e-01 | 0.1327 |
| 118426 | BORCS5 | P8T-E | Human | Esophagus | ESCC | 5.93e-08 | 1.41e-01 | 0.0889 |
| 118426 | BORCS5 | P9T-E | Human | Esophagus | ESCC | 6.04e-19 | 4.05e-01 | 0.1131 |
| 118426 | BORCS5 | P10T-E | Human | Esophagus | ESCC | 7.94e-26 | 4.20e-01 | 0.116 |
| 118426 | BORCS5 | P11T-E | Human | Esophagus | ESCC | 4.22e-05 | 1.49e-01 | 0.1426 |
| 118426 | BORCS5 | P12T-E | Human | Esophagus | ESCC | 5.84e-43 | 7.55e-01 | 0.1122 |
| 118426 | BORCS5 | P15T-E | Human | Esophagus | ESCC | 9.49e-22 | 4.44e-01 | 0.1149 |
| Page: 1 2 3 4 5 |
| Tissue | Expression Dynamics | Abbreviation |
| Esophagus |  | ESCC: Esophageal squamous cell carcinoma |
| HGIN: High-grade intraepithelial neoplasias | ||
| LGIN: Low-grade intraepithelial neoplasias | ||
| Liver | 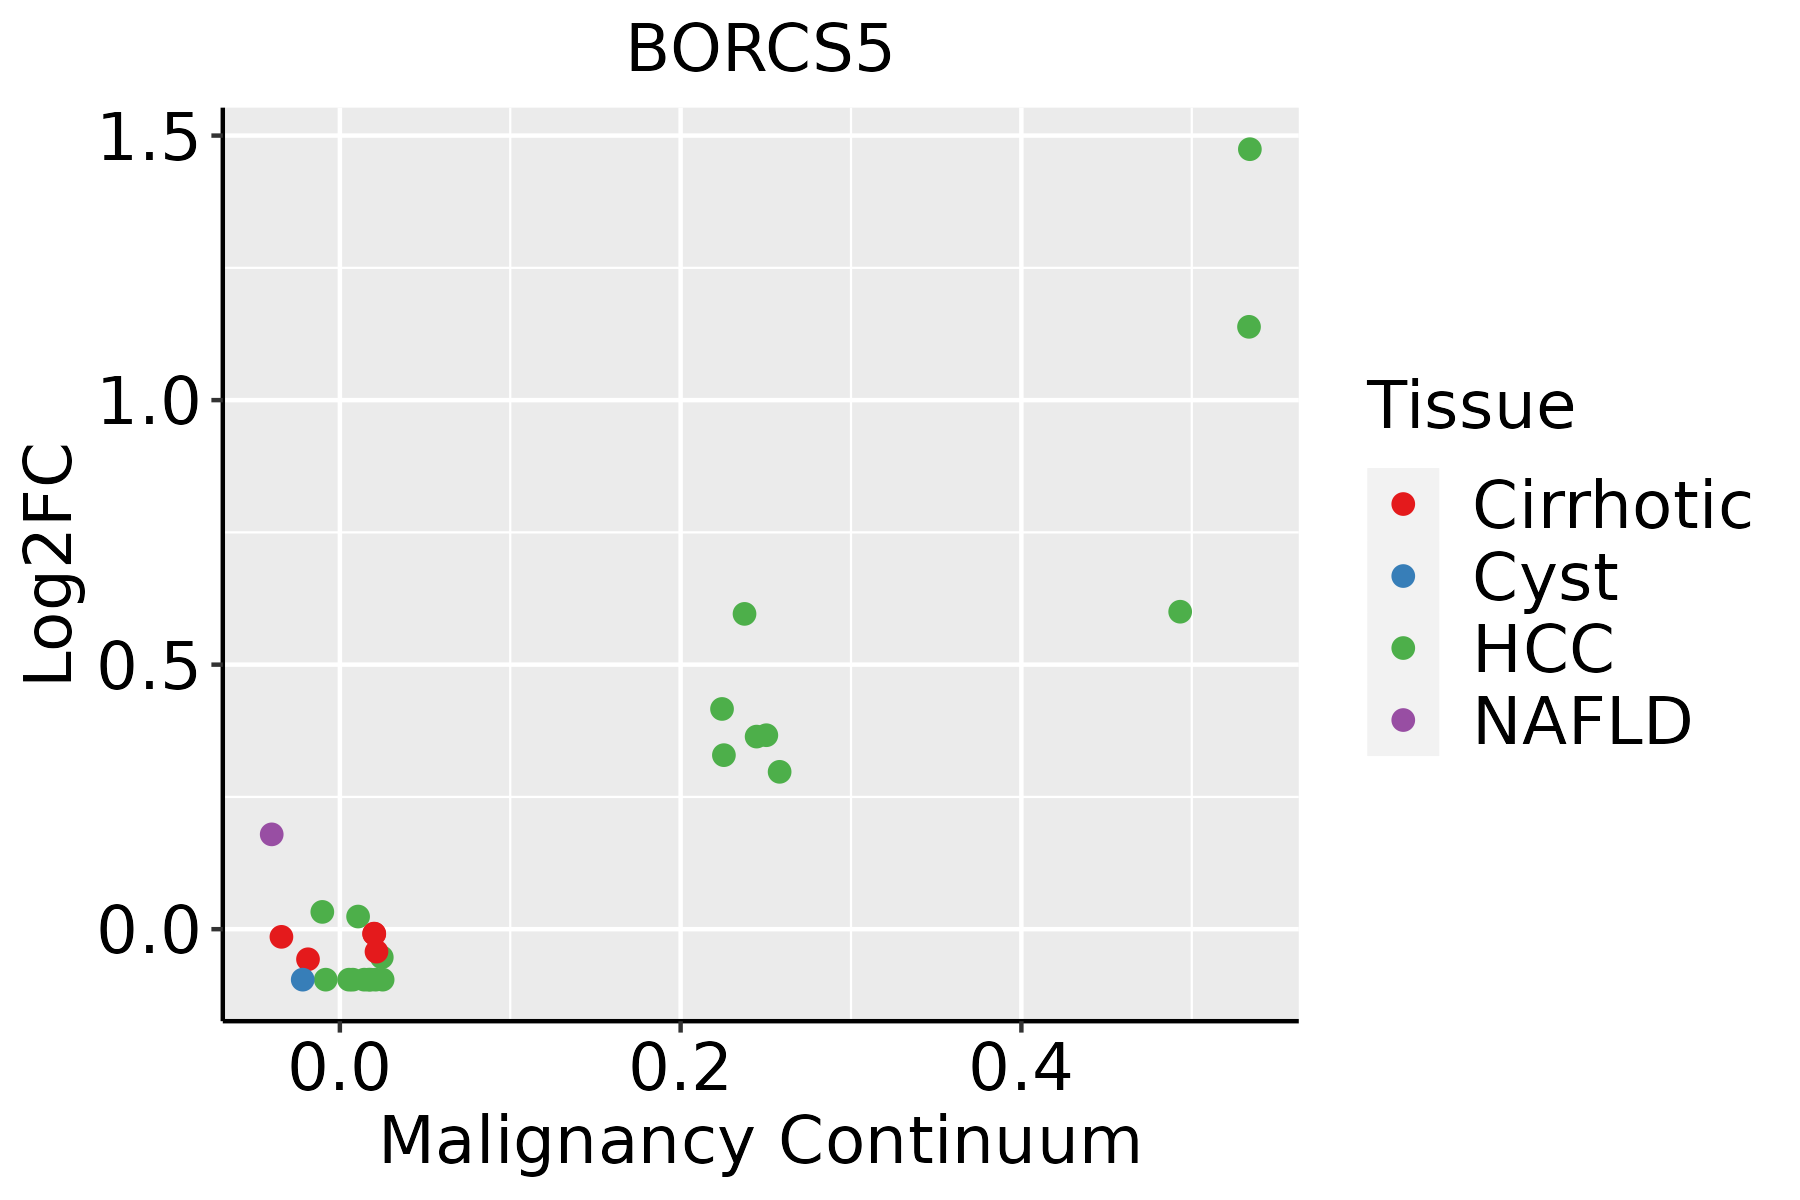 | HCC: Hepatocellular carcinoma |
| NAFLD: Non-alcoholic fatty liver disease | ||
| Oral Cavity | 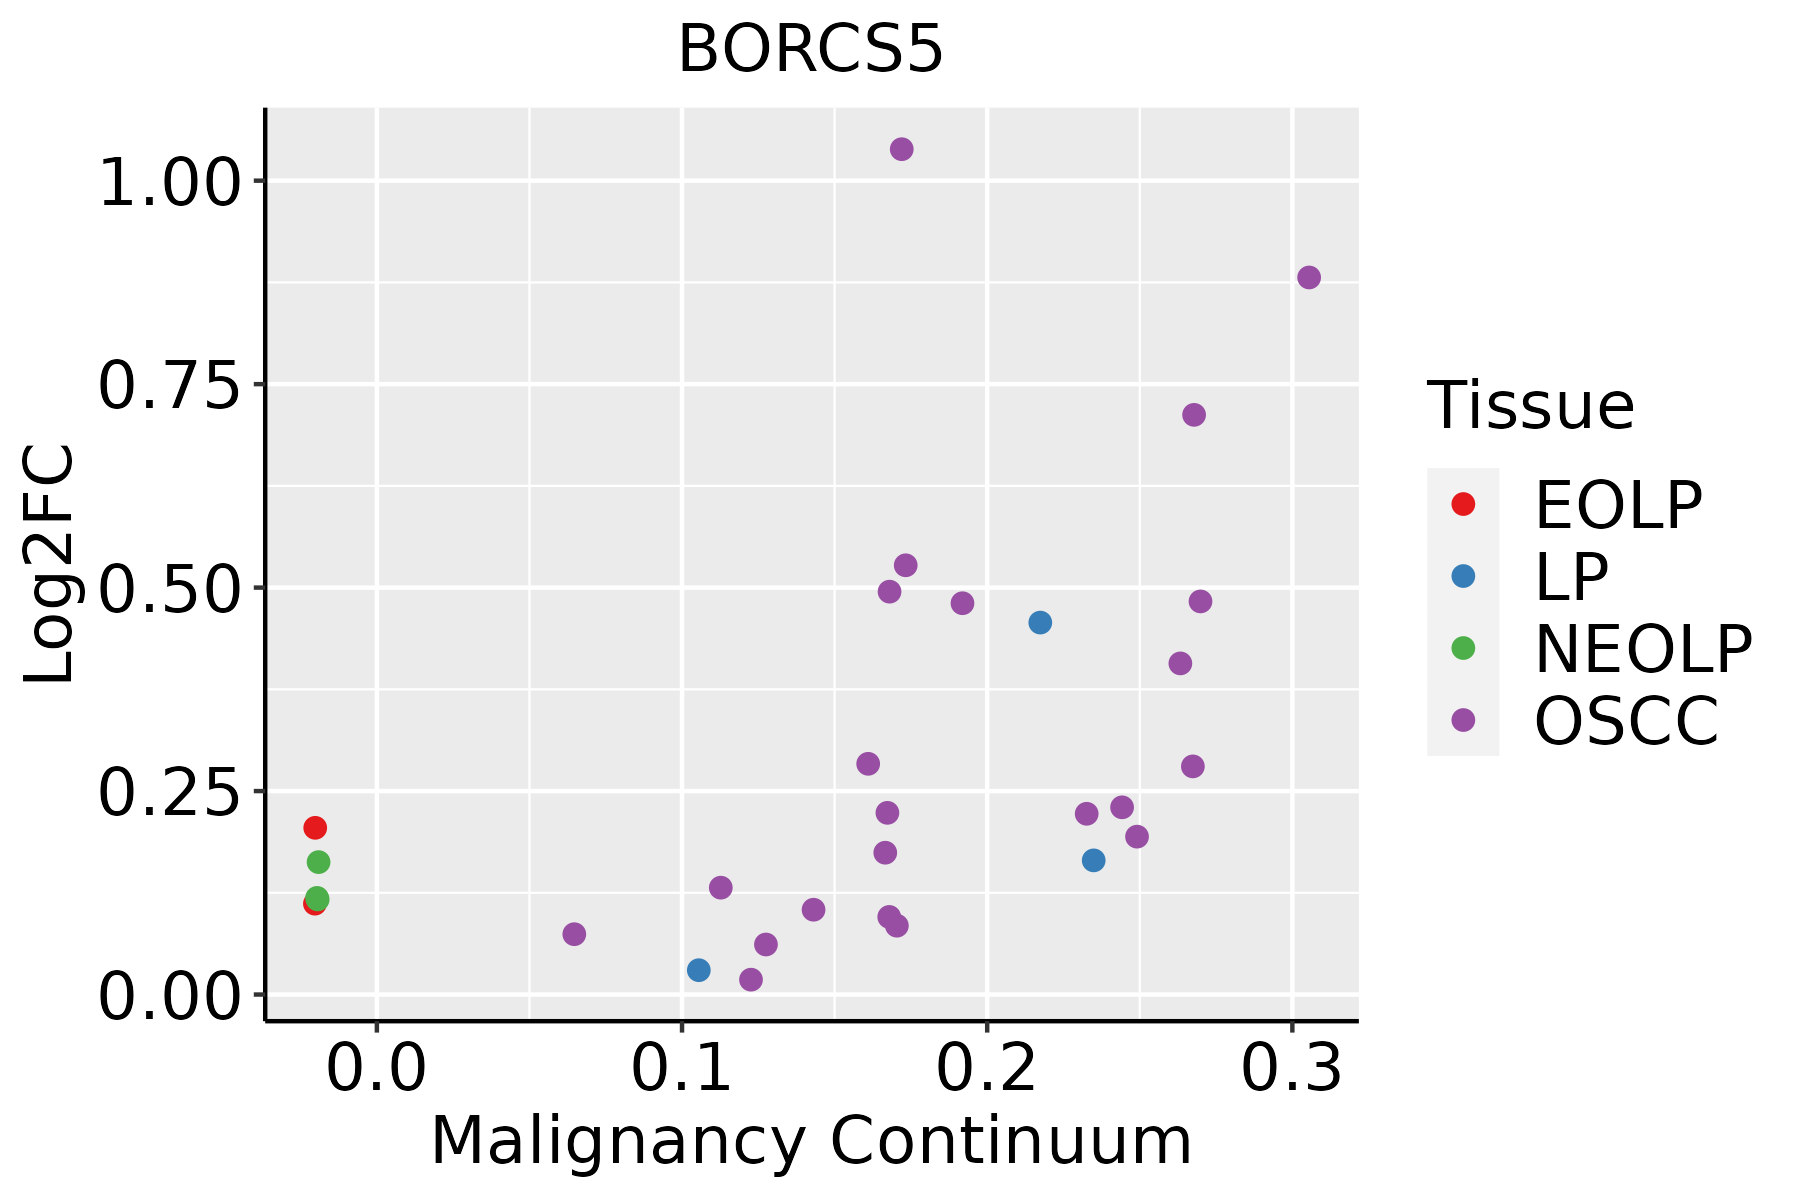 | EOLP: Erosive Oral lichen planus |
| LP: leukoplakia | ||
| NEOLP: Non-erosive oral lichen planus | ||
| OSCC: Oral squamous cell carcinoma |
| ∗log2FC in expression of this searched gene in stem-like cells from each diseased tissue sample relative to stem-like cells in normal samples in each tissue plotted against the malignancy continuum. Samples are colored based on if they are from different disease stage. |
Top |
Malignant transformation related pathway analysis |
| Find out the enriched GO biological processes and KEGG pathways involved in transition from healthy to precancer to cancer |
| Tissue | Disease Stage | Enriched GO biological Processes |
| Colorectum | AD |  |
| Colorectum | SER |  |
| Colorectum | MSS |  |
| Colorectum | MSI-H |  |
| Colorectum | FAP |  |
| ∗Top 15 enriched GO BP terms are showed in the bar plot of each disease state in each tissue. Each row represents a significant GO biological process which is colored according to the -log10(p.adjust). |
| Page: 1 2 3 4 5 6 7 8 9 |
| GO ID | Tissue | Disease Stage | Description | Gene Ratio | Bg Ratio | pvalue | p.adjust | Count |
| GO:005165616 | Esophagus | HGIN | establishment of organelle localization | 90/2587 | 390/18723 | 4.27e-07 | 1.94e-05 | 90 |
| GO:003238617 | Esophagus | HGIN | regulation of intracellular transport | 79/2587 | 337/18723 | 1.11e-06 | 4.36e-05 | 79 |
| GO:003238820 | Esophagus | HGIN | positive regulation of intracellular transport | 51/2587 | 202/18723 | 1.00e-05 | 2.92e-04 | 51 |
| GO:003070517 | Esophagus | HGIN | cytoskeleton-dependent intracellular transport | 45/2587 | 195/18723 | 3.07e-04 | 5.15e-03 | 45 |
| GO:00109707 | Esophagus | HGIN | transport along microtubule | 35/2587 | 155/18723 | 2.01e-03 | 2.12e-02 | 35 |
| GO:005165010 | Esophagus | HGIN | establishment of vesicle localization | 35/2587 | 161/18723 | 3.89e-03 | 3.54e-02 | 35 |
| GO:005164810 | Esophagus | HGIN | vesicle localization | 37/2587 | 177/18723 | 6.03e-03 | 4.87e-02 | 37 |
| GO:003238618 | Esophagus | ESCC | regulation of intracellular transport | 243/8552 | 337/18723 | 3.20e-23 | 7.25e-21 | 243 |
| GO:005165617 | Esophagus | ESCC | establishment of organelle localization | 273/8552 | 390/18723 | 9.13e-23 | 1.81e-20 | 273 |
| GO:0032388110 | Esophagus | ESCC | positive regulation of intracellular transport | 152/8552 | 202/18723 | 7.89e-18 | 7.36e-16 | 152 |
| GO:005165016 | Esophagus | ESCC | establishment of vesicle localization | 114/8552 | 161/18723 | 8.20e-11 | 2.53e-09 | 114 |
| GO:003070518 | Esophagus | ESCC | cytoskeleton-dependent intracellular transport | 133/8552 | 195/18723 | 1.48e-10 | 4.27e-09 | 133 |
| GO:001097013 | Esophagus | ESCC | transport along microtubule | 107/8552 | 155/18723 | 3.17e-09 | 6.80e-08 | 107 |
| GO:005164815 | Esophagus | ESCC | vesicle localization | 119/8552 | 177/18723 | 5.16e-09 | 1.08e-07 | 119 |
| GO:00723846 | Esophagus | ESCC | organelle transport along microtubule | 65/8552 | 85/18723 | 6.61e-09 | 1.35e-07 | 65 |
| GO:000808810 | Esophagus | ESCC | axo-dendritic transport | 58/8552 | 75/18723 | 2.09e-08 | 4.02e-07 | 58 |
| GO:00989304 | Esophagus | ESCC | axonal transport | 49/8552 | 64/18723 | 4.54e-07 | 6.15e-06 | 49 |
| GO:00474962 | Esophagus | ESCC | vesicle transport along microtubule | 36/8552 | 47/18723 | 1.53e-05 | 1.38e-04 | 36 |
| GO:00991114 | Esophagus | ESCC | microtubule-based transport | 115/8552 | 190/18723 | 2.54e-05 | 2.15e-04 | 115 |
| GO:00080892 | Esophagus | ESCC | anterograde axonal transport | 37/8552 | 50/18723 | 4.42e-05 | 3.51e-04 | 37 |
| Page: 1 2 3 4 |
| Pathway ID | Tissue | Disease Stage | Description | Gene Ratio | Bg Ratio | pvalue | p.adjust | qvalue | Count |
| Page: 1 |
Top |
Cell-cell communication analysis |
| Identification of potential cell-cell interactions between two cell types and their ligand-receptor pairs for different disease states |
| Ligand | Receptor | LRpair | Pathway | Tissue | Disease Stage |
| Page: 1 |
Top |
Single-cell gene regulatory network inference analysis |
| Find out the significant the regulons (TFs) and the target genes of each regulon across cell types for different disease states |
| TF | Cell Type | Tissue | Disease Stage | Target Gene | RSS | Regulon Activity |
| ∗The dot plots of a searched regulon are shown for all cell subpopulations in each disease state of each tissue based on the regulon specific score inferred using pySCENIC and by calculating the average expression. |
| Page: 1 |
Top |
Somatic mutation of malignant transformation related genes |
| Annotation of somatic variants for genes involved in malignant transformation |
| Hugo Symbol | Variant Class | Variant Classification | dbSNP RS | HGVSc | HGVSp | HGVSp Short | SWISSPROT | BIOTYPE | SIFT | PolyPhen | Tumor Sample Barcode | Tissue | Histology | Sex | Age | Stage | Therapy Types | Drugs | Outcome |
| BORCS5 | SNV | Missense_Mutation | rs199869851 | c.490G>A | p.Asp164Asn | p.D164N | Q969J3 | protein_coding | tolerated(0.49) | benign(0.167) | TCGA-AA-3672-01 | Colorectum | colon adenocarcinoma | Female | >=65 | III/IV | Unknown | Unknown | SD |
| BORCS5 | SNV | Missense_Mutation | rs757456437 | c.472N>T | p.Arg158Cys | p.R158C | Q969J3 | protein_coding | deleterious(0) | probably_damaging(0.989) | TCGA-AP-A059-01 | Endometrium | uterine corpus endometrioid carcinoma | Female | >=65 | I/II | Unknown | Unknown | SD |
| BORCS5 | SNV | Missense_Mutation | novel | c.148G>A | p.Asp50Asn | p.D50N | Q969J3 | protein_coding | deleterious(0.03) | benign(0.44) | TCGA-AP-A1DV-01 | Endometrium | uterine corpus endometrioid carcinoma | Female | <65 | I/II | Unknown | Unknown | SD |
| BORCS5 | SNV | Missense_Mutation | rs756685157 | c.479N>C | p.Gln160Pro | p.Q160P | Q969J3 | protein_coding | deleterious(0.01) | probably_damaging(0.943) | TCGA-B5-A3FA-01 | Endometrium | uterine corpus endometrioid carcinoma | Female | >=65 | I/II | Unknown | Unknown | SD |
| BORCS5 | SNV | Missense_Mutation | c.338N>T | p.Ala113Val | p.A113V | Q969J3 | protein_coding | deleterious(0.03) | possibly_damaging(0.491) | TCGA-BS-A0UF-01 | Endometrium | uterine corpus endometrioid carcinoma | Female | >=65 | I/II | Unknown | Unknown | SD | |
| BORCS5 | SNV | Missense_Mutation | c.154N>T | p.Asp52Tyr | p.D52Y | Q969J3 | protein_coding | deleterious(0) | possibly_damaging(0.894) | TCGA-55-8205-01 | Lung | lung adenocarcinoma | Female | >=65 | I/II | Chemotherapy | carboplatin | PD | |
| BORCS5 | SNV | Missense_Mutation | novel | c.287N>G | p.Tyr96Cys | p.Y96C | Q969J3 | protein_coding | deleterious(0.04) | probably_damaging(0.995) | TCGA-56-A5DR-01 | Lung | lung squamous cell carcinoma | Male | >=65 | I/II | Unknown | Unknown | SD |
| BORCS5 | SNV | Missense_Mutation | c.470N>A | p.Arg157His | p.R157H | Q969J3 | protein_coding | deleterious(0.01) | probably_damaging(0.945) | TCGA-B7-5816-01 | Stomach | stomach adenocarcinoma | Female | <65 | I/II | Unknown | Unknown | SD | |
| BORCS5 | SNV | Missense_Mutation | c.397N>A | p.Gln133Lys | p.Q133K | Q969J3 | protein_coding | tolerated(0.23) | possibly_damaging(0.459) | TCGA-CD-5813-01 | Stomach | stomach adenocarcinoma | Male | <65 | I/II | Unknown | Unknown | PD | |
| BORCS5 | SNV | Missense_Mutation | c.210G>C | p.Leu70Phe | p.L70F | Q969J3 | protein_coding | deleterious(0.02) | benign(0.233) | TCGA-D7-8572-01 | Stomach | stomach adenocarcinoma | Male | <65 | I/II | Unknown | Unknown | SD |
| Page: 1 2 |
Top |
Related drugs of malignant transformation related genes |
| Identification of chemicals and drugs interact with genes involved in malignant transfromation |
| (DGIdb 4.0) |
| Entrez ID | Symbol | Category | Interaction Types | Drug Claim Name | Drug Name | PMIDs |
| Page: 1 |

Copyright 2023-Present -The University of Texas Health Science Center at Houston |