Schematic overview of the cellular and molecular mechanisms involved in the cancer progression, including the proposed cellular and molecular mechanisms in cancer cells trajectory. AT1: alveolar type 1 cells; AT2: alveolar type 2 cells; AAH: atypical adenomatous hyperplasia; AIS: adenocarcinoma in situ; MIA: minimally invasive adenocarcinoma; IA: invasive adenocarcinoma; EMT: epithelial-mesenchymal transition

Home

Download

Statistics

Help

Contact

Center for Computational Systems Medicine
leaf

Gene summary

leaf

Malignant transformation analysis

leaf

Malignant transformation related pathway analysis

leaf

Cell-cell communication analysis

leaf

Single-cell gene regulatory network inference analysis

leaf

Somatic mutation of malignant transformation related genes

leaf

Related drugs of malignant transformation related genes

Gene: BOP1

Gene summary for BOP1

check button Gene summary.

Gene informationSpeciesHuman
Gene symbol

BOP1

Gene ID

23246

Gene nameBOP1 ribosomal biogenesis factor
Gene AliasBOP1
Cytomap8q24.3
Gene Typeprotein-coding
GO ID

GO:0000027

UniProtAcc

Q14137


Top

Malignant transformation analysis

check button Identification of the aberrant gene expression in precancerous and cancerous lesions by comparing the gene expression of stem-like cells in diseased tissues with normal stem cells
check button Malignant transformation involving gene list.
Entrez IDSymbolReplicatesSpeciesOrganTissueAdj P-valueLog2FCMalignancy
23246BOP1HTA11_1391_2000001011HumanColorectumAD9.37e-083.24e-01-0.059
23246BOP1HTA11_866_3004761011HumanColorectumAD1.62e-052.89e-010.096
23246BOP1HTA11_7696_3000711011HumanColorectumAD2.98e-082.81e-010.0674
23246BOP1HTA11_6818_2000001021HumanColorectumAD1.23e-023.02e-010.0588
23246BOP1HTA11_99999971662_82457HumanColorectumMSS1.64e-378.95e-010.3859
23246BOP1HTA11_99999974143_84620HumanColorectumMSS1.27e-154.71e-010.3005
23246BOP1CRC-3-11773HumanColorectumCRC2.12e-145.85e-010.2564
23246BOP1LZE20THumanEsophagusESCC2.13e-042.29e-010.0662
23246BOP1LZE22THumanEsophagusESCC1.57e-064.58e-010.068
23246BOP1LZE24THumanEsophagusESCC7.15e-215.66e-010.0596
23246BOP1LZE21THumanEsophagusESCC9.05e-054.96e-010.0655
23246BOP1P1T-EHumanEsophagusESCC8.48e-052.99e-010.0875
23246BOP1P2T-EHumanEsophagusESCC3.48e-275.64e-010.1177
23246BOP1P4T-EHumanEsophagusESCC6.35e-235.97e-010.1323
23246BOP1P5T-EHumanEsophagusESCC7.53e-377.40e-010.1327
23246BOP1P8T-EHumanEsophagusESCC7.24e-102.25e-010.0889
23246BOP1P9T-EHumanEsophagusESCC4.34e-246.70e-010.1131
23246BOP1P10T-EHumanEsophagusESCC1.53e-224.07e-010.116
23246BOP1P11T-EHumanEsophagusESCC3.55e-095.06e-010.1426
23246BOP1P12T-EHumanEsophagusESCC1.47e-439.53e-010.1122
Page: 1 2 3 4 5 6 

check button Transcriptomic changes along malignancy continuum.
TissueExpression DynamicsAbbreviation
Colorectum (GSE201348)The image shows the transcriptomic changes along malignancy continuum.log2FC in expression of this searched gene in stem-like cells from each diseased tissue sample relative to stem-like cells in normal samples in each tissue plotted against the malignancy continuum. Samples are colored based on if they are from different disease stage.
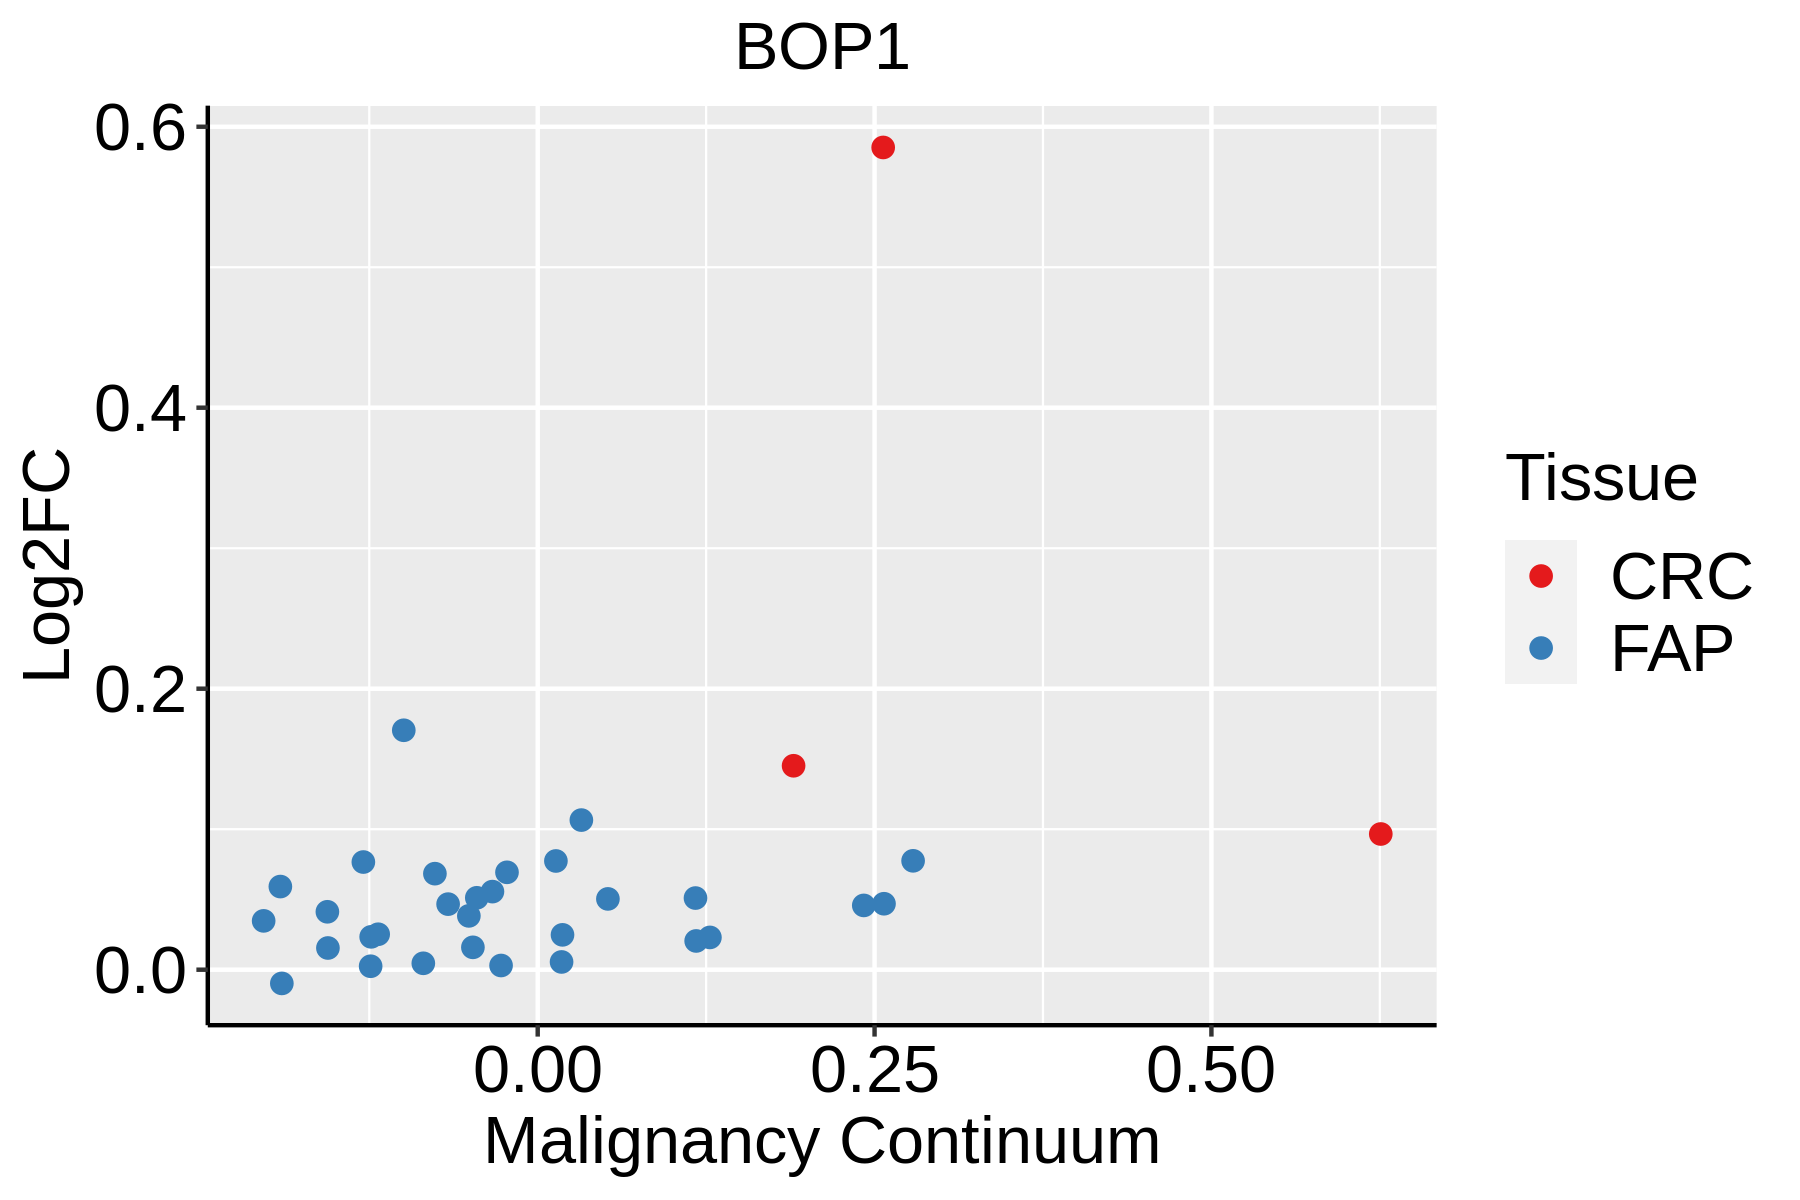
FAP: Familial adenomatous polyposis
CRC: Colorectal cancer
Colorectum (HTA11)The image shows the transcriptomic changes along malignancy continuum.log2FC in expression of this searched gene in stem-like cells from each diseased tissue sample relative to stem-like cells in normal samples in each tissue plotted against the malignancy continuum. Samples are colored based on if they are from different disease stage.AD: Adenomas
SER: Sessile serrated lesions
MSI-H: Microsatellite-high colorectal cancer
MSS: Microsatellite stable colorectal cancer
EsophagusThe image shows the transcriptomic changes along malignancy continuum.log2FC in expression of this searched gene in stem-like cells from each diseased tissue sample relative to stem-like cells in normal samples in each tissue plotted against the malignancy continuum. Samples are colored based on if they are from different disease stage.
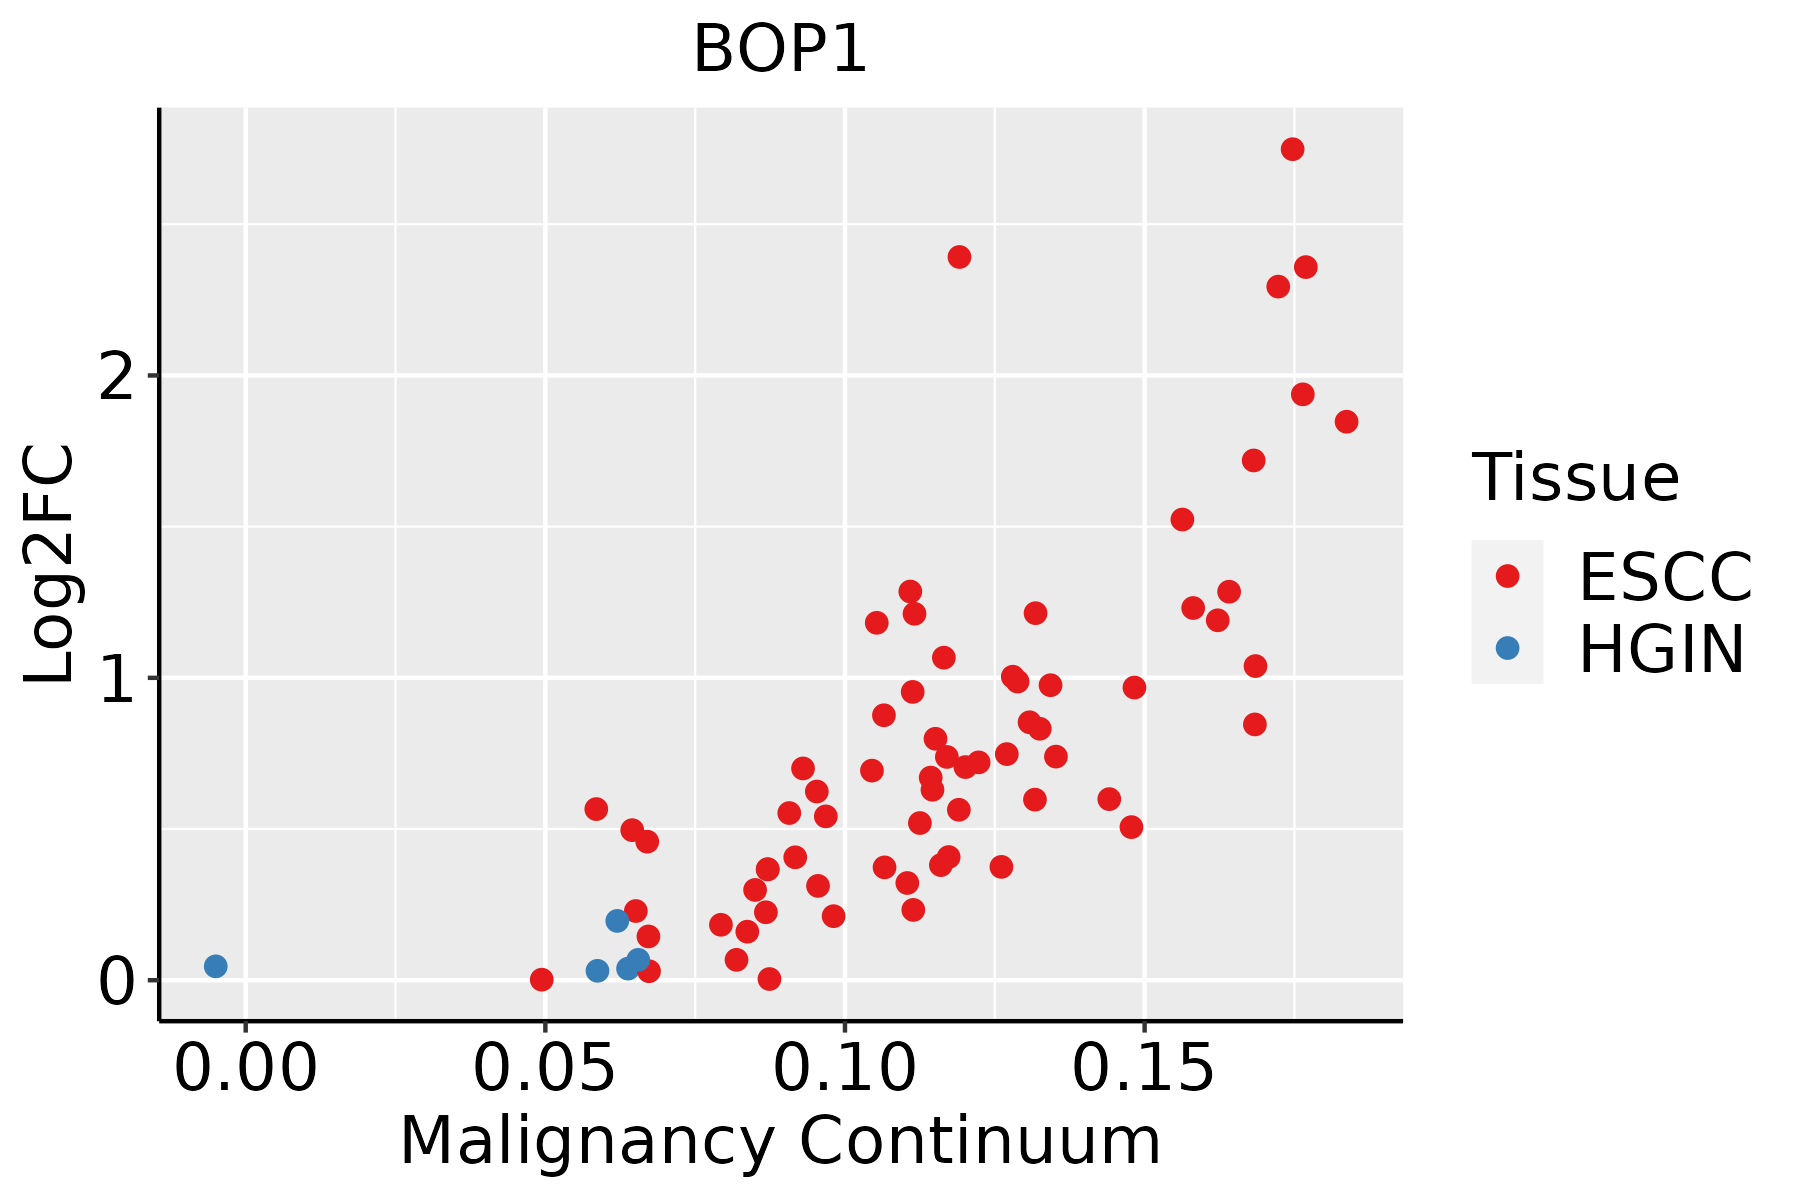
ESCC: Esophageal squamous cell carcinoma
HGIN: High-grade intraepithelial neoplasias
LGIN: Low-grade intraepithelial neoplasias
LiverThe image shows the transcriptomic changes along malignancy continuum.log2FC in expression of this searched gene in stem-like cells from each diseased tissue sample relative to stem-like cells in normal samples in each tissue plotted against the malignancy continuum. Samples are colored based on if they are from different disease stage.
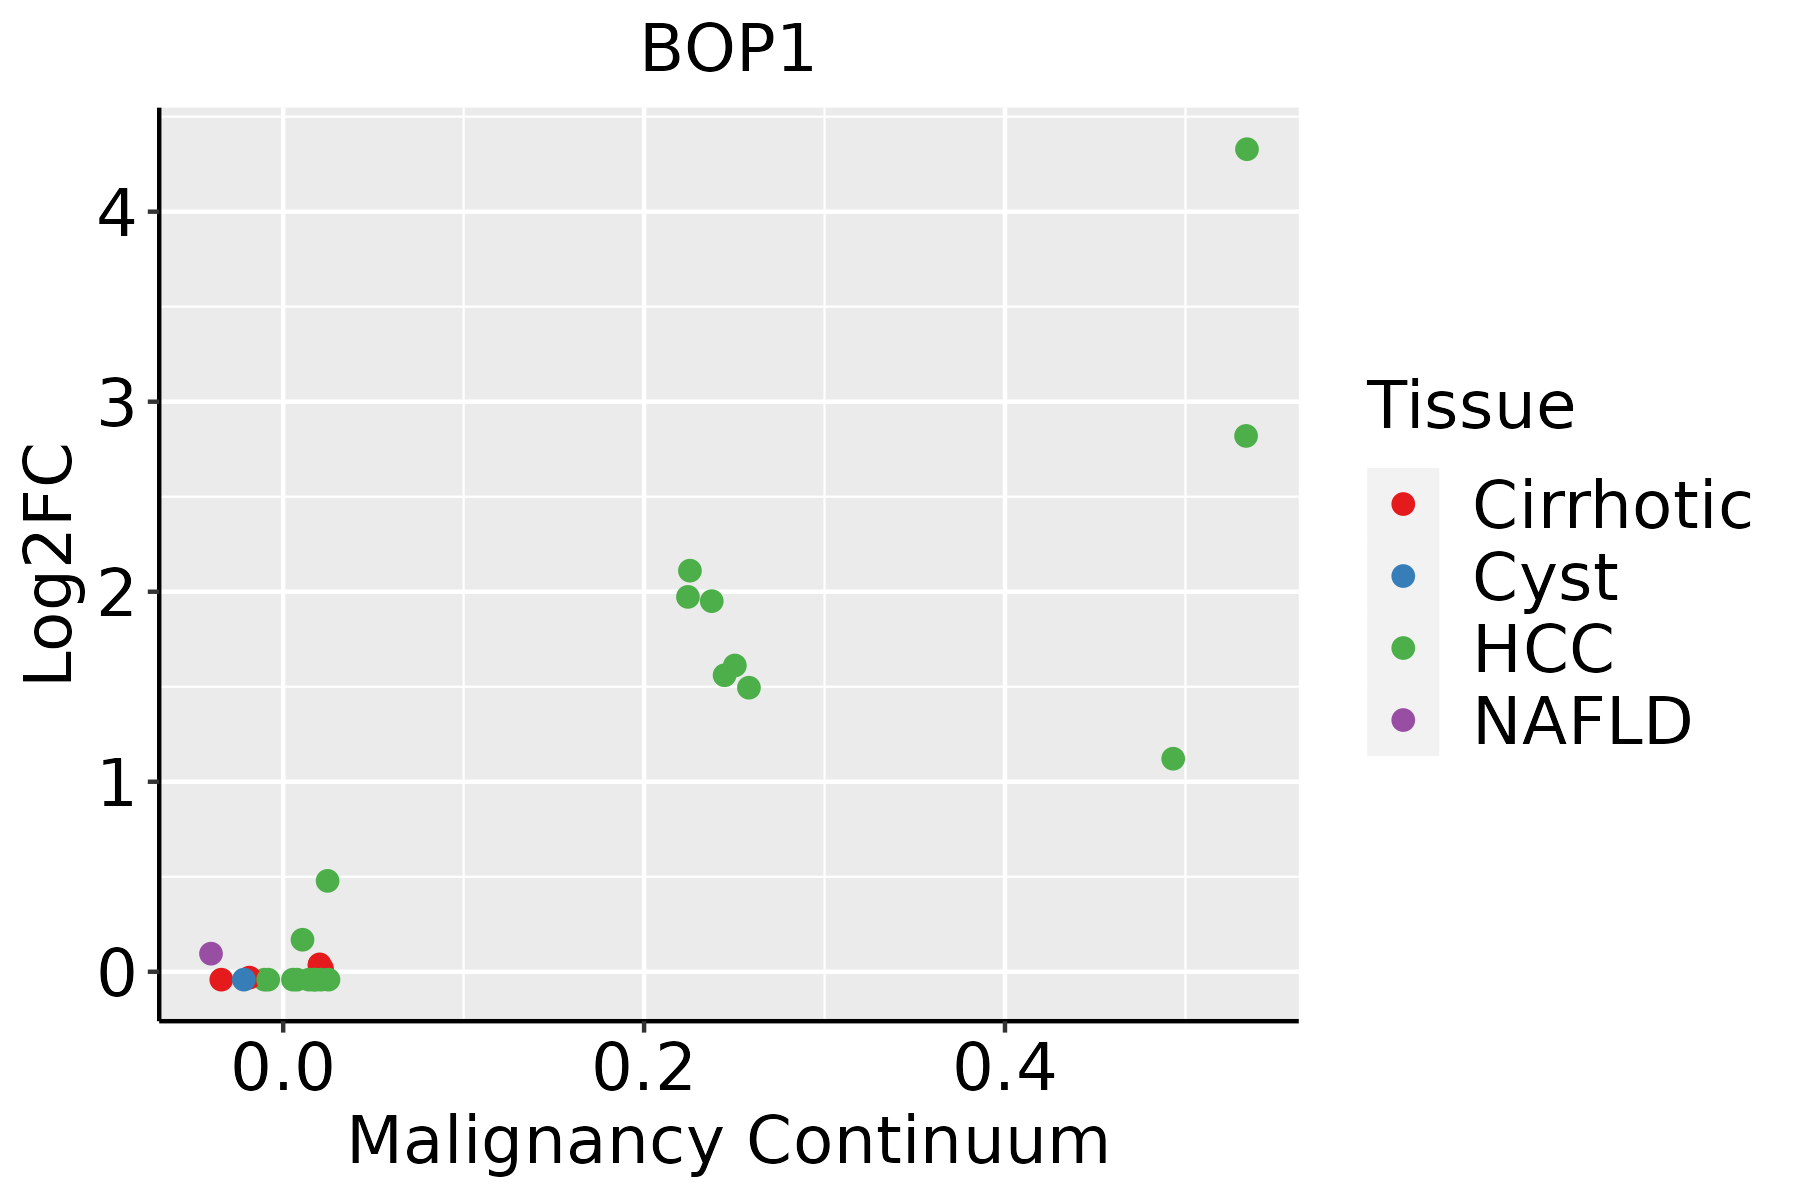
HCC: Hepatocellular carcinoma
NAFLD: Non-alcoholic fatty liver disease
Oral CavityThe image shows the transcriptomic changes along malignancy continuum.log2FC in expression of this searched gene in stem-like cells from each diseased tissue sample relative to stem-like cells in normal samples in each tissue plotted against the malignancy continuum. Samples are colored based on if they are from different disease stage.
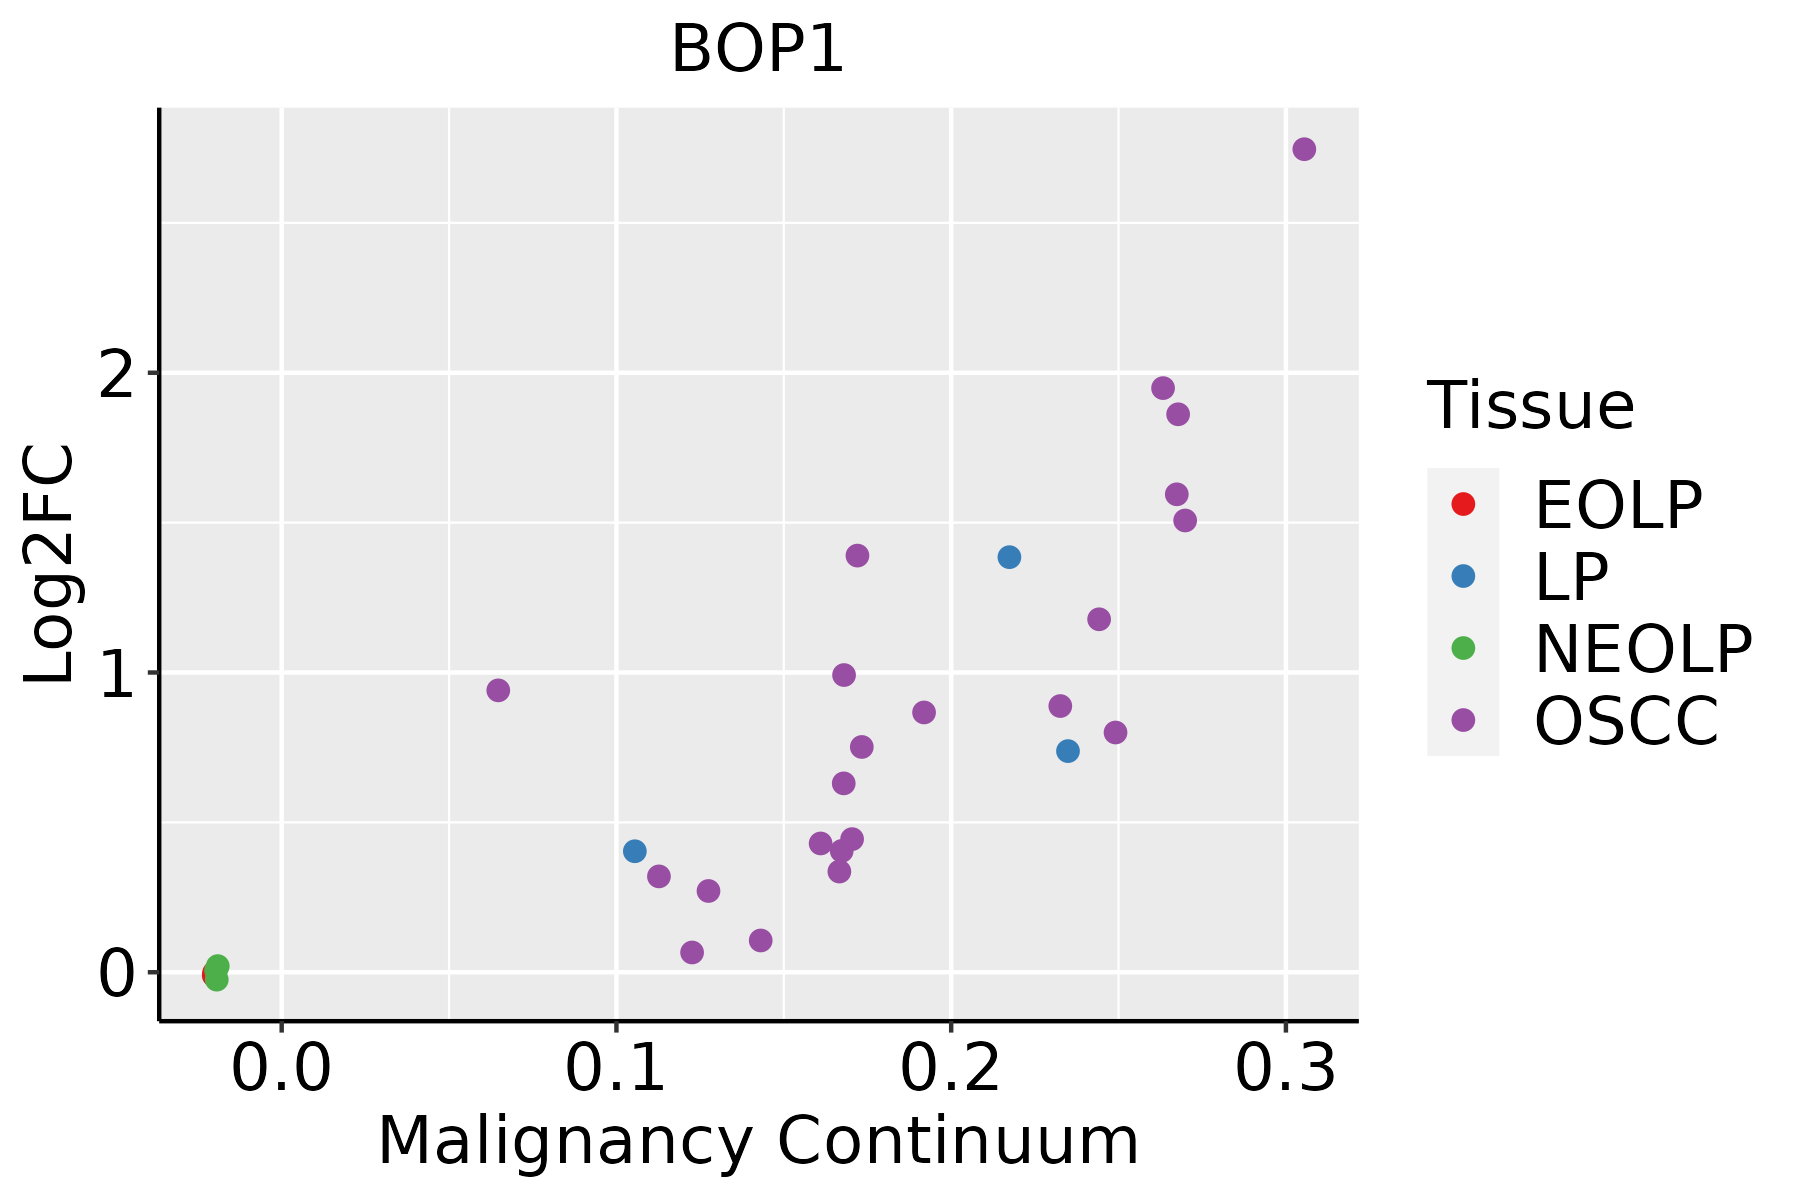
EOLP: Erosive Oral lichen planus
LP: leukoplakia
NEOLP: Non-erosive oral lichen planus
OSCC: Oral squamous cell carcinoma
ThyroidThe image shows the transcriptomic changes along malignancy continuum.log2FC in expression of this searched gene in stem-like cells from each diseased tissue sample relative to stem-like cells in normal samples in each tissue plotted against the malignancy continuum. Samples are colored based on if they are from different disease stage.
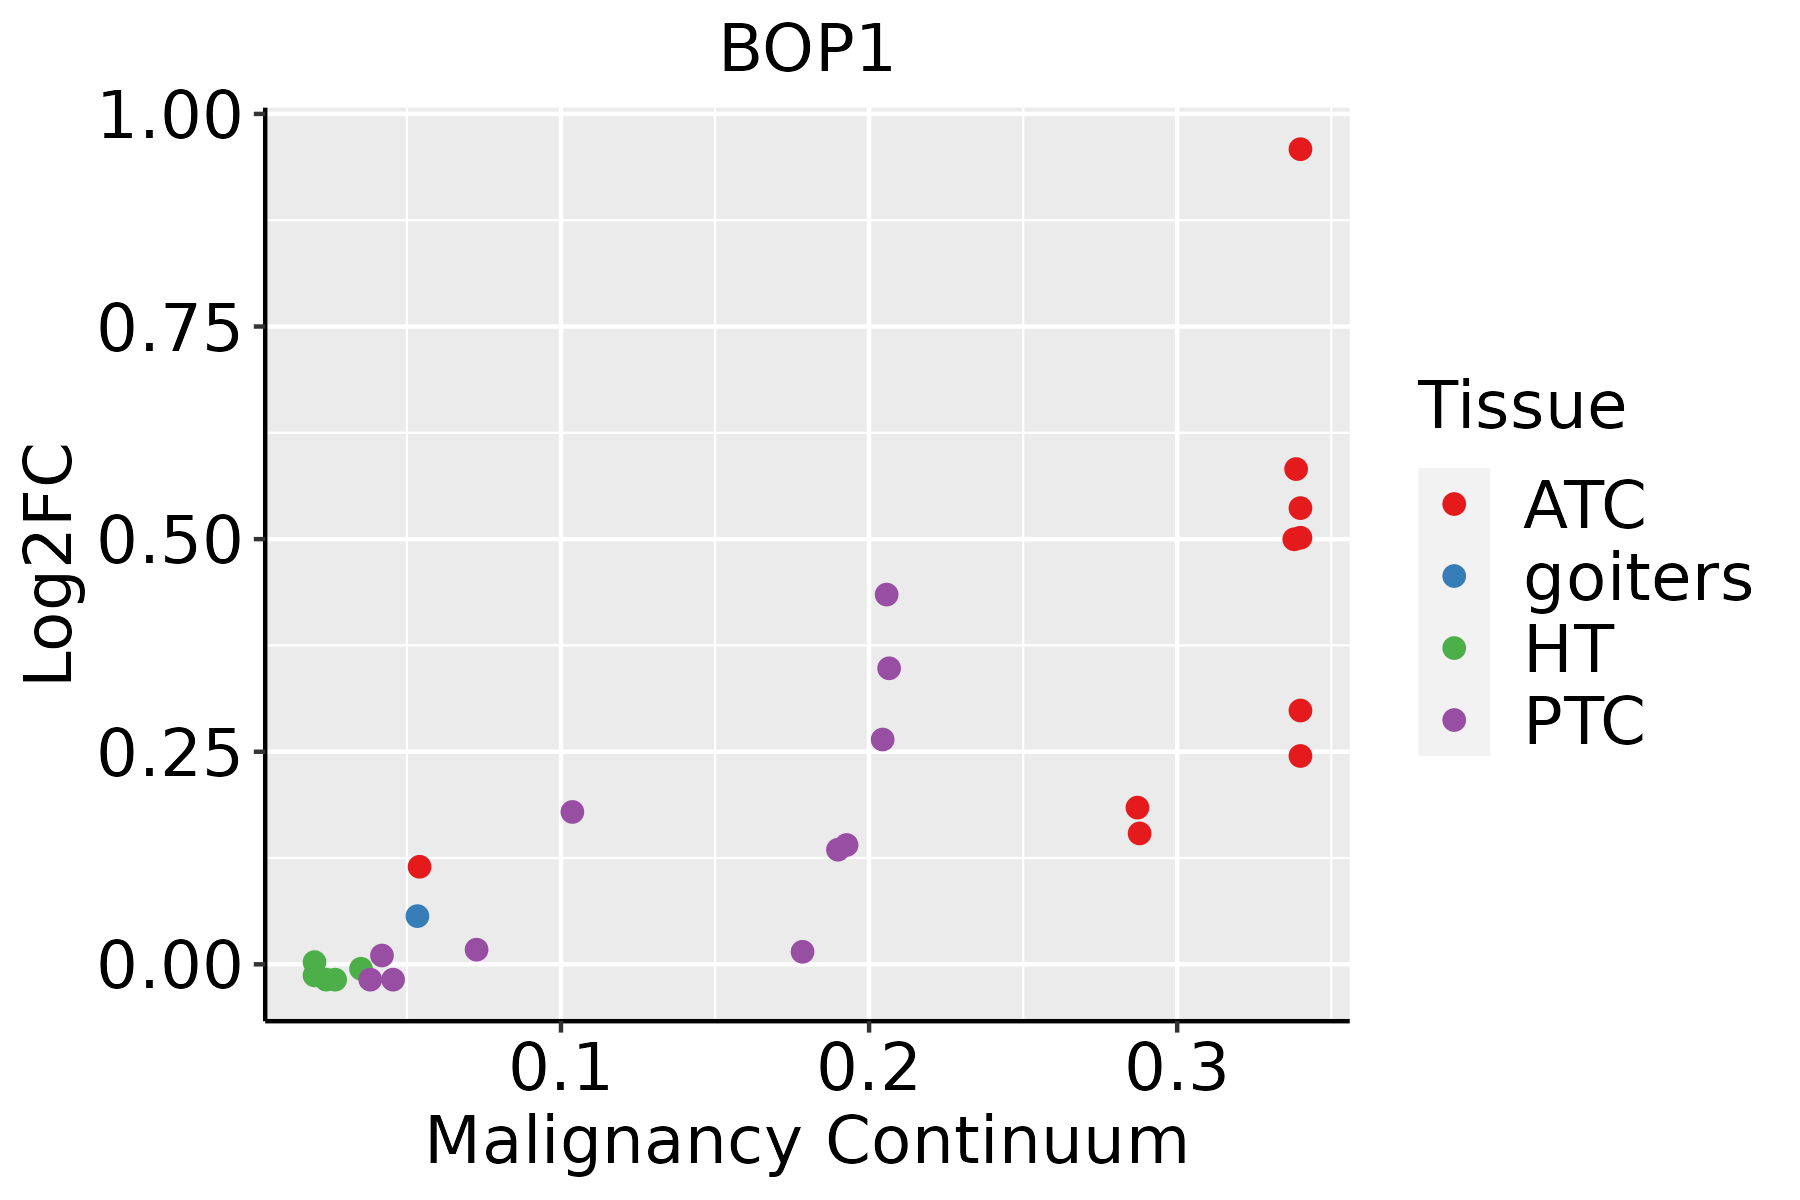
ATC: Anaplastic thyroid cancer
HT: Hashimoto's thyroiditis
PTC: Papillary thyroid cancer
∗log2FC in expression of this searched gene in stem-like cells from each diseased tissue sample relative to stem-like cells in normal samples in each tissue plotted against the malignancy continuum. Samples are colored based on if they are from different disease stage.

Top

Malignant transformation related pathway analysis

check buttonFind out the enriched GO biological processes and KEGG pathways involved in transition from healthy to precancer to cancer
check button Figure of enriched GO biological processes.
TissueDisease StageEnriched GO biological Processes
ColorectumADGO analysis - Figure of enriched GO biological processes: Top 15 enriched GO BP terms are showed in the bar plot of each disease state in each tissue. Each row represents a significant GO biological process which is colored according to the -log10(p.adjust).
ColorectumSERGO analysis - Figure of enriched GO biological processes: Top 15 enriched GO BP terms are showed in the bar plot of each disease state in each tissue. Each row represents a significant GO biological process which is colored according to the -log10(p.adjust).
ColorectumMSSGO analysis - Figure of enriched GO biological processes: Top 15 enriched GO BP terms are showed in the bar plot of each disease state in each tissue. Each row represents a significant GO biological process which is colored according to the -log10(p.adjust).
ColorectumMSI-HGO analysis - Figure of enriched GO biological processes: Top 15 enriched GO BP terms are showed in the bar plot of each disease state in each tissue. Each row represents a significant GO biological process which is colored according to the -log10(p.adjust).
ColorectumFAPGO analysis - Figure of enriched GO biological processes: Top 15 enriched GO BP terms are showed in the bar plot of each disease state in each tissue. Each row represents a significant GO biological process which is colored according to the -log10(p.adjust).
∗Top 15 enriched GO BP terms are showed in the bar plot of each disease state in each tissue. Each row represents a significant GO biological process which is colored according to the -log10(p.adjust).
Page: 1 2 3 4 5 6 7 8 9 

check button Enriched GO biological processes.
GO IDTissueDisease StageDescriptionGene RatioBg Ratiopvaluep.adjustCount
GO:0022618ColorectumADribonucleoprotein complex assembly92/3918220/187231.49e-122.60e-1092
GO:0071826ColorectumADribonucleoprotein complex subunit organization94/3918227/187231.70e-122.87e-1094
GO:0022613ColorectumADribonucleoprotein complex biogenesis151/3918463/187231.96e-091.39e-07151
GO:0072331ColorectumADsignal transduction by p53 class mediator58/3918163/187231.04e-052.40e-0458
GO:0042255ColorectumADribosome assembly28/391861/187231.08e-052.47e-0428
GO:1901796ColorectumADregulation of signal transduction by p53 class mediator36/391893/187236.58e-051.07e-0336
GO:0042273ColorectumADribosomal large subunit biogenesis28/391872/187233.74e-044.31e-0328
GO:0042254ColorectumADribosome biogenesis84/3918299/187231.82e-031.50e-0284
GO:0000027ColorectumADribosomal large subunit assembly12/391827/187235.07e-033.38e-0212
GO:00718262ColorectumMSSribonucleoprotein complex subunit organization90/3467227/187236.88e-141.78e-1190
GO:00226182ColorectumMSSribonucleoprotein complex assembly88/3467220/187237.12e-141.78e-1188
GO:00226132ColorectumMSSribonucleoprotein complex biogenesis144/3467463/187232.76e-113.67e-09144
GO:00422552ColorectumMSSribosome assembly26/346761/187231.15e-052.71e-0426
GO:00422732ColorectumMSSribosomal large subunit biogenesis28/346772/187234.16e-057.83e-0428
GO:00723312ColorectumMSSsignal transduction by p53 class mediator49/3467163/187232.30e-043.19e-0349
GO:00422542ColorectumMSSribosome biogenesis79/3467299/187234.32e-045.23e-0379
GO:19017962ColorectumMSSregulation of signal transduction by p53 class mediator30/346793/187231.03e-031.02e-0230
GO:0000470ColorectumMSSmaturation of LSU-rRNA12/346728/187232.53e-032.02e-0212
GO:0006364ColorectumMSSrRNA processing58/3467225/187234.17e-033.03e-0258
GO:0016072ColorectumMSSrRNA metabolic process60/3467236/187235.01e-033.46e-0260
Page: 1 2 3 4 5 6 7 8 9 

check button Enriched KEGG pathways.
Pathway IDTissueDisease StageDescriptionGene RatioBg Ratiopvaluep.adjustqvalueCount
Page: 1 

Top

Cell-cell communication analysis

check buttonIdentification of potential cell-cell interactions between two cell types and their ligand-receptor pairs for different disease states
LigandReceptorLRpairPathwayTissueDisease Stage
Page: 1 

Top

Single-cell gene regulatory network inference analysis

check buttonFind out the significant the regulons (TFs) and the target genes of each regulon across cell types for different disease states
TFCell TypeTissueDisease StageTarget GeneRSSRegulon Activity
∗The dot plots of a searched regulon are shown for all cell subpopulations in each disease state of each tissue based on the regulon specific score inferred using pySCENIC and by calculating the average expression.
Page: 1 

Top

Somatic mutation of malignant transformation related genes

check buttonAnnotation of somatic variants for genes involved in malignant transformation
Hugo SymbolVariant ClassVariant ClassificationdbSNP RSHGVScHGVSpHGVSp ShortSWISSPROTBIOTYPESIFTPolyPhenTumor Sample BarcodeTissueHistologySexAgeStageTherapy TypesDrugsOutcome
BOP1SNVMissense_Mutationnovelc.2015N>Cp.His672Prop.H672PQ14137protein_codingdeleterious(0)probably_damaging(0.999)TCGA-A2-A1FW-01Breastbreast invasive carcinomaFemale<65III/IVChemotherapycytoxanSD
BOP1SNVMissense_Mutationrs782512248c.226N>Ap.Glu76Lysp.E76KQ14137protein_codingtolerated(0.33)benign(0.019)TCGA-AR-A0TZ-01Breastbreast invasive carcinomaFemale<65III/IVUnspecificDoxorubicinPD
BOP1SNVMissense_Mutationnovelc.2015N>Cp.His672Prop.H672PQ14137protein_codingdeleterious(0)probably_damaging(0.999)TCGA-AR-A1AT-01Breastbreast invasive carcinomaFemale<65I/IIHormone TherapyanastrozoleSD
BOP1SNVMissense_Mutationnovelc.760N>Ap.Glu254Lysp.E254KQ14137protein_codingtolerated(0.75)benign(0.012)TCGA-D8-A73U-01Breastbreast invasive carcinomaFemale>=65I/IIHormone TherapytamoxiphenSD
BOP1insertionFrame_Shift_Insnovelc.445_446insCp.His149ProfsTer20p.H149Pfs*20Q14137protein_codingTCGA-BH-A0HA-01Breastbreast invasive carcinomaFemale<65I/IIUnknownUnknownSD
BOP1insertionIn_Frame_Insnovelc.146_147insAGATTATGGACAACTACGTTACCCCTTCTTGAGTTTp.Asp49delinsGluAspTyrGlyGlnLeuArgTyrProPheLeuSerPhep.D49delinsEDYGQLRYPFLSFQ14137protein_codingTCGA-BH-A0HB-01Breastbreast invasive carcinomaFemale<65I/IIChemotherapydocetaxelSD
BOP1SNVMissense_Mutationnovelc.473N>Ap.Arg158Hisp.R158HQ14137protein_codingdeleterious(0)probably_damaging(0.939)TCGA-2W-A8YY-01Cervixcervical & endocervical cancerFemale<65I/IIChemotherapycisplatinCR
BOP1SNVMissense_Mutationnovelc.811N>Tp.Arg271Cysp.R271CQ14137protein_codingdeleterious(0)probably_damaging(0.971)TCGA-C5-A1BJ-01Cervixcervical & endocervical cancerFemale<65I/IIUnknownUnknownSD
BOP1SNVMissense_Mutationnovelc.1733G>Tp.Ser578Ilep.S578IQ14137protein_codingdeleterious(0.03)benign(0.325)TCGA-MA-AA42-01Cervixcervical & endocervical cancerFemale>=65I/IIUnknownUnknownSD
BOP1SNVMissense_Mutationnovelc.1399G>Ap.Ala467Thrp.A467TQ14137protein_codingtolerated(0.51)benign(0.003)TCGA-MA-AA42-01Cervixcervical & endocervical cancerFemale>=65I/IIUnknownUnknownSD
Page: 1 2 3 4 5 6 7 8 

Top

Related drugs of malignant transformation related genes

check buttonIdentification of chemicals and drugs interact with genes involved in malignant transfromation
(DGIdb 4.0)
Entrez IDSymbolCategoryInteraction TypesDrug Claim NameDrug NamePMIDs
Page: 1