
|
|||||
|
 | |
| |
| |
| |
| |
| |
|
Gene: BOK |
Gene summary for BOK |
| Gene information | Species | Human | Gene symbol | BOK | Gene ID | 666 |
| Gene name | BCL2 family apoptosis regulator BOK | |
| Gene Alias | BCL2L9 | |
| Cytomap | 2q37.3 | |
| Gene Type | protein-coding | GO ID | GO:0000003 | UniProtAcc | A0A024R4A8 |
Top |
Malignant transformation analysis |
| Identification of the aberrant gene expression in precancerous and cancerous lesions by comparing the gene expression of stem-like cells in diseased tissues with normal stem cells |
| Entrez ID | Symbol | Replicates | Species | Organ | Tissue | Adj P-value | Log2FC | Malignancy |
| 666 | BOK | P2T-E | Human | Esophagus | ESCC | 1.17e-07 | 3.14e-02 | 0.1177 |
| 666 | BOK | P4T-E | Human | Esophagus | ESCC | 2.64e-06 | 7.05e-02 | 0.1323 |
| 666 | BOK | P5T-E | Human | Esophagus | ESCC | 8.21e-06 | 1.78e-02 | 0.1327 |
| 666 | BOK | P8T-E | Human | Esophagus | ESCC | 2.24e-06 | 1.52e-02 | 0.0889 |
| 666 | BOK | P9T-E | Human | Esophagus | ESCC | 2.31e-03 | 2.12e-01 | 0.1131 |
| 666 | BOK | P10T-E | Human | Esophagus | ESCC | 3.25e-55 | 9.30e-01 | 0.116 |
| 666 | BOK | P11T-E | Human | Esophagus | ESCC | 6.77e-05 | 2.29e-01 | 0.1426 |
| 666 | BOK | P12T-E | Human | Esophagus | ESCC | 1.32e-09 | 1.51e-01 | 0.1122 |
| 666 | BOK | P15T-E | Human | Esophagus | ESCC | 4.70e-15 | 2.29e-01 | 0.1149 |
| 666 | BOK | P16T-E | Human | Esophagus | ESCC | 7.54e-12 | 1.61e-01 | 0.1153 |
| 666 | BOK | P21T-E | Human | Esophagus | ESCC | 3.25e-16 | 3.16e-01 | 0.1617 |
| 666 | BOK | P22T-E | Human | Esophagus | ESCC | 1.29e-11 | 1.04e-01 | 0.1236 |
| 666 | BOK | P23T-E | Human | Esophagus | ESCC | 2.77e-05 | 6.81e-02 | 0.108 |
| 666 | BOK | P24T-E | Human | Esophagus | ESCC | 7.48e-11 | 1.52e-01 | 0.1287 |
| 666 | BOK | P26T-E | Human | Esophagus | ESCC | 5.61e-13 | 8.97e-02 | 0.1276 |
| 666 | BOK | P27T-E | Human | Esophagus | ESCC | 8.44e-11 | 5.07e-02 | 0.1055 |
| 666 | BOK | P28T-E | Human | Esophagus | ESCC | 4.42e-15 | 1.09e-01 | 0.1149 |
| 666 | BOK | P30T-E | Human | Esophagus | ESCC | 3.09e-09 | 2.28e-01 | 0.137 |
| 666 | BOK | P31T-E | Human | Esophagus | ESCC | 1.91e-25 | 5.78e-01 | 0.1251 |
| 666 | BOK | P32T-E | Human | Esophagus | ESCC | 3.09e-02 | 1.76e-02 | 0.1666 |
| Page: 1 2 3 4 |
| Tissue | Expression Dynamics | Abbreviation |
| Esophagus |  | ESCC: Esophageal squamous cell carcinoma |
| HGIN: High-grade intraepithelial neoplasias | ||
| LGIN: Low-grade intraepithelial neoplasias | ||
| Liver |  | HCC: Hepatocellular carcinoma |
| NAFLD: Non-alcoholic fatty liver disease | ||
| Oral Cavity | 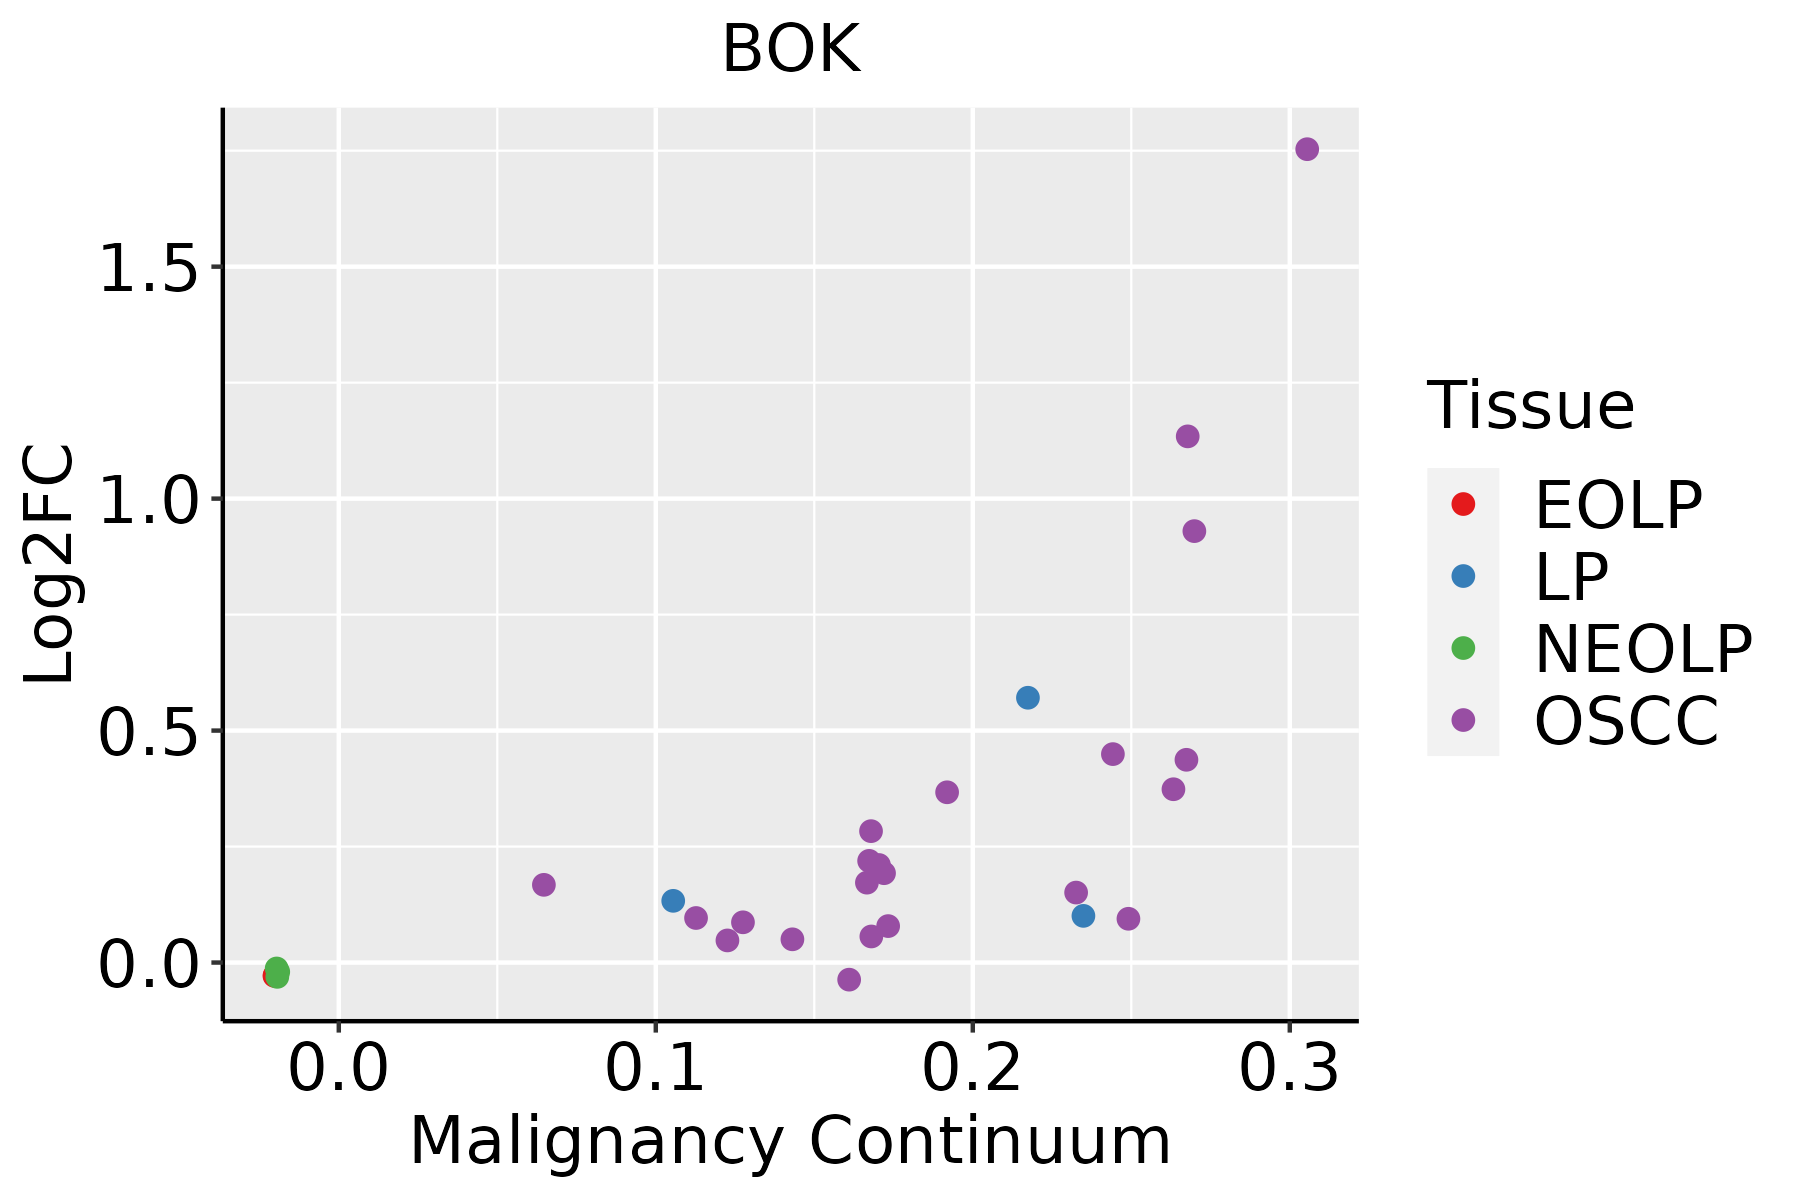 | EOLP: Erosive Oral lichen planus |
| LP: leukoplakia | ||
| NEOLP: Non-erosive oral lichen planus | ||
| OSCC: Oral squamous cell carcinoma | ||
| Skin |  | AK: Actinic keratosis |
| cSCC: Cutaneous squamous cell carcinoma | ||
| SCCIS:squamous cell carcinoma in situ |
| ∗log2FC in expression of this searched gene in stem-like cells from each diseased tissue sample relative to stem-like cells in normal samples in each tissue plotted against the malignancy continuum. Samples are colored based on if they are from different disease stage. |
Top |
Malignant transformation related pathway analysis |
| Find out the enriched GO biological processes and KEGG pathways involved in transition from healthy to precancer to cancer |
| Tissue | Disease Stage | Enriched GO biological Processes |
| Colorectum | AD |  |
| Colorectum | SER |  |
| Colorectum | MSS |  |
| Colorectum | MSI-H |  |
| Colorectum | FAP |  |
| ∗Top 15 enriched GO BP terms are showed in the bar plot of each disease state in each tissue. Each row represents a significant GO biological process which is colored according to the -log10(p.adjust). |
| Page: 1 2 3 4 5 6 7 8 9 |
| GO ID | Tissue | Disease Stage | Description | Gene Ratio | Bg Ratio | pvalue | p.adjust | Count |
| GO:0097193111 | Esophagus | ESCC | intrinsic apoptotic signaling pathway | 222/8552 | 288/18723 | 5.87e-28 | 2.02e-25 | 222 |
| GO:2001233111 | Esophagus | ESCC | regulation of apoptotic signaling pathway | 256/8552 | 356/18723 | 4.11e-24 | 1.04e-21 | 256 |
| GO:0022411111 | Esophagus | ESCC | cellular component disassembly | 305/8552 | 443/18723 | 1.94e-23 | 4.57e-21 | 305 |
| GO:0034976111 | Esophagus | ESCC | response to endoplasmic reticulum stress | 192/8552 | 256/18723 | 7.15e-22 | 1.30e-19 | 192 |
| GO:0045862111 | Esophagus | ESCC | positive regulation of proteolysis | 256/8552 | 372/18723 | 7.88e-20 | 9.43e-18 | 256 |
| GO:0006839110 | Esophagus | ESCC | mitochondrial transport | 187/8552 | 254/18723 | 8.35e-20 | 9.81e-18 | 187 |
| GO:001050617 | Esophagus | ESCC | regulation of autophagy | 220/8552 | 317/18723 | 6.72e-18 | 6.36e-16 | 220 |
| GO:0035966111 | Esophagus | ESCC | response to topologically incorrect protein | 125/8552 | 159/18723 | 1.44e-17 | 1.27e-15 | 125 |
| GO:2001242111 | Esophagus | ESCC | regulation of intrinsic apoptotic signaling pathway | 128/8552 | 164/18723 | 1.75e-17 | 1.50e-15 | 128 |
| GO:0097191111 | Esophagus | ESCC | extrinsic apoptotic signaling pathway | 159/8552 | 219/18723 | 4.12e-16 | 2.94e-14 | 159 |
| GO:2001234111 | Esophagus | ESCC | negative regulation of apoptotic signaling pathway | 161/8552 | 224/18723 | 1.24e-15 | 8.09e-14 | 161 |
| GO:0006986111 | Esophagus | ESCC | response to unfolded protein | 107/8552 | 137/18723 | 7.01e-15 | 3.87e-13 | 107 |
| GO:000700619 | Esophagus | ESCC | mitochondrial membrane organization | 93/8552 | 116/18723 | 2.16e-14 | 1.11e-12 | 93 |
| GO:0072331111 | Esophagus | ESCC | signal transduction by p53 class mediator | 121/8552 | 163/18723 | 9.61e-14 | 4.69e-12 | 121 |
| GO:0035967111 | Esophagus | ESCC | cellular response to topologically incorrect protein | 90/8552 | 116/18723 | 1.94e-12 | 8.11e-11 | 90 |
| GO:0010821110 | Esophagus | ESCC | regulation of mitochondrion organization | 107/8552 | 144/18723 | 2.31e-12 | 9.41e-11 | 107 |
| GO:0008630110 | Esophagus | ESCC | intrinsic apoptotic signaling pathway in response to DNA damage | 78/8552 | 99/18723 | 1.43e-11 | 5.08e-10 | 78 |
| GO:0008637110 | Esophagus | ESCC | apoptotic mitochondrial changes | 83/8552 | 107/18723 | 1.43e-11 | 5.08e-10 | 83 |
| GO:2000116111 | Esophagus | ESCC | regulation of cysteine-type endopeptidase activity | 158/8552 | 235/18723 | 1.67e-11 | 5.90e-10 | 158 |
| GO:0043281111 | Esophagus | ESCC | regulation of cysteine-type endopeptidase activity involved in apoptotic process | 143/8552 | 209/18723 | 2.12e-11 | 7.31e-10 | 143 |
| Page: 1 2 3 4 5 6 7 8 9 10 11 12 13 14 15 16 17 18 19 20 21 |
| Pathway ID | Tissue | Disease Stage | Description | Gene Ratio | Bg Ratio | pvalue | p.adjust | qvalue | Count |
| hsa04215 | Oral cavity | OSCC | Apoptosis - multiple species | 25/3704 | 32/8465 | 7.74e-05 | 2.88e-04 | 1.47e-04 | 25 |
| hsa042151 | Oral cavity | OSCC | Apoptosis - multiple species | 25/3704 | 32/8465 | 7.74e-05 | 2.88e-04 | 1.47e-04 | 25 |
| hsa042152 | Oral cavity | LP | Apoptosis - multiple species | 16/2418 | 32/8465 | 8.31e-03 | 3.08e-02 | 1.98e-02 | 16 |
| hsa042153 | Oral cavity | LP | Apoptosis - multiple species | 16/2418 | 32/8465 | 8.31e-03 | 3.08e-02 | 1.98e-02 | 16 |
| Page: 1 |
Top |
Cell-cell communication analysis |
| Identification of potential cell-cell interactions between two cell types and their ligand-receptor pairs for different disease states |
| Ligand | Receptor | LRpair | Pathway | Tissue | Disease Stage |
| Page: 1 |
Top |
Single-cell gene regulatory network inference analysis |
| Find out the significant the regulons (TFs) and the target genes of each regulon across cell types for different disease states |
| TF | Cell Type | Tissue | Disease Stage | Target Gene | RSS | Regulon Activity |
| ∗The dot plots of a searched regulon are shown for all cell subpopulations in each disease state of each tissue based on the regulon specific score inferred using pySCENIC and by calculating the average expression. |
| Page: 1 |
Top |
Somatic mutation of malignant transformation related genes |
| Annotation of somatic variants for genes involved in malignant transformation |
| Hugo Symbol | Variant Class | Variant Classification | dbSNP RS | HGVSc | HGVSp | HGVSp Short | SWISSPROT | BIOTYPE | SIFT | PolyPhen | Tumor Sample Barcode | Tissue | Histology | Sex | Age | Stage | Therapy Types | Drugs | Outcome |
| BOK | SNV | Missense_Mutation | rs776017344 | c.572T>G | p.Val191Gly | p.V191G | Q9UMX3 | protein_coding | deleterious(0.04) | benign(0.196) | TCGA-EW-A1J2-01 | Breast | breast invasive carcinoma | Female | <65 | I/II | Chemotherapy | taxotere | SD |
| BOK | SNV | Missense_Mutation | novel | c.539N>A | p.Ser180Asn | p.S180N | Q9UMX3 | protein_coding | tolerated(0.7) | benign(0) | TCGA-A6-2672-01 | Colorectum | colon adenocarcinoma | Female | >=65 | III/IV | Unknown | Unknown | SD |
| BOK | SNV | Missense_Mutation | rs200898291 | c.310G>A | p.Asp104Asn | p.D104N | Q9UMX3 | protein_coding | tolerated(0.1) | probably_damaging(0.999) | TCGA-AA-A00N-01 | Colorectum | colon adenocarcinoma | Male | >=65 | I/II | Unknown | Unknown | PD |
| BOK | SNV | Missense_Mutation | rs750227285 | c.314C>T | p.Ala105Val | p.A105V | Q9UMX3 | protein_coding | tolerated(0.18) | probably_damaging(0.999) | TCGA-AD-6895-01 | Colorectum | colon adenocarcinoma | Male | >=65 | III/IV | Unknown | Unknown | SD |
| BOK | SNV | Missense_Mutation | rs374419286 | c.383C>T | p.Ala128Val | p.A128V | Q9UMX3 | protein_coding | deleterious(0) | possibly_damaging(0.508) | TCGA-A5-A1OF-01 | Endometrium | uterine corpus endometrioid carcinoma | Female | <65 | I/II | Unknown | Unknown | SD |
| BOK | SNV | Missense_Mutation | c.468N>A | p.Phe156Leu | p.F156L | Q9UMX3 | protein_coding | tolerated(0.06) | probably_damaging(0.996) | TCGA-B5-A0JY-01 | Endometrium | uterine corpus endometrioid carcinoma | Female | <65 | III/IV | Chemotherapy | doxorubicin | SD | |
| BOK | SNV | Missense_Mutation | c.256C>A | p.Arg86Ser | p.R86S | Q9UMX3 | protein_coding | tolerated(0.14) | probably_damaging(0.954) | TCGA-B5-A11G-01 | Endometrium | uterine corpus endometrioid carcinoma | Female | >=65 | I/II | Unknown | Unknown | SD | |
| BOK | SNV | Missense_Mutation | rs759186943 | c.356N>T | p.Thr119Met | p.T119M | Q9UMX3 | protein_coding | deleterious(0) | probably_damaging(0.95) | TCGA-DF-A2KZ-01 | Endometrium | uterine corpus endometrioid carcinoma | Female | >=65 | I/II | Unknown | Unknown | SD |
| BOK | insertion | Frame_Shift_Ins | novel | c.358_359insG | p.Lys122GlnfsTer52 | p.K122Qfs*52 | Q9UMX3 | protein_coding | TCGA-B5-A0K9-01 | Endometrium | uterine corpus endometrioid carcinoma | Female | >=65 | I/II | Unknown | Unknown | SD | ||
| BOK | SNV | Missense_Mutation | novel | c.560N>T | p.Ser187Phe | p.S187F | Q9UMX3 | protein_coding | tolerated(0.11) | possibly_damaging(0.459) | TCGA-P3-A5Q5-01 | Oral cavity | head & neck squamous cell carcinoma | Male | <65 | I/II | Unknown | Unknown | SD |
| Page: 1 2 |
Top |
Related drugs of malignant transformation related genes |
| Identification of chemicals and drugs interact with genes involved in malignant transfromation |
| (DGIdb 4.0) |
| Entrez ID | Symbol | Category | Interaction Types | Drug Claim Name | Drug Name | PMIDs |
| Page: 1 |

Copyright 2023-Present -The University of Texas Health Science Center at Houston |