Schematic overview of the cellular and molecular mechanisms involved in the cancer progression, including the proposed cellular and molecular mechanisms in cancer cells trajectory. AT1: alveolar type 1 cells; AT2: alveolar type 2 cells; AAH: atypical adenomatous hyperplasia; AIS: adenocarcinoma in situ; MIA: minimally invasive adenocarcinoma; IA: invasive adenocarcinoma; EMT: epithelial-mesenchymal transition

Home

Download

Statistics

Help

Contact

Center for Computational Systems Medicine
leaf

Gene summary

leaf

Malignant transformation analysis

leaf

Malignant transformation related pathway analysis

leaf

Cell-cell communication analysis

leaf

Single-cell gene regulatory network inference analysis

leaf

Somatic mutation of malignant transformation related genes

leaf

Related drugs of malignant transformation related genes

Gene: BOD1L1

Gene summary for BOD1L1

check button Gene summary.

Gene informationSpeciesHuman
Gene symbol

BOD1L1

Gene ID

259282

Gene namebiorientation of chromosomes in cell division 1 like 1
Gene AliasBOD1L
Cytomap4p15.33
Gene Typeprotein-coding
GO ID

GO:0006139

UniProtAcc

Q8NFC6


Top

Malignant transformation analysis

check button Identification of the aberrant gene expression in precancerous and cancerous lesions by comparing the gene expression of stem-like cells in diseased tissues with normal stem cells
check button Malignant transformation involving gene list.
Entrez IDSymbolReplicatesSpeciesOrganTissueAdj P-valueLog2FCMalignancy
259282BOD1L1HTA11_3410_2000001011HumanColorectumAD2.09e-02-3.03e-010.0155
259282BOD1L1HTA11_696_2000001011HumanColorectumAD9.81e-03-2.35e-01-0.1464
259282BOD1L1HTA11_99999974143_84620HumanColorectumMSS3.75e-04-3.07e-010.3005
259282BOD1L1A015-C-203HumanColorectumFAP1.53e-182.53e-01-0.1294
259282BOD1L1A015-C-204HumanColorectumFAP2.87e-041.97e-01-0.0228
259282BOD1L1A014-C-040HumanColorectumFAP4.17e-022.77e-01-0.1184
259282BOD1L1A002-C-201HumanColorectumFAP1.70e-066.80e-020.0324
259282BOD1L1A001-C-119HumanColorectumFAP1.19e-156.40e-01-0.1557
259282BOD1L1A001-C-108HumanColorectumFAP2.83e-154.94e-01-0.0272
259282BOD1L1A002-C-205HumanColorectumFAP1.41e-183.02e-01-0.1236
259282BOD1L1A001-C-104HumanColorectumFAP2.61e-074.38e-010.0184
259282BOD1L1A015-C-005HumanColorectumFAP7.96e-043.65e-01-0.0336
259282BOD1L1A015-C-006HumanColorectumFAP6.03e-184.44e-01-0.0994
259282BOD1L1A015-C-106HumanColorectumFAP3.89e-073.48e-01-0.0511
259282BOD1L1A002-C-114HumanColorectumFAP6.91e-152.52e-01-0.1561
259282BOD1L1A015-C-104HumanColorectumFAP4.34e-304.77e-01-0.1899
259282BOD1L1A001-C-014HumanColorectumFAP1.54e-062.16e-010.0135
259282BOD1L1A002-C-016HumanColorectumFAP1.93e-121.51e-010.0521
259282BOD1L1A015-C-002HumanColorectumFAP6.28e-071.95e-01-0.0763
259282BOD1L1A001-C-007HumanColorectumCRC7.06e-055.68e-010.1899
Page: 1 2 3 4 5 6 7 8 9 

check button Transcriptomic changes along malignancy continuum.
TissueExpression DynamicsAbbreviation
Colorectum (GSE201348)The image shows the transcriptomic changes along malignancy continuum.log2FC in expression of this searched gene in stem-like cells from each diseased tissue sample relative to stem-like cells in normal samples in each tissue plotted against the malignancy continuum. Samples are colored based on if they are from different disease stage.FAP: Familial adenomatous polyposis
CRC: Colorectal cancer
Colorectum (HTA11)The image shows the transcriptomic changes along malignancy continuum.log2FC in expression of this searched gene in stem-like cells from each diseased tissue sample relative to stem-like cells in normal samples in each tissue plotted against the malignancy continuum. Samples are colored based on if they are from different disease stage.AD: Adenomas
SER: Sessile serrated lesions
MSI-H: Microsatellite-high colorectal cancer
MSS: Microsatellite stable colorectal cancer
EsophagusThe image shows the transcriptomic changes along malignancy continuum.log2FC in expression of this searched gene in stem-like cells from each diseased tissue sample relative to stem-like cells in normal samples in each tissue plotted against the malignancy continuum. Samples are colored based on if they are from different disease stage.
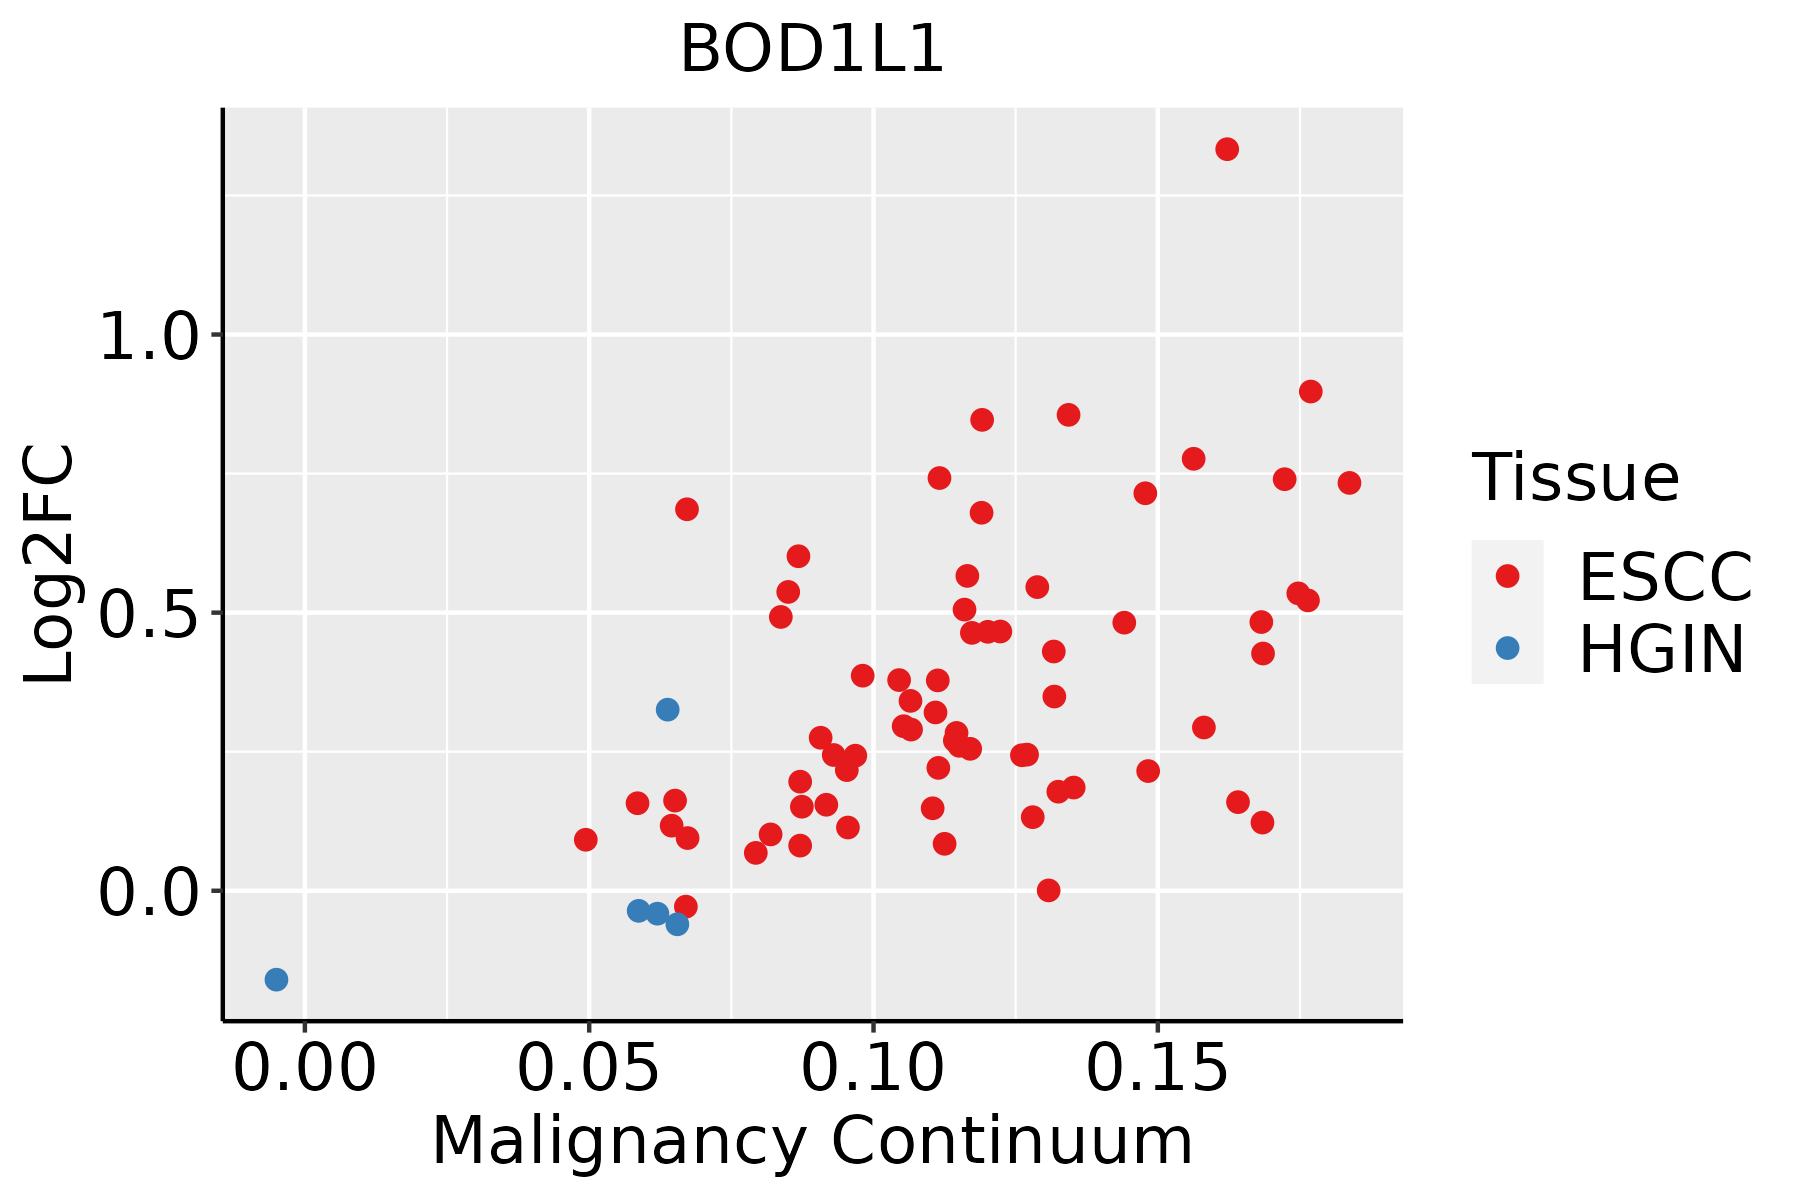
ESCC: Esophageal squamous cell carcinoma
HGIN: High-grade intraepithelial neoplasias
LGIN: Low-grade intraepithelial neoplasias
LiverThe image shows the transcriptomic changes along malignancy continuum.log2FC in expression of this searched gene in stem-like cells from each diseased tissue sample relative to stem-like cells in normal samples in each tissue plotted against the malignancy continuum. Samples are colored based on if they are from different disease stage.
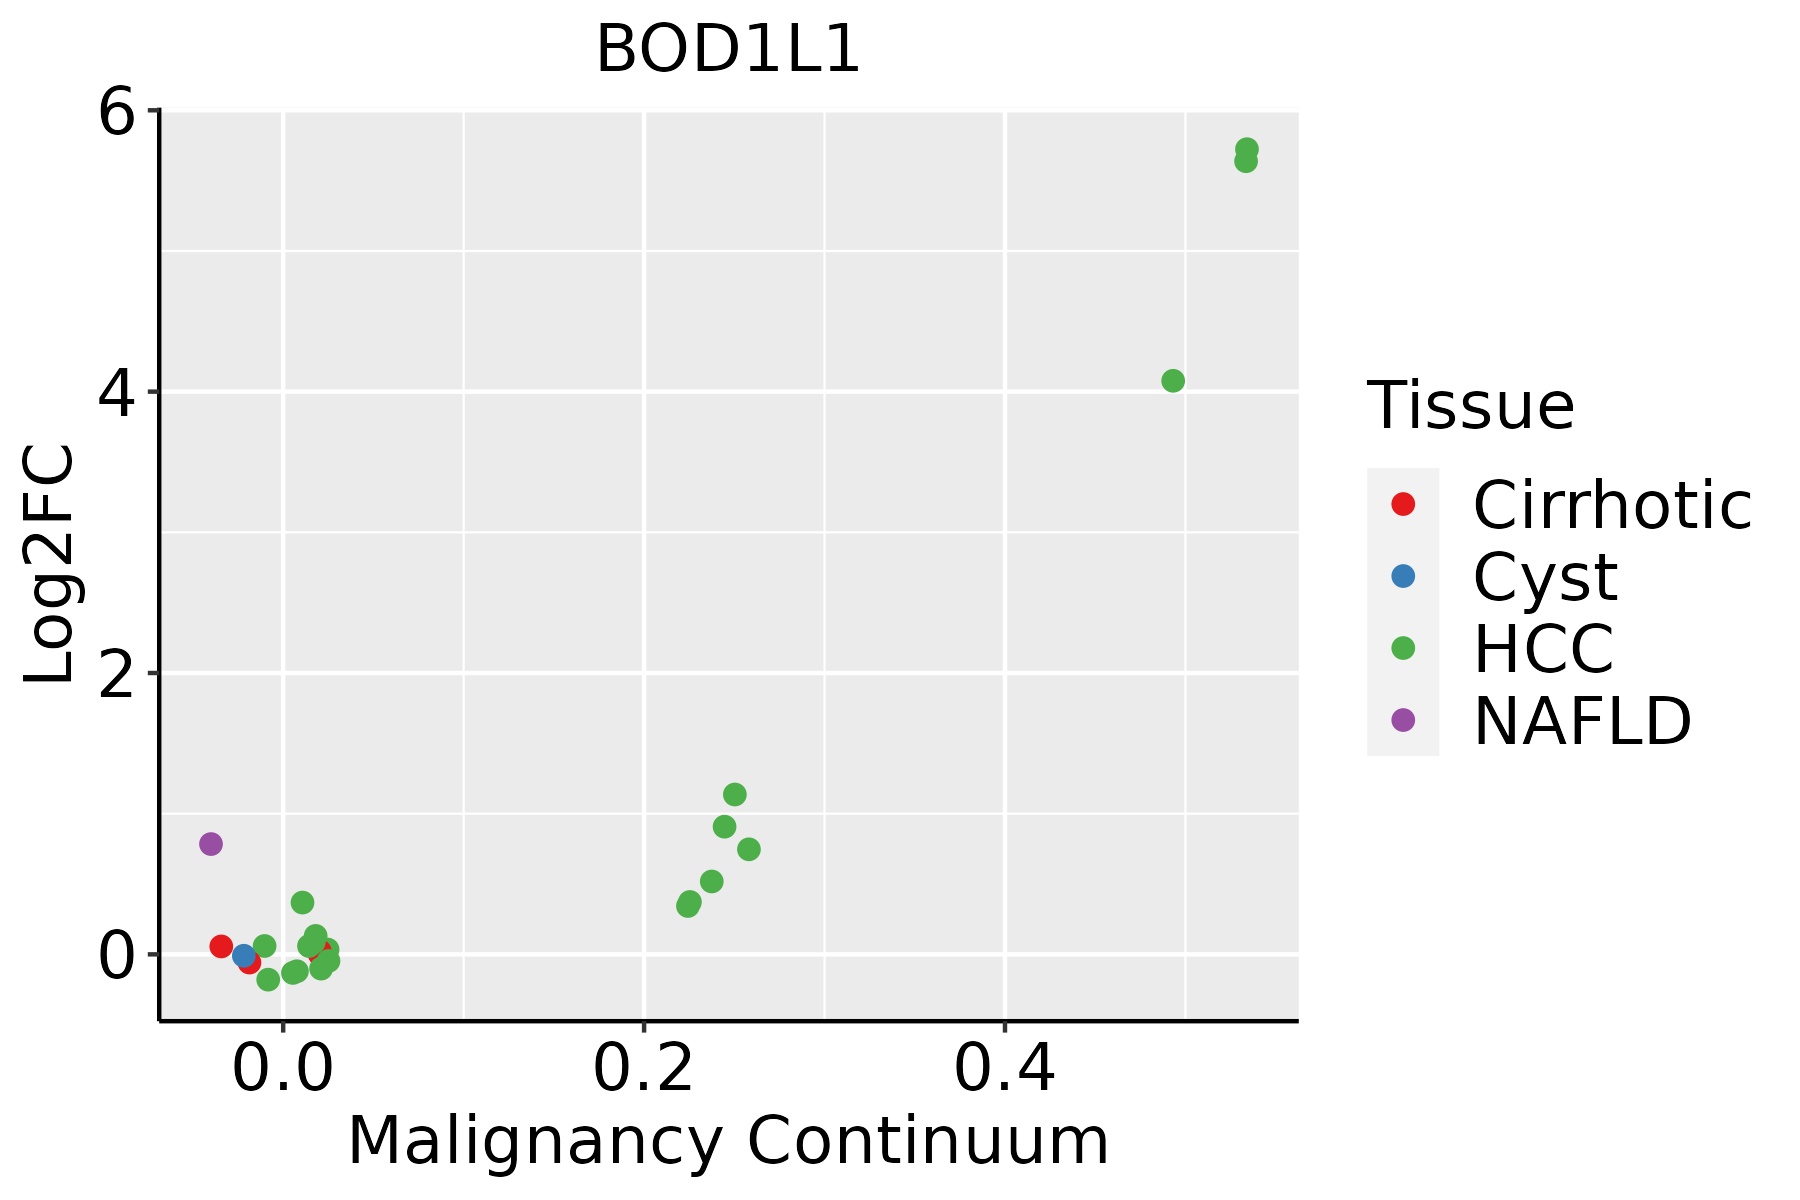
HCC: Hepatocellular carcinoma
NAFLD: Non-alcoholic fatty liver disease
Oral CavityThe image shows the transcriptomic changes along malignancy continuum.log2FC in expression of this searched gene in stem-like cells from each diseased tissue sample relative to stem-like cells in normal samples in each tissue plotted against the malignancy continuum. Samples are colored based on if they are from different disease stage.EOLP: Erosive Oral lichen planus
LP: leukoplakia
NEOLP: Non-erosive oral lichen planus
OSCC: Oral squamous cell carcinoma
ProstateThe image shows the transcriptomic changes along malignancy continuum.log2FC in expression of this searched gene in stem-like cells from each diseased tissue sample relative to stem-like cells in normal samples in each tissue plotted against the malignancy continuum. Samples are colored based on if they are from different disease stage.
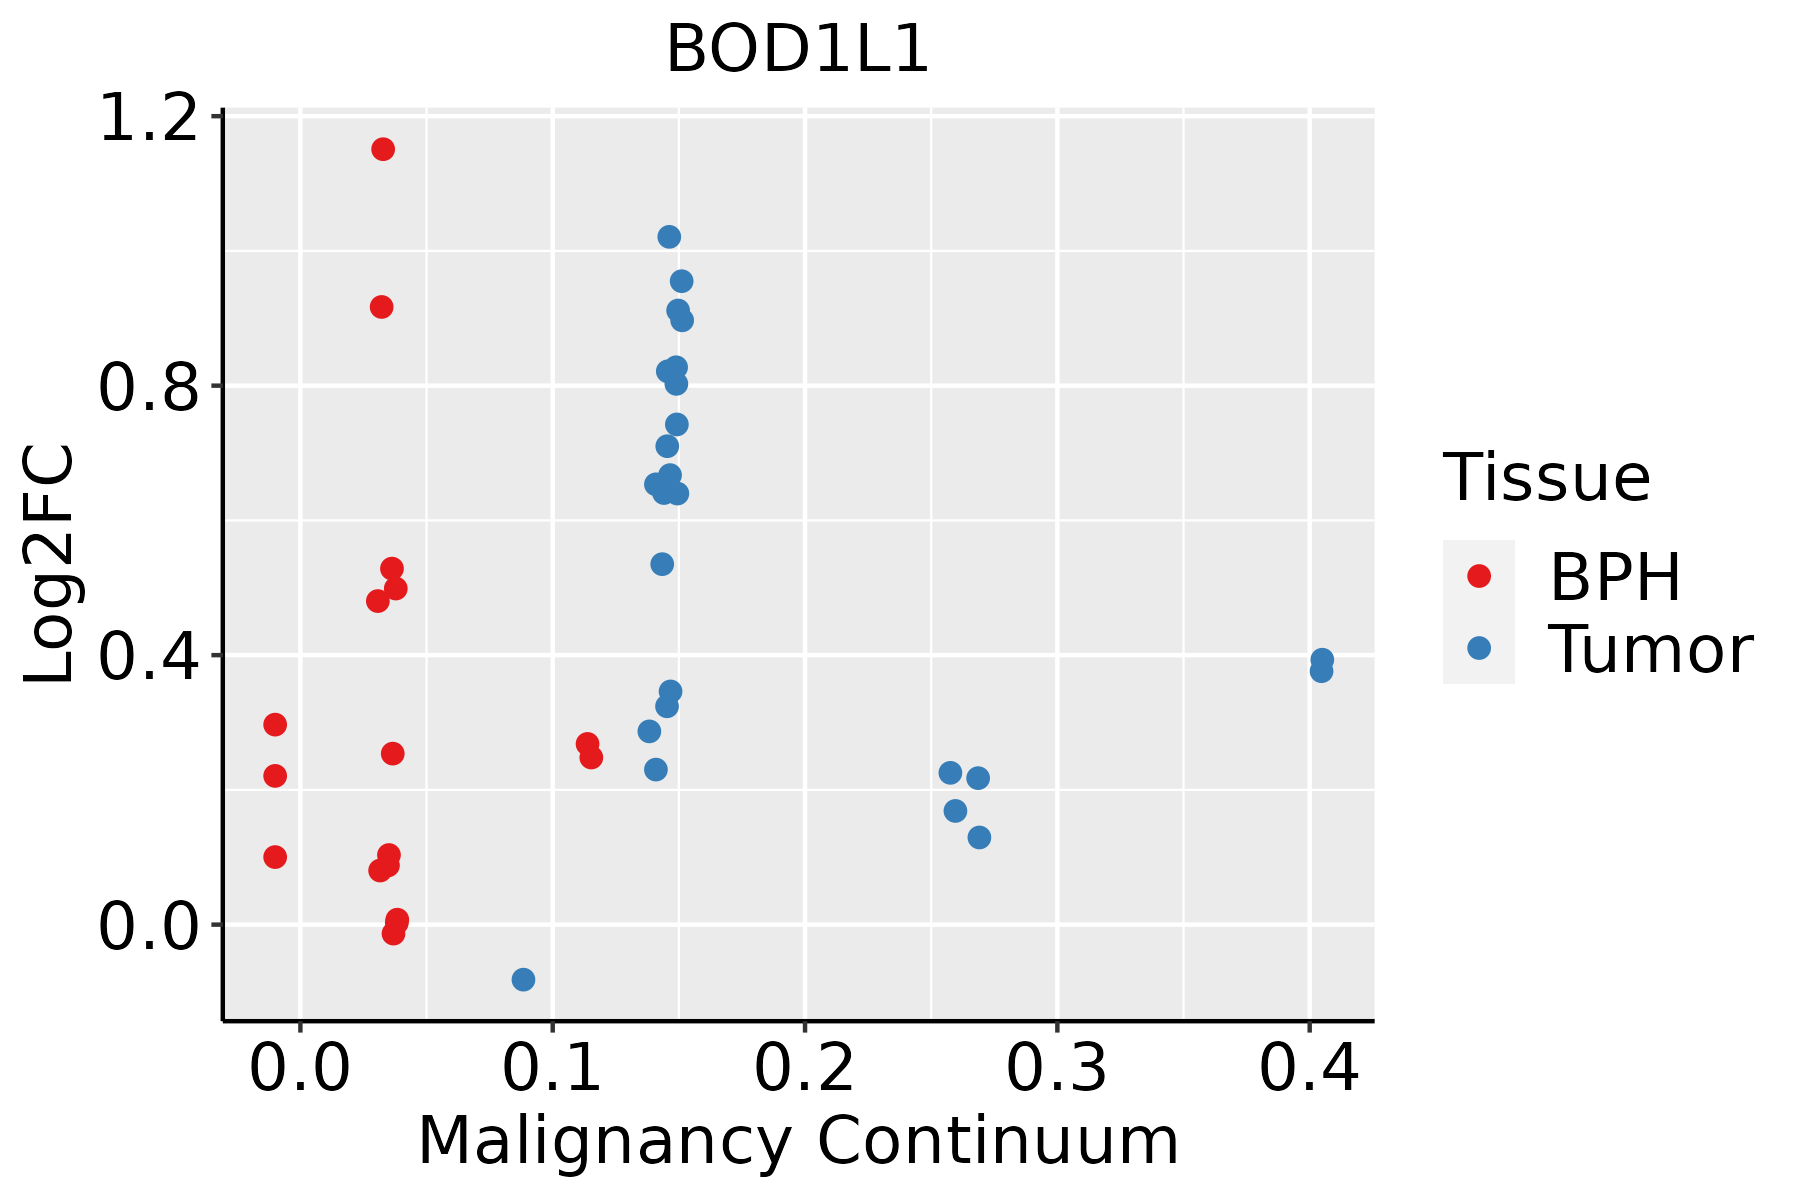
BPH: Benign Prostatic Hyperplasia
SkinThe image shows the transcriptomic changes along malignancy continuum.log2FC in expression of this searched gene in stem-like cells from each diseased tissue sample relative to stem-like cells in normal samples in each tissue plotted against the malignancy continuum. Samples are colored based on if they are from different disease stage.
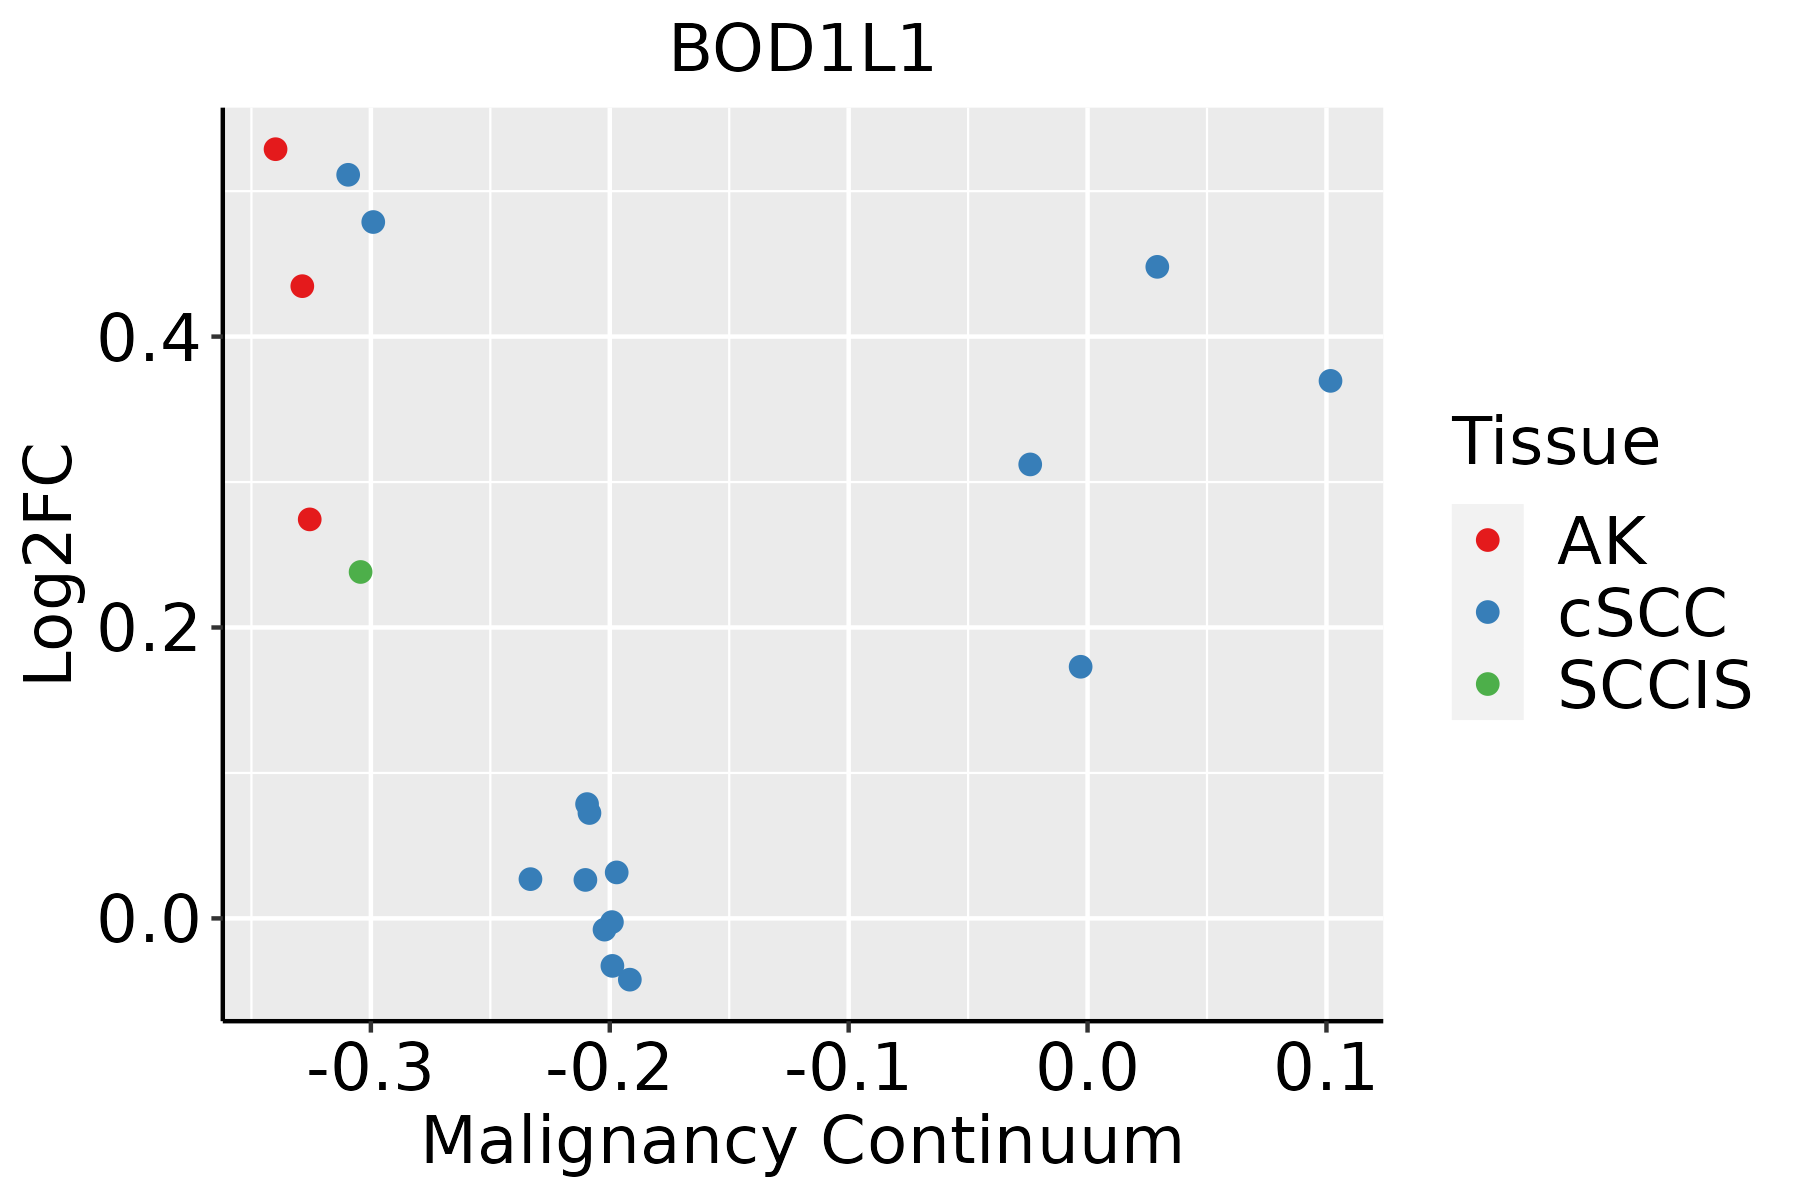
AK: Actinic keratosis
cSCC: Cutaneous squamous cell carcinoma
SCCIS:squamous cell carcinoma in situ
ThyroidThe image shows the transcriptomic changes along malignancy continuum.log2FC in expression of this searched gene in stem-like cells from each diseased tissue sample relative to stem-like cells in normal samples in each tissue plotted against the malignancy continuum. Samples are colored based on if they are from different disease stage.
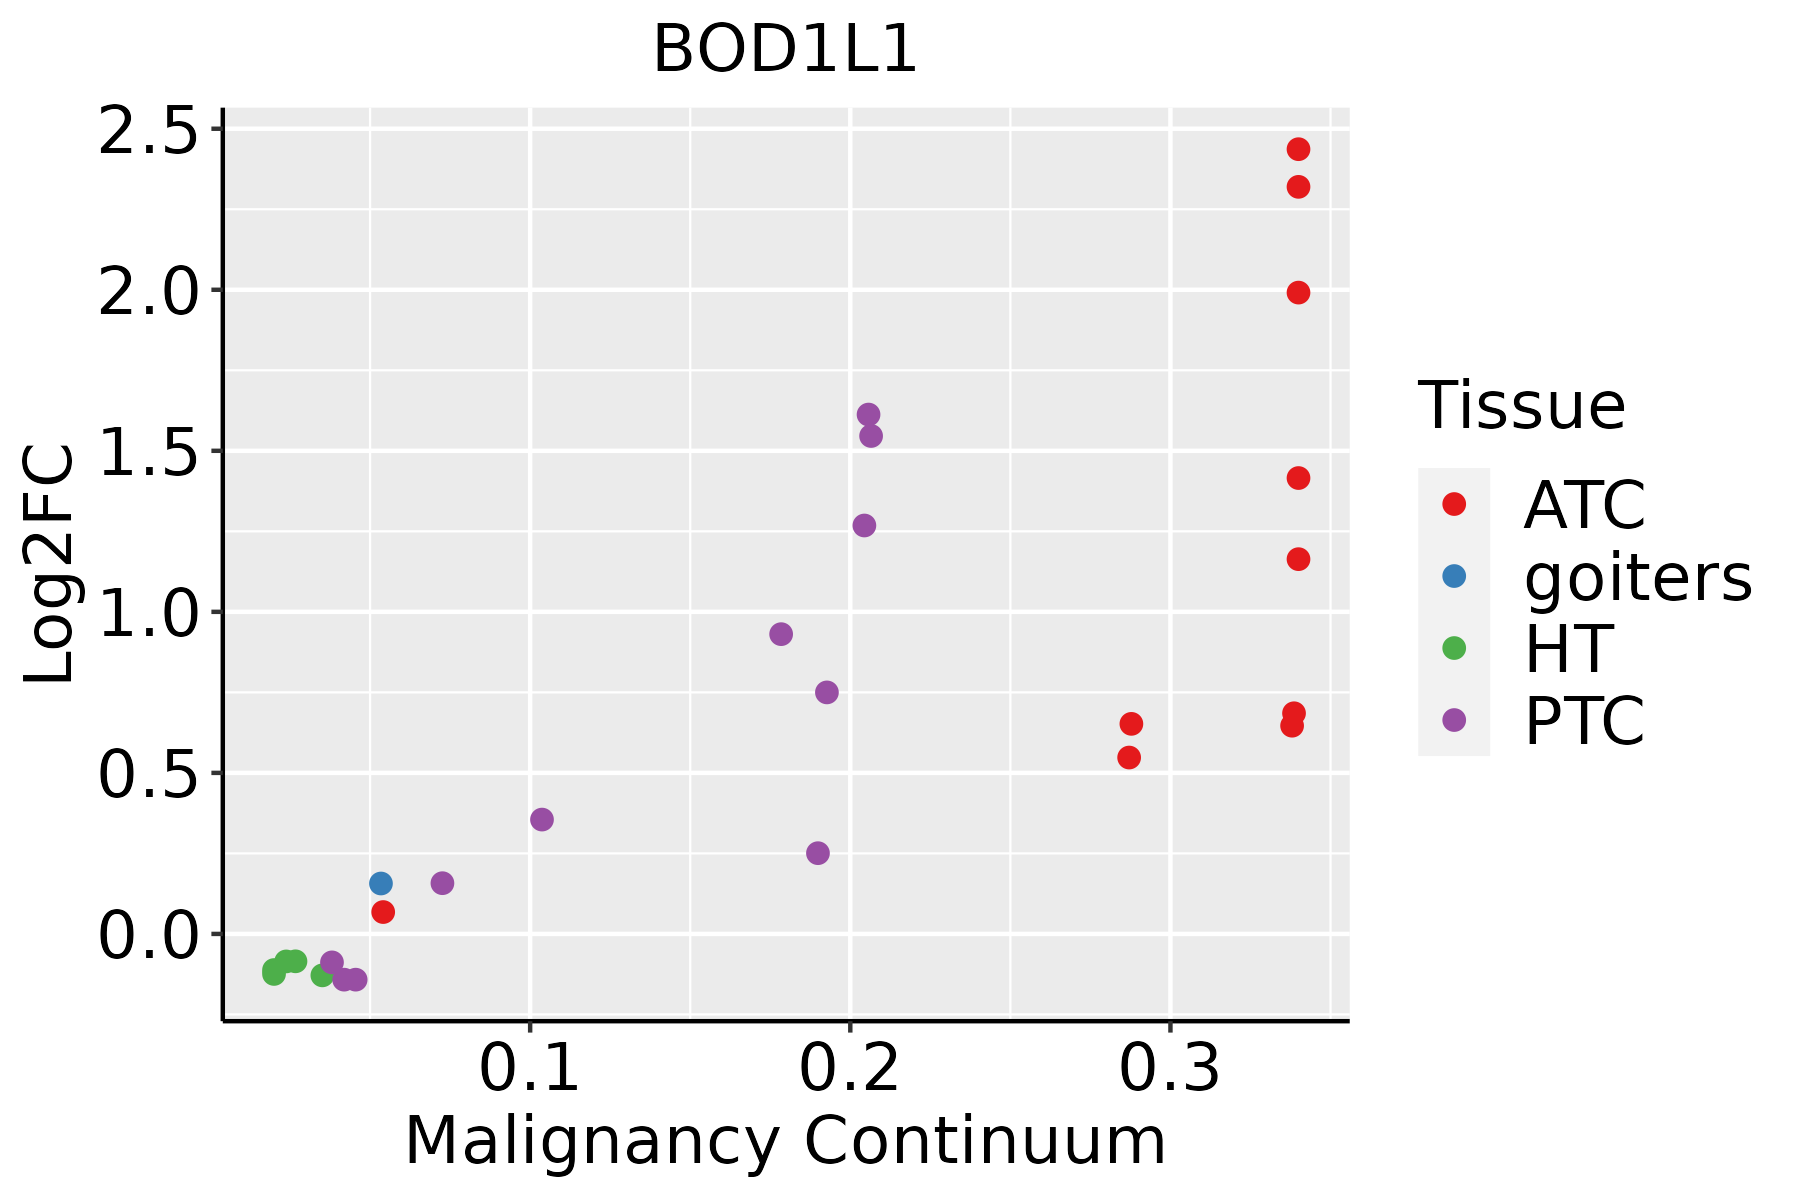
ATC: Anaplastic thyroid cancer
HT: Hashimoto's thyroiditis
PTC: Papillary thyroid cancer
∗log2FC in expression of this searched gene in stem-like cells from each diseased tissue sample relative to stem-like cells in normal samples in each tissue plotted against the malignancy continuum. Samples are colored based on if they are from different disease stage.

Top

Malignant transformation related pathway analysis

check buttonFind out the enriched GO biological processes and KEGG pathways involved in transition from healthy to precancer to cancer
check button Figure of enriched GO biological processes.
TissueDisease StageEnriched GO biological Processes
ColorectumADGO analysis - Figure of enriched GO biological processes: Top 15 enriched GO BP terms are showed in the bar plot of each disease state in each tissue. Each row represents a significant GO biological process which is colored according to the -log10(p.adjust).
ColorectumSERGO analysis - Figure of enriched GO biological processes: Top 15 enriched GO BP terms are showed in the bar plot of each disease state in each tissue. Each row represents a significant GO biological process which is colored according to the -log10(p.adjust).
ColorectumMSSGO analysis - Figure of enriched GO biological processes: Top 15 enriched GO BP terms are showed in the bar plot of each disease state in each tissue. Each row represents a significant GO biological process which is colored according to the -log10(p.adjust).
ColorectumMSI-HGO analysis - Figure of enriched GO biological processes: Top 15 enriched GO BP terms are showed in the bar plot of each disease state in each tissue. Each row represents a significant GO biological process which is colored according to the -log10(p.adjust).
ColorectumFAPGO analysis - Figure of enriched GO biological processes: Top 15 enriched GO BP terms are showed in the bar plot of each disease state in each tissue. Each row represents a significant GO biological process which is colored according to the -log10(p.adjust).
∗Top 15 enriched GO BP terms are showed in the bar plot of each disease state in each tissue. Each row represents a significant GO biological process which is colored according to the -log10(p.adjust).
Page: 1 2 3 4 5 6 7 8 9 

check button Enriched GO biological processes.
GO IDTissueDisease StageDescriptionGene RatioBg Ratiopvaluep.adjustCount
GO:0010563ColorectumADnegative regulation of phosphorus metabolic process130/3918442/187231.26e-052.76e-04130
GO:0045936ColorectumADnegative regulation of phosphate metabolic process129/3918441/187231.81e-053.76e-04129
GO:0016311ColorectumADdephosphorylation123/3918417/187231.84e-053.82e-04123
GO:0006470ColorectumADprotein dephosphorylation88/3918281/187232.56e-054.89e-0488
GO:0035303ColorectumADregulation of dephosphorylation46/3918128/187236.20e-051.04e-0346
GO:0035304ColorectumADregulation of protein dephosphorylation33/391890/187234.23e-044.77e-0333
GO:0010921ColorectumADregulation of phosphatase activity30/391884/187231.24e-031.09e-0230
GO:0043666ColorectumADregulation of phosphoprotein phosphatase activity21/391858/187235.25e-033.47e-0221
GO:0035308ColorectumADnegative regulation of protein dephosphorylation14/391834/187235.86e-033.69e-0214
GO:00105632ColorectumMSSnegative regulation of phosphorus metabolic process118/3467442/187231.18e-052.77e-04118
GO:00459362ColorectumMSSnegative regulation of phosphate metabolic process117/3467441/187231.74e-053.84e-04117
GO:00353032ColorectumMSSregulation of dephosphorylation41/3467128/187231.64e-042.33e-0341
GO:00353042ColorectumMSSregulation of protein dephosphorylation30/346790/187235.58e-046.19e-0330
GO:00064702ColorectumMSSprotein dephosphorylation73/3467281/187231.15e-031.12e-0273
GO:00163112ColorectumMSSdephosphorylation101/3467417/187231.98e-031.70e-02101
GO:00513461ColorectumMSSnegative regulation of hydrolase activity92/3467379/187232.85e-032.22e-0292
GO:00109212ColorectumMSSregulation of phosphatase activity26/346784/187234.06e-032.95e-0226
GO:00436662ColorectumMSSregulation of phosphoprotein phosphatase activity19/346758/187236.69e-034.38e-0219
GO:00163113ColorectumFAPdephosphorylation95/2622417/187237.07e-073.32e-0595
GO:00064704ColorectumFAPprotein dephosphorylation69/2622281/187231.47e-066.39e-0569
Page: 1 2 3 4 5 6 7 8 9 

check button Enriched KEGG pathways.
Pathway IDTissueDisease StageDescriptionGene RatioBg Ratiopvaluep.adjustqvalueCount
Page: 1 

Top

Cell-cell communication analysis

check buttonIdentification of potential cell-cell interactions between two cell types and their ligand-receptor pairs for different disease states
LigandReceptorLRpairPathwayTissueDisease Stage
Page: 1 

Top

Single-cell gene regulatory network inference analysis

check buttonFind out the significant the regulons (TFs) and the target genes of each regulon across cell types for different disease states
TFCell TypeTissueDisease StageTarget GeneRSSRegulon Activity
∗The dot plots of a searched regulon are shown for all cell subpopulations in each disease state of each tissue based on the regulon specific score inferred using pySCENIC and by calculating the average expression.
Page: 1 

Top

Somatic mutation of malignant transformation related genes

check buttonAnnotation of somatic variants for genes involved in malignant transformation
Hugo SymbolVariant ClassVariant ClassificationdbSNP RSHGVScHGVSpHGVSp ShortSWISSPROTBIOTYPESIFTPolyPhenTumor Sample BarcodeTissueHistologySexAgeStageTherapy TypesDrugsOutcome
BOD1L1SNVMissense_Mutationnovelc.5909N>Tp.Pro1970Leup.P1970LQ8NFC6protein_codingtolerated(0.48)benign(0)TCGA-A2-A0EM-01Breastbreast invasive carcinomaFemale>=65I/IIHormone TherapytamoxiphenSD
BOD1L1SNVMissense_Mutationc.2668N>Cp.Glu890Glnp.E890QQ8NFC6protein_codingdeleterious(0)probably_damaging(0.984)TCGA-A7-A26H-01Breastbreast invasive carcinomaFemale>=65I/IIHormone TherapyanastrozolePD
BOD1L1SNVMissense_Mutationnovelc.917N>Tp.Asp306Valp.D306VQ8NFC6protein_codingdeleterious(0)possibly_damaging(0.843)TCGA-A7-A3RF-01Breastbreast invasive carcinomaFemale>=65I/IIHormone TherapyanastrozolePD
BOD1L1SNVMissense_Mutationc.1459N>Cp.Glu487Glnp.E487QQ8NFC6protein_codingdeleterious(0)probably_damaging(0.996)TCGA-A8-A06U-01Breastbreast invasive carcinomaFemale>=65I/IIUnknownUnknownSD
BOD1L1SNVMissense_Mutationc.6967N>Cp.Asp2323Hisp.D2323HQ8NFC6protein_codingdeleterious(0)probably_damaging(0.96)TCGA-A8-A09I-01Breastbreast invasive carcinomaFemale>=65I/IIHormone TherapyanastrozoleSD
BOD1L1SNVMissense_Mutationc.9023N>Cp.Arg3008Thrp.R3008TQ8NFC6protein_codingdeleterious(0)probably_damaging(0.994)TCGA-AC-A23H-01Breastbreast invasive carcinomaFemale>=65I/IIUnknownUnknownPD
BOD1L1SNVMissense_Mutationc.398N>Ap.Arg133Glnp.R133QQ8NFC6protein_codingdeleterious(0)probably_damaging(0.999)TCGA-AC-A5XU-01Breastbreast invasive carcinomaFemale>=65I/IIHormone TherapyletrozoleSD
BOD1L1SNVMissense_Mutationnovelc.2413G>Tp.Asp805Tyrp.D805YQ8NFC6protein_codingdeleterious(0)probably_damaging(0.996)TCGA-AN-A046-01Breastbreast invasive carcinomaFemale>=65I/IIUnknownUnknownSD
BOD1L1SNVMissense_Mutationrs150805259c.3554N>Ap.Arg1185Hisp.R1185HQ8NFC6protein_codingtolerated(0.06)benign(0.006)TCGA-AN-A0AK-01Breastbreast invasive carcinomaFemale>=65I/IIUnknownUnknownSD
BOD1L1SNVMissense_Mutationc.2524N>Ap.Ser842Thrp.S842TQ8NFC6protein_codingdeleterious(0.03)benign(0.159)TCGA-AN-A0AK-01Breastbreast invasive carcinomaFemale>=65I/IIUnknownUnknownSD
Page: 1 2 3 4 5 6 7 8 9 10 11 12 13 14 15 16 17 18 19 20 21 22 23 24 25 26 27 28 29 30 31 32 33 34 35 36 37 

Top

Related drugs of malignant transformation related genes

check buttonIdentification of chemicals and drugs interact with genes involved in malignant transfromation
(DGIdb 4.0)
Entrez IDSymbolCategoryInteraction TypesDrug Claim NameDrug NamePMIDs
Page: 1