
|
|||||
|
 | |
| |
| |
| |
| |
| |
|
Gene: BOC |
Gene summary for BOC |
| Gene information | Species | Human | Gene symbol | BOC | Gene ID | 91653 |
| Gene name | BOC cell adhesion associated, oncogene regulated | |
| Gene Alias | Boi | |
| Cytomap | 3q13.2 | |
| Gene Type | protein-coding | GO ID | GO:0000902 | UniProtAcc | Q9BWV1 |
Top |
Malignant transformation analysis |
| Identification of the aberrant gene expression in precancerous and cancerous lesions by comparing the gene expression of stem-like cells in diseased tissues with normal stem cells |
| Entrez ID | Symbol | Replicates | Species | Organ | Tissue | Adj P-value | Log2FC | Malignancy |
| 91653 | BOC | C43 | Human | Oral cavity | OSCC | 3.94e-04 | -1.61e-01 | 0.1704 |
| 91653 | BOC | LP17 | Human | Oral cavity | LP | 1.48e-03 | 8.62e-01 | 0.2349 |
| 91653 | BOC | SYSMH3 | Human | Oral cavity | OSCC | 3.61e-06 | 2.86e-01 | 0.2442 |
| 91653 | BOC | SYSMH4 | Human | Oral cavity | OSCC | 1.88e-13 | 5.17e-01 | 0.1226 |
| 91653 | BOC | P1_S1_AK | Human | Skin | AK | 3.48e-06 | 4.09e-01 | -0.3399 |
| 91653 | BOC | P2_S3_AK | Human | Skin | AK | 2.72e-06 | 4.16e-01 | -0.3287 |
| 91653 | BOC | P3_S6_AK | Human | Skin | AK | 1.56e-03 | 3.04e-01 | -0.3256 |
| 91653 | BOC | P4_S8_cSCC | Human | Skin | cSCC | 1.22e-05 | 2.14e-01 | -0.3095 |
| 91653 | BOC | P1_cSCC | Human | Skin | cSCC | 6.66e-08 | 4.18e-01 | 0.0292 |
| 91653 | BOC | P2_cSCC | Human | Skin | cSCC | 4.57e-14 | 4.63e-01 | -0.024 |
| 91653 | BOC | male-WTA | Human | Thyroid | PTC | 1.71e-14 | 1.76e-01 | 0.1037 |
| 91653 | BOC | PTC01 | Human | Thyroid | PTC | 1.04e-06 | 1.82e-01 | 0.1899 |
| 91653 | BOC | PTC04 | Human | Thyroid | PTC | 7.59e-13 | 3.02e-01 | 0.1927 |
| 91653 | BOC | PTC05 | Human | Thyroid | PTC | 9.59e-03 | 1.10e-01 | 0.2065 |
| 91653 | BOC | PTC06 | Human | Thyroid | PTC | 9.20e-14 | 3.72e-01 | 0.2057 |
| 91653 | BOC | PTC07 | Human | Thyroid | PTC | 1.22e-32 | 5.20e-01 | 0.2044 |
| 91653 | BOC | ATC12 | Human | Thyroid | ATC | 1.41e-10 | 1.60e-01 | 0.34 |
| 91653 | BOC | ATC13 | Human | Thyroid | ATC | 3.53e-04 | 1.46e-01 | 0.34 |
| 91653 | BOC | ATC4 | Human | Thyroid | ATC | 8.51e-11 | 2.02e-01 | 0.34 |
| 91653 | BOC | ATC5 | Human | Thyroid | ATC | 9.00e-07 | 1.70e-01 | 0.34 |
| Page: 1 |
| Tissue | Expression Dynamics | Abbreviation |
| Oral Cavity |  | EOLP: Erosive Oral lichen planus |
| LP: leukoplakia | ||
| NEOLP: Non-erosive oral lichen planus | ||
| OSCC: Oral squamous cell carcinoma | ||
| Skin | 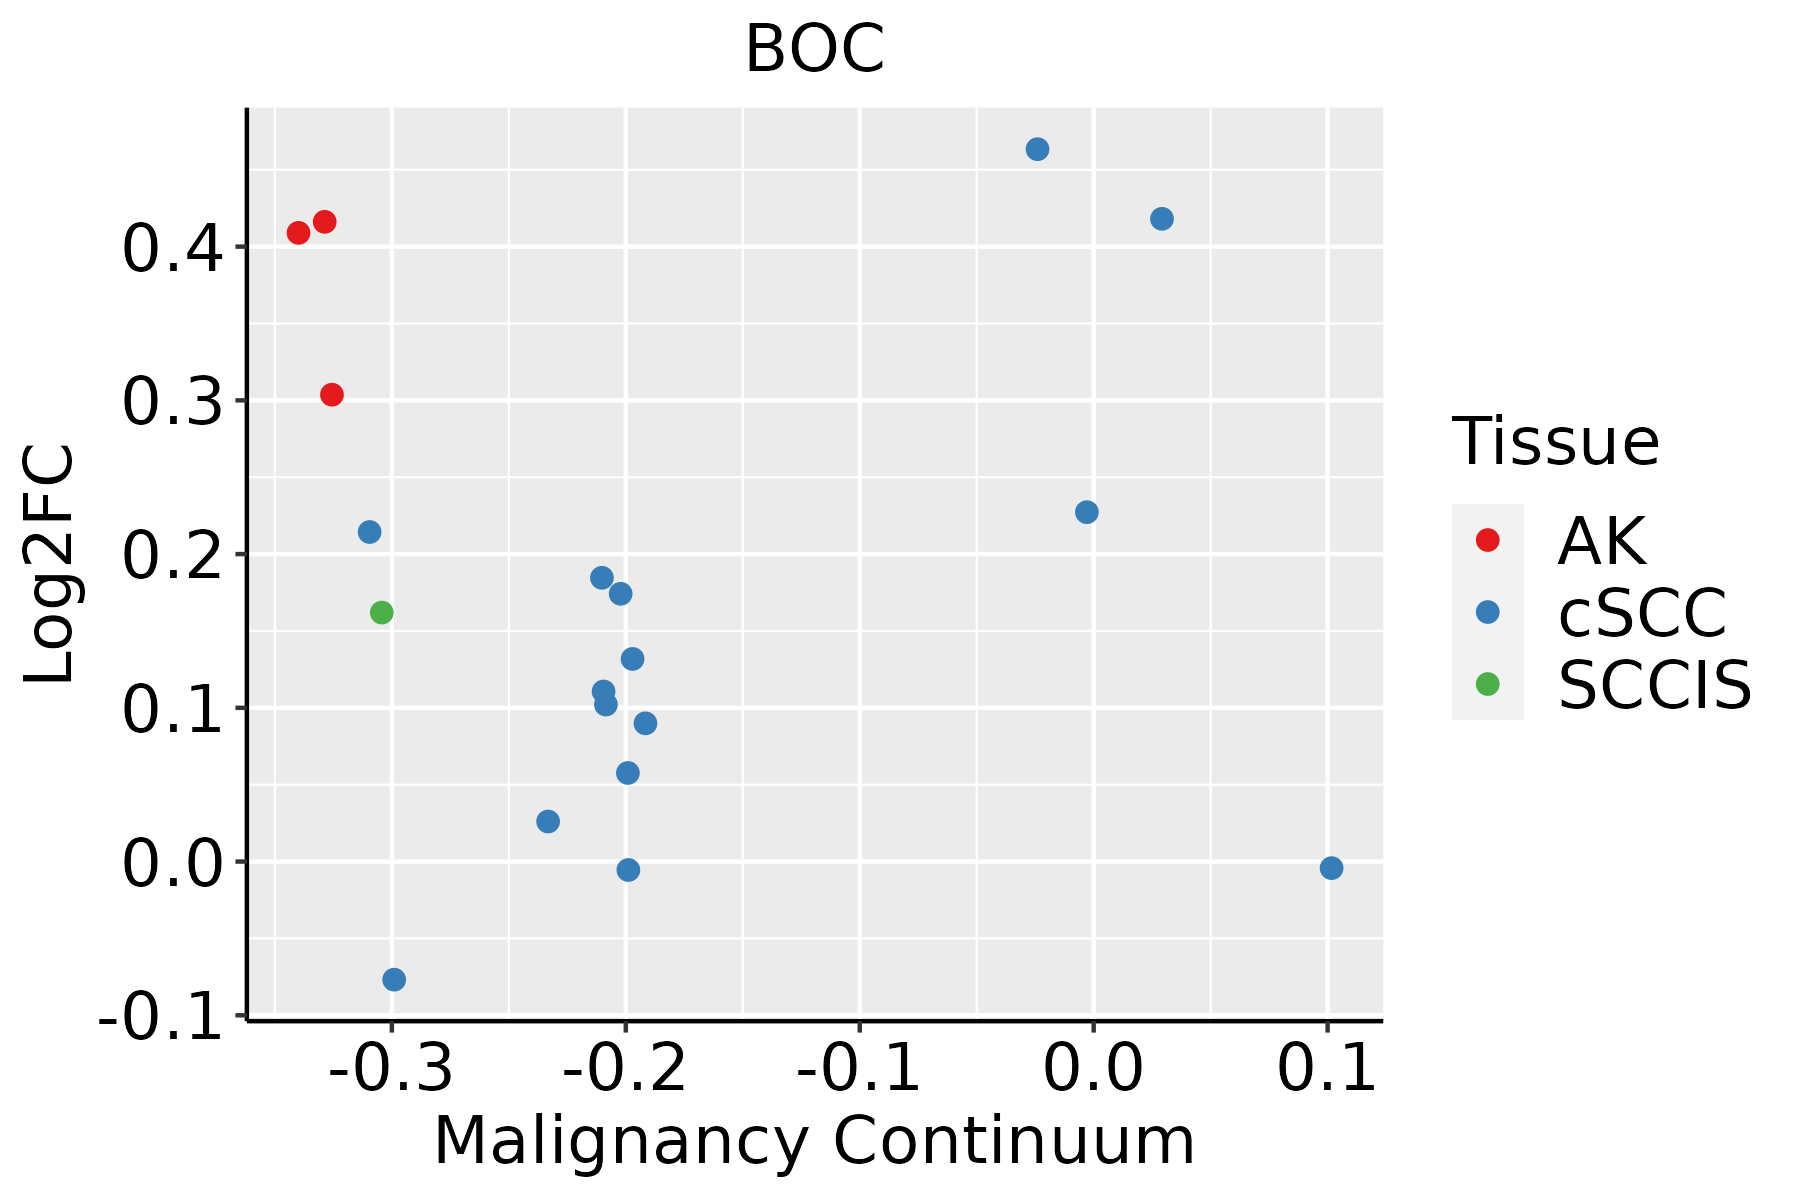 | AK: Actinic keratosis |
| cSCC: Cutaneous squamous cell carcinoma | ||
| SCCIS:squamous cell carcinoma in situ | ||
| Thyroid |  | ATC: Anaplastic thyroid cancer |
| HT: Hashimoto's thyroiditis | ||
| PTC: Papillary thyroid cancer |
| ∗log2FC in expression of this searched gene in stem-like cells from each diseased tissue sample relative to stem-like cells in normal samples in each tissue plotted against the malignancy continuum. Samples are colored based on if they are from different disease stage. |
Top |
Malignant transformation related pathway analysis |
| Find out the enriched GO biological processes and KEGG pathways involved in transition from healthy to precancer to cancer |
| Tissue | Disease Stage | Enriched GO biological Processes |
| Colorectum | AD |  |
| Colorectum | SER |  |
| Colorectum | MSS |  |
| Colorectum | MSI-H |  |
| Colorectum | FAP |  |
| ∗Top 15 enriched GO BP terms are showed in the bar plot of each disease state in each tissue. Each row represents a significant GO biological process which is colored according to the -log10(p.adjust). |
| Page: 1 2 3 4 5 6 7 8 9 |
| GO ID | Tissue | Disease Stage | Description | Gene Ratio | Bg Ratio | pvalue | p.adjust | Count |
| GO:00454453 | Oral cavity | OSCC | myoblast differentiation | 46/7305 | 84/18723 | 2.43e-03 | 1.07e-02 | 46 |
| GO:006156410 | Oral cavity | OSCC | axon development | 207/7305 | 467/18723 | 1.01e-02 | 3.51e-02 | 207 |
| GO:004544512 | Oral cavity | LP | myoblast differentiation | 35/4623 | 84/18723 | 4.56e-04 | 4.33e-03 | 35 |
| GO:0045661 | Oral cavity | LP | regulation of myoblast differentiation | 22/4623 | 51/18723 | 2.96e-03 | 2.03e-02 | 22 |
| GO:006156416 | Skin | AK | axon development | 91/1910 | 467/18723 | 8.60e-10 | 8.63e-08 | 91 |
| GO:000740916 | Skin | AK | axonogenesis | 80/1910 | 418/18723 | 2.07e-08 | 1.19e-06 | 80 |
| GO:00074112 | Skin | AK | axon guidance | 42/1910 | 227/18723 | 1.01e-04 | 1.33e-03 | 42 |
| GO:00974852 | Skin | AK | neuron projection guidance | 42/1910 | 228/18723 | 1.11e-04 | 1.43e-03 | 42 |
| GO:00454455 | Skin | AK | myoblast differentiation | 16/1910 | 84/18723 | 1.01e-02 | 4.84e-02 | 16 |
| GO:004544513 | Skin | cSCC | myoblast differentiation | 35/4864 | 84/18723 | 1.23e-03 | 7.97e-03 | 35 |
| GO:006156422 | Skin | cSCC | axon development | 146/4864 | 467/18723 | 5.50e-03 | 2.73e-02 | 146 |
| GO:006156419 | Thyroid | PTC | axon development | 199/5968 | 467/18723 | 5.27e-07 | 8.53e-06 | 199 |
| GO:000740918 | Thyroid | PTC | axonogenesis | 178/5968 | 418/18723 | 2.17e-06 | 2.91e-05 | 178 |
| GO:006156423 | Thyroid | ATC | axon development | 220/6293 | 467/18723 | 6.85e-10 | 1.80e-08 | 220 |
| GO:000740919 | Thyroid | ATC | axonogenesis | 197/6293 | 418/18723 | 5.09e-09 | 1.13e-07 | 197 |
| GO:00074113 | Thyroid | ATC | axon guidance | 96/6293 | 227/18723 | 3.74e-03 | 1.63e-02 | 96 |
| GO:00974853 | Thyroid | ATC | neuron projection guidance | 96/6293 | 228/18723 | 4.36e-03 | 1.81e-02 | 96 |
| GO:0007224 | Thyroid | ATC | smoothened signaling pathway | 60/6293 | 138/18723 | 9.75e-03 | 3.57e-02 | 60 |
| Page: 1 |
| Pathway ID | Tissue | Disease Stage | Description | Gene Ratio | Bg Ratio | pvalue | p.adjust | qvalue | Count |
| hsa0436014 | Oral cavity | OSCC | Axon guidance | 97/3704 | 182/8465 | 5.59e-03 | 1.33e-02 | 6.76e-03 | 97 |
| hsa0436015 | Oral cavity | OSCC | Axon guidance | 97/3704 | 182/8465 | 5.59e-03 | 1.33e-02 | 6.76e-03 | 97 |
| Page: 1 |
Top |
Cell-cell communication analysis |
| Identification of potential cell-cell interactions between two cell types and their ligand-receptor pairs for different disease states |
| Ligand | Receptor | LRpair | Pathway | Tissue | Disease Stage |
| Page: 1 |
Top |
Single-cell gene regulatory network inference analysis |
| Find out the significant the regulons (TFs) and the target genes of each regulon across cell types for different disease states |
| TF | Cell Type | Tissue | Disease Stage | Target Gene | RSS | Regulon Activity |
| ∗The dot plots of a searched regulon are shown for all cell subpopulations in each disease state of each tissue based on the regulon specific score inferred using pySCENIC and by calculating the average expression. |
| Page: 1 |
Top |
Somatic mutation of malignant transformation related genes |
| Annotation of somatic variants for genes involved in malignant transformation |
| Hugo Symbol | Variant Class | Variant Classification | dbSNP RS | HGVSc | HGVSp | HGVSp Short | SWISSPROT | BIOTYPE | SIFT | PolyPhen | Tumor Sample Barcode | Tissue | Histology | Sex | Age | Stage | Therapy Types | Drugs | Outcome |
| BOC | SNV | Missense_Mutation | c.3140N>T | p.Trp1047Leu | p.W1047L | Q9BWV1 | protein_coding | tolerated_low_confidence(0.14) | benign(0.001) | TCGA-A8-A09N-01 | Breast | breast invasive carcinoma | Female | <65 | III/IV | Unknown | Unknown | SD | |
| BOC | SNV | Missense_Mutation | c.460N>C | p.Glu154Gln | p.E154Q | Q9BWV1 | protein_coding | tolerated(0.09) | benign(0.434) | TCGA-AC-A23H-01 | Breast | breast invasive carcinoma | Female | >=65 | I/II | Unknown | Unknown | PD | |
| BOC | SNV | Missense_Mutation | novel | c.1654N>A | p.Ala552Thr | p.A552T | Q9BWV1 | protein_coding | deleterious(0) | probably_damaging(0.933) | TCGA-AN-A046-01 | Breast | breast invasive carcinoma | Female | >=65 | I/II | Unknown | Unknown | SD |
| BOC | SNV | Missense_Mutation | c.500N>T | p.Gln167Leu | p.Q167L | Q9BWV1 | protein_coding | tolerated(0.15) | benign(0.061) | TCGA-E2-A1II-01 | Breast | breast invasive carcinoma | Female | <65 | I/II | Chemotherapy | doxorubicin | SD | |
| BOC | SNV | Missense_Mutation | c.152G>A | p.Gly51Asp | p.G51D | Q9BWV1 | protein_coding | deleterious(0.02) | possibly_damaging(0.734) | TCGA-E9-A1RE-01 | Breast | breast invasive carcinoma | Female | >=65 | III/IV | Hormone Therapy | tamoxiphen | SD | |
| BOC | insertion | Frame_Shift_Ins | novel | c.45_46insACAACACATCTCTCAGTTGAGAA | p.Val16ThrfsTer16 | p.V16Tfs*16 | Q9BWV1 | protein_coding | TCGA-B6-A0IE-01 | Breast | breast invasive carcinoma | Female | <65 | III/IV | Unknown | Unknown | PD | ||
| BOC | insertion | Nonsense_Mutation | novel | c.1652_1653insTTACTTTTTCCTTTAAAGAGCTAGGAATTTGA | p.Ala552TyrfsTer5 | p.A552Yfs*5 | Q9BWV1 | protein_coding | TCGA-BH-A0HK-01 | Breast | breast invasive carcinoma | Female | >=65 | I/II | Hormone Therapy | arimidex | SD | ||
| BOC | deletion | Frame_Shift_Del | novel | c.3020delN | p.Asp1007AlafsTer28 | p.D1007Afs*28 | Q9BWV1 | protein_coding | TCGA-EW-A2FV-01 | Breast | breast invasive carcinoma | Female | <65 | III/IV | Chemotherapy | docetaxel | SD | ||
| BOC | SNV | Missense_Mutation | rs148702312 | c.2584N>A | p.Val862Ile | p.V862I | Q9BWV1 | protein_coding | tolerated(0.07) | probably_damaging(0.999) | TCGA-EA-A3HU-01 | Cervix | cervical & endocervical cancer | Female | <65 | I/II | Unknown | Unknown | SD |
| BOC | SNV | Missense_Mutation | rs541680773 | c.1118N>A | p.Arg373His | p.R373H | Q9BWV1 | protein_coding | tolerated(0.13) | benign(0.007) | TCGA-EA-A410-01 | Cervix | cervical & endocervical cancer | Female | <65 | I/II | Unknown | Unknown | SD |
| Page: 1 2 3 4 5 6 7 8 9 10 11 12 |
Top |
Related drugs of malignant transformation related genes |
| Identification of chemicals and drugs interact with genes involved in malignant transfromation |
| (DGIdb 4.0) |
| Entrez ID | Symbol | Category | Interaction Types | Drug Claim Name | Drug Name | PMIDs |
| Page: 1 |

Copyright 2023-Present -The University of Texas Health Science Center at Houston |