
|
|||||
|
 | |
| |
| |
| |
| |
| |
|
Gene: BNIPL |
Gene summary for BNIPL |
| Gene information | Species | Human | Gene symbol | BNIPL | Gene ID | 149428 |
| Gene name | BCL2 interacting protein like | |
| Gene Alias | BNIP-S | |
| Cytomap | 1q21.3 | |
| Gene Type | protein-coding | GO ID | GO:0006915 | UniProtAcc | Q7Z465 |
Top |
Malignant transformation analysis |
| Identification of the aberrant gene expression in precancerous and cancerous lesions by comparing the gene expression of stem-like cells in diseased tissues with normal stem cells |
| Entrez ID | Symbol | Replicates | Species | Organ | Tissue | Adj P-value | Log2FC | Malignancy |
| 149428 | BNIPL | LZE24T | Human | Esophagus | ESCC | 2.02e-04 | 1.63e-01 | 0.0596 |
| 149428 | BNIPL | P1T-E | Human | Esophagus | ESCC | 5.46e-03 | 5.36e-01 | 0.0875 |
| 149428 | BNIPL | P2T-E | Human | Esophagus | ESCC | 1.18e-05 | 5.70e-02 | 0.1177 |
| 149428 | BNIPL | P10T-E | Human | Esophagus | ESCC | 3.51e-03 | 1.57e-02 | 0.116 |
| 149428 | BNIPL | P12T-E | Human | Esophagus | ESCC | 3.11e-02 | 1.60e-02 | 0.1122 |
| 149428 | BNIPL | P15T-E | Human | Esophagus | ESCC | 1.43e-02 | 9.68e-02 | 0.1149 |
| 149428 | BNIPL | P20T-E | Human | Esophagus | ESCC | 1.04e-03 | 8.43e-02 | 0.1124 |
| 149428 | BNIPL | P22T-E | Human | Esophagus | ESCC | 1.12e-12 | 1.64e-01 | 0.1236 |
| 149428 | BNIPL | P23T-E | Human | Esophagus | ESCC | 8.24e-04 | 1.65e-01 | 0.108 |
| 149428 | BNIPL | P27T-E | Human | Esophagus | ESCC | 1.29e-06 | 1.80e-01 | 0.1055 |
| 149428 | BNIPL | P28T-E | Human | Esophagus | ESCC | 6.09e-14 | 4.56e-01 | 0.1149 |
| 149428 | BNIPL | P31T-E | Human | Esophagus | ESCC | 2.09e-07 | 1.21e-01 | 0.1251 |
| 149428 | BNIPL | P39T-E | Human | Esophagus | ESCC | 2.91e-09 | 1.73e-01 | 0.0894 |
| 149428 | BNIPL | P42T-E | Human | Esophagus | ESCC | 1.51e-02 | 1.11e-01 | 0.1175 |
| 149428 | BNIPL | P47T-E | Human | Esophagus | ESCC | 9.07e-07 | 1.79e-01 | 0.1067 |
| 149428 | BNIPL | P48T-E | Human | Esophagus | ESCC | 1.01e-12 | 4.67e-02 | 0.0959 |
| 149428 | BNIPL | P54T-E | Human | Esophagus | ESCC | 1.55e-04 | 1.87e-01 | 0.0975 |
| 149428 | BNIPL | P57T-E | Human | Esophagus | ESCC | 1.23e-02 | 7.72e-02 | 0.0926 |
| 149428 | BNIPL | P62T-E | Human | Esophagus | ESCC | 1.66e-04 | 8.81e-02 | 0.1302 |
| 149428 | BNIPL | P79T-E | Human | Esophagus | ESCC | 3.13e-04 | -1.11e-02 | 0.1154 |
| Page: 1 2 |
| Tissue | Expression Dynamics | Abbreviation |
| Esophagus | 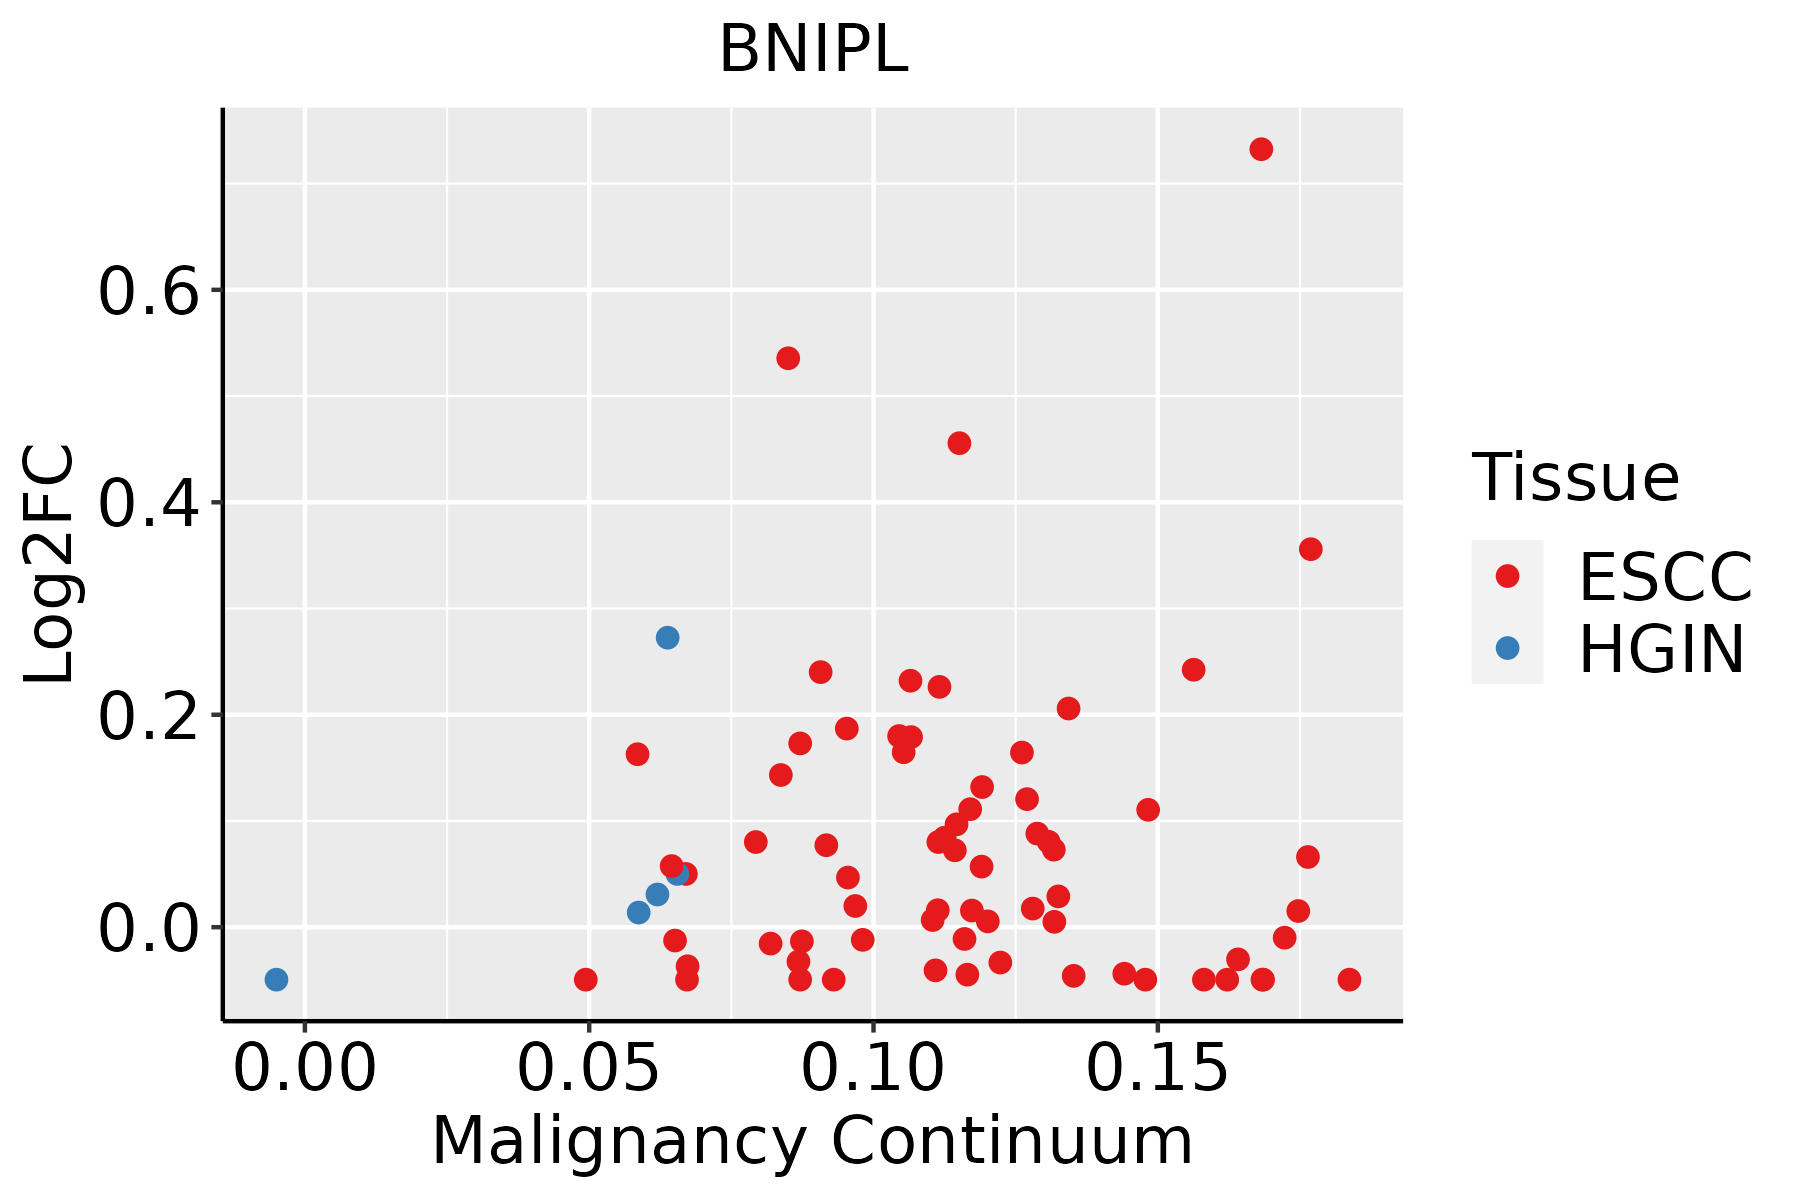 | ESCC: Esophageal squamous cell carcinoma |
| HGIN: High-grade intraepithelial neoplasias | ||
| LGIN: Low-grade intraepithelial neoplasias | ||
| Lung |  | AAH: Atypical adenomatous hyperplasia |
| AIS: Adenocarcinoma in situ | ||
| IAC: Invasive lung adenocarcinoma | ||
| MIA: Minimally invasive adenocarcinoma |
| ∗log2FC in expression of this searched gene in stem-like cells from each diseased tissue sample relative to stem-like cells in normal samples in each tissue plotted against the malignancy continuum. Samples are colored based on if they are from different disease stage. |
Top |
Malignant transformation related pathway analysis |
| Find out the enriched GO biological processes and KEGG pathways involved in transition from healthy to precancer to cancer |
| Tissue | Disease Stage | Enriched GO biological Processes |
| Colorectum | AD |  |
| Colorectum | SER |  |
| Colorectum | MSS |  |
| Colorectum | MSI-H |  |
| Colorectum | FAP |  |
| ∗Top 15 enriched GO BP terms are showed in the bar plot of each disease state in each tissue. Each row represents a significant GO biological process which is colored according to the -log10(p.adjust). |
| Page: 1 2 3 4 5 6 7 8 9 |
| GO ID | Tissue | Disease Stage | Description | Gene Ratio | Bg Ratio | pvalue | p.adjust | Count |
| Page: 1 |
| Pathway ID | Tissue | Disease Stage | Description | Gene Ratio | Bg Ratio | pvalue | p.adjust | qvalue | Count |
| Page: 1 |
Top |
Cell-cell communication analysis |
| Identification of potential cell-cell interactions between two cell types and their ligand-receptor pairs for different disease states |
| Ligand | Receptor | LRpair | Pathway | Tissue | Disease Stage |
| Page: 1 |
Top |
Single-cell gene regulatory network inference analysis |
| Find out the significant the regulons (TFs) and the target genes of each regulon across cell types for different disease states |
| TF | Cell Type | Tissue | Disease Stage | Target Gene | RSS | Regulon Activity |
| ∗The dot plots of a searched regulon are shown for all cell subpopulations in each disease state of each tissue based on the regulon specific score inferred using pySCENIC and by calculating the average expression. |
| Page: 1 |
Top |
Somatic mutation of malignant transformation related genes |
| Annotation of somatic variants for genes involved in malignant transformation |
| Hugo Symbol | Variant Class | Variant Classification | dbSNP RS | HGVSc | HGVSp | HGVSp Short | SWISSPROT | BIOTYPE | SIFT | PolyPhen | Tumor Sample Barcode | Tissue | Histology | Sex | Age | Stage | Therapy Types | Drugs | Outcome |
| BNIPL | SNV | Missense_Mutation | novel | c.295G>T | p.Gly99Trp | p.G99W | Q7Z465 | protein_coding | deleterious(0) | probably_damaging(0.941) | TCGA-A7-A0DB-01 | Breast | breast invasive carcinoma | Female | <65 | I/II | Hormone Therapy | arimidex | SD |
| BNIPL | SNV | Missense_Mutation | rs147322488 | c.961C>T | p.Arg321Cys | p.R321C | Q7Z465 | protein_coding | deleterious(0.02) | probably_damaging(0.991) | TCGA-AN-A046-01 | Breast | breast invasive carcinoma | Female | >=65 | I/II | Unknown | Unknown | SD |
| BNIPL | SNV | Missense_Mutation | novel | c.985C>A | p.Leu329Met | p.L329M | Q7Z465 | protein_coding | deleterious(0) | probably_damaging(0.999) | TCGA-D8-A1X5-01 | Breast | breast invasive carcinoma | Female | >=65 | III/IV | Hormone Therapy | tamoxiphen | SD |
| BNIPL | SNV | Missense_Mutation | novel | c.346G>C | p.Asp116His | p.D116H | Q7Z465 | protein_coding | deleterious(0) | possibly_damaging(0.573) | TCGA-GM-A3NW-01 | Breast | breast invasive carcinoma | Female | <65 | I/II | Chemotherapy | fluorouracil | SD |
| BNIPL | SNV | Missense_Mutation | rs371551535 | c.850C>T | p.Arg284Trp | p.R284W | Q7Z465 | protein_coding | deleterious(0) | probably_damaging(0.991) | TCGA-2W-A8YY-01 | Cervix | cervical & endocervical cancer | Female | <65 | I/II | Chemotherapy | cisplatin | CR |
| BNIPL | SNV | Missense_Mutation | novel | c.186N>C | p.Lys62Asn | p.K62N | Q7Z465 | protein_coding | tolerated(0.47) | benign(0.015) | TCGA-5M-AAT6-01 | Colorectum | colon adenocarcinoma | Female | <65 | III/IV | Unknown | Unknown | PD |
| BNIPL | SNV | Missense_Mutation | novel | c.871N>A | p.Ala291Thr | p.A291T | Q7Z465 | protein_coding | tolerated(0.05) | possibly_damaging(0.478) | TCGA-A6-2679-01 | Colorectum | colon adenocarcinoma | Female | >=65 | I/II | Unknown | Unknown | SD |
| BNIPL | SNV | Missense_Mutation | rs371326091 | c.257N>A | p.Arg86His | p.R86H | Q7Z465 | protein_coding | deleterious(0) | probably_damaging(0.95) | TCGA-AA-A01R-01 | Colorectum | colon adenocarcinoma | Male | <65 | III/IV | Chemotherapy | 5-fluorouracil | PD |
| BNIPL | SNV | Missense_Mutation | rs764413830 | c.856C>T | p.Arg286Trp | p.R286W | Q7Z465 | protein_coding | deleterious(0) | possibly_damaging(0.832) | TCGA-CM-6165-01 | Colorectum | colon adenocarcinoma | Male | >=65 | I/II | Unknown | Unknown | SD |
| BNIPL | SNV | Missense_Mutation | rs587607488 | c.373N>A | p.Glu125Lys | p.E125K | Q7Z465 | protein_coding | deleterious(0.02) | benign(0.393) | TCGA-EI-6917-01 | Colorectum | rectum adenocarcinoma | Male | <65 | III/IV | Chemotherapy | 5fluorouracil+oxaciplatina+l-folinian | SD |
| Page: 1 2 3 4 |
Top |
Related drugs of malignant transformation related genes |
| Identification of chemicals and drugs interact with genes involved in malignant transfromation |
| (DGIdb 4.0) |
| Entrez ID | Symbol | Category | Interaction Types | Drug Claim Name | Drug Name | PMIDs |
| Page: 1 |

Copyright 2023-Present -The University of Texas Health Science Center at Houston |