
|
|||||
|
 | |
| |
| |
| |
| |
| |
|
Gene: BNIP3L |
Gene summary for BNIP3L |
| Gene information | Species | Human | Gene symbol | BNIP3L | Gene ID | 665 |
| Gene name | BCL2 interacting protein 3 like | |
| Gene Alias | BNIP3a | |
| Cytomap | 8p21.2 | |
| Gene Type | protein-coding | GO ID | GO:0000422 | UniProtAcc | O60238 |
Top |
Malignant transformation analysis |
| Identification of the aberrant gene expression in precancerous and cancerous lesions by comparing the gene expression of stem-like cells in diseased tissues with normal stem cells |
| Entrez ID | Symbol | Replicates | Species | Organ | Tissue | Adj P-value | Log2FC | Malignancy |
| 665 | BNIP3L | GSM4909286 | Human | Breast | IDC | 1.07e-07 | -2.72e-01 | 0.1081 |
| 665 | BNIP3L | GSM4909287 | Human | Breast | IDC | 2.83e-09 | -3.35e-01 | 0.2057 |
| 665 | BNIP3L | GSM4909291 | Human | Breast | IDC | 6.78e-05 | -3.31e-01 | 0.1753 |
| 665 | BNIP3L | GSM4909296 | Human | Breast | IDC | 6.98e-13 | -3.08e-01 | 0.1524 |
| 665 | BNIP3L | GSM4909297 | Human | Breast | IDC | 3.80e-13 | -3.28e-01 | 0.1517 |
| 665 | BNIP3L | GSM4909304 | Human | Breast | IDC | 9.96e-04 | -2.79e-01 | 0.1636 |
| 665 | BNIP3L | GSM4909309 | Human | Breast | IDC | 2.77e-05 | -2.90e-01 | 0.0483 |
| 665 | BNIP3L | GSM4909311 | Human | Breast | IDC | 2.20e-18 | -3.67e-01 | 0.1534 |
| 665 | BNIP3L | GSM4909312 | Human | Breast | IDC | 1.32e-13 | -3.03e-01 | 0.1552 |
| 665 | BNIP3L | GSM4909315 | Human | Breast | IDC | 3.26e-02 | 3.06e-01 | 0.21 |
| 665 | BNIP3L | GSM4909319 | Human | Breast | IDC | 1.63e-27 | -4.64e-01 | 0.1563 |
| 665 | BNIP3L | GSM4909320 | Human | Breast | IDC | 6.02e-07 | -3.56e-01 | 0.1575 |
| 665 | BNIP3L | GSM4909321 | Human | Breast | IDC | 2.73e-13 | -2.86e-01 | 0.1559 |
| 665 | BNIP3L | ctrl6 | Human | Breast | Precancer | 3.83e-26 | 8.96e-01 | -0.0061 |
| 665 | BNIP3L | brca3 | Human | Breast | Precancer | 3.49e-12 | 4.87e-01 | -0.0263 |
| 665 | BNIP3L | brca7 | Human | Breast | Precancer | 2.29e-05 | 7.43e-01 | -0.009 |
| 665 | BNIP3L | brca10 | Human | Breast | Precancer | 1.84e-24 | 7.52e-01 | -0.0029 |
| 665 | BNIP3L | M2 | Human | Breast | IDC | 8.28e-04 | -4.40e-01 | 0.21 |
| 665 | BNIP3L | NCCBC14 | Human | Breast | DCIS | 6.77e-09 | 9.17e-02 | 0.2021 |
| 665 | BNIP3L | NCCBC5 | Human | Breast | DCIS | 7.90e-16 | -1.77e-01 | 0.2046 |
| Page: 1 2 3 4 5 6 7 8 |
| Tissue | Expression Dynamics | Abbreviation |
| Breast | 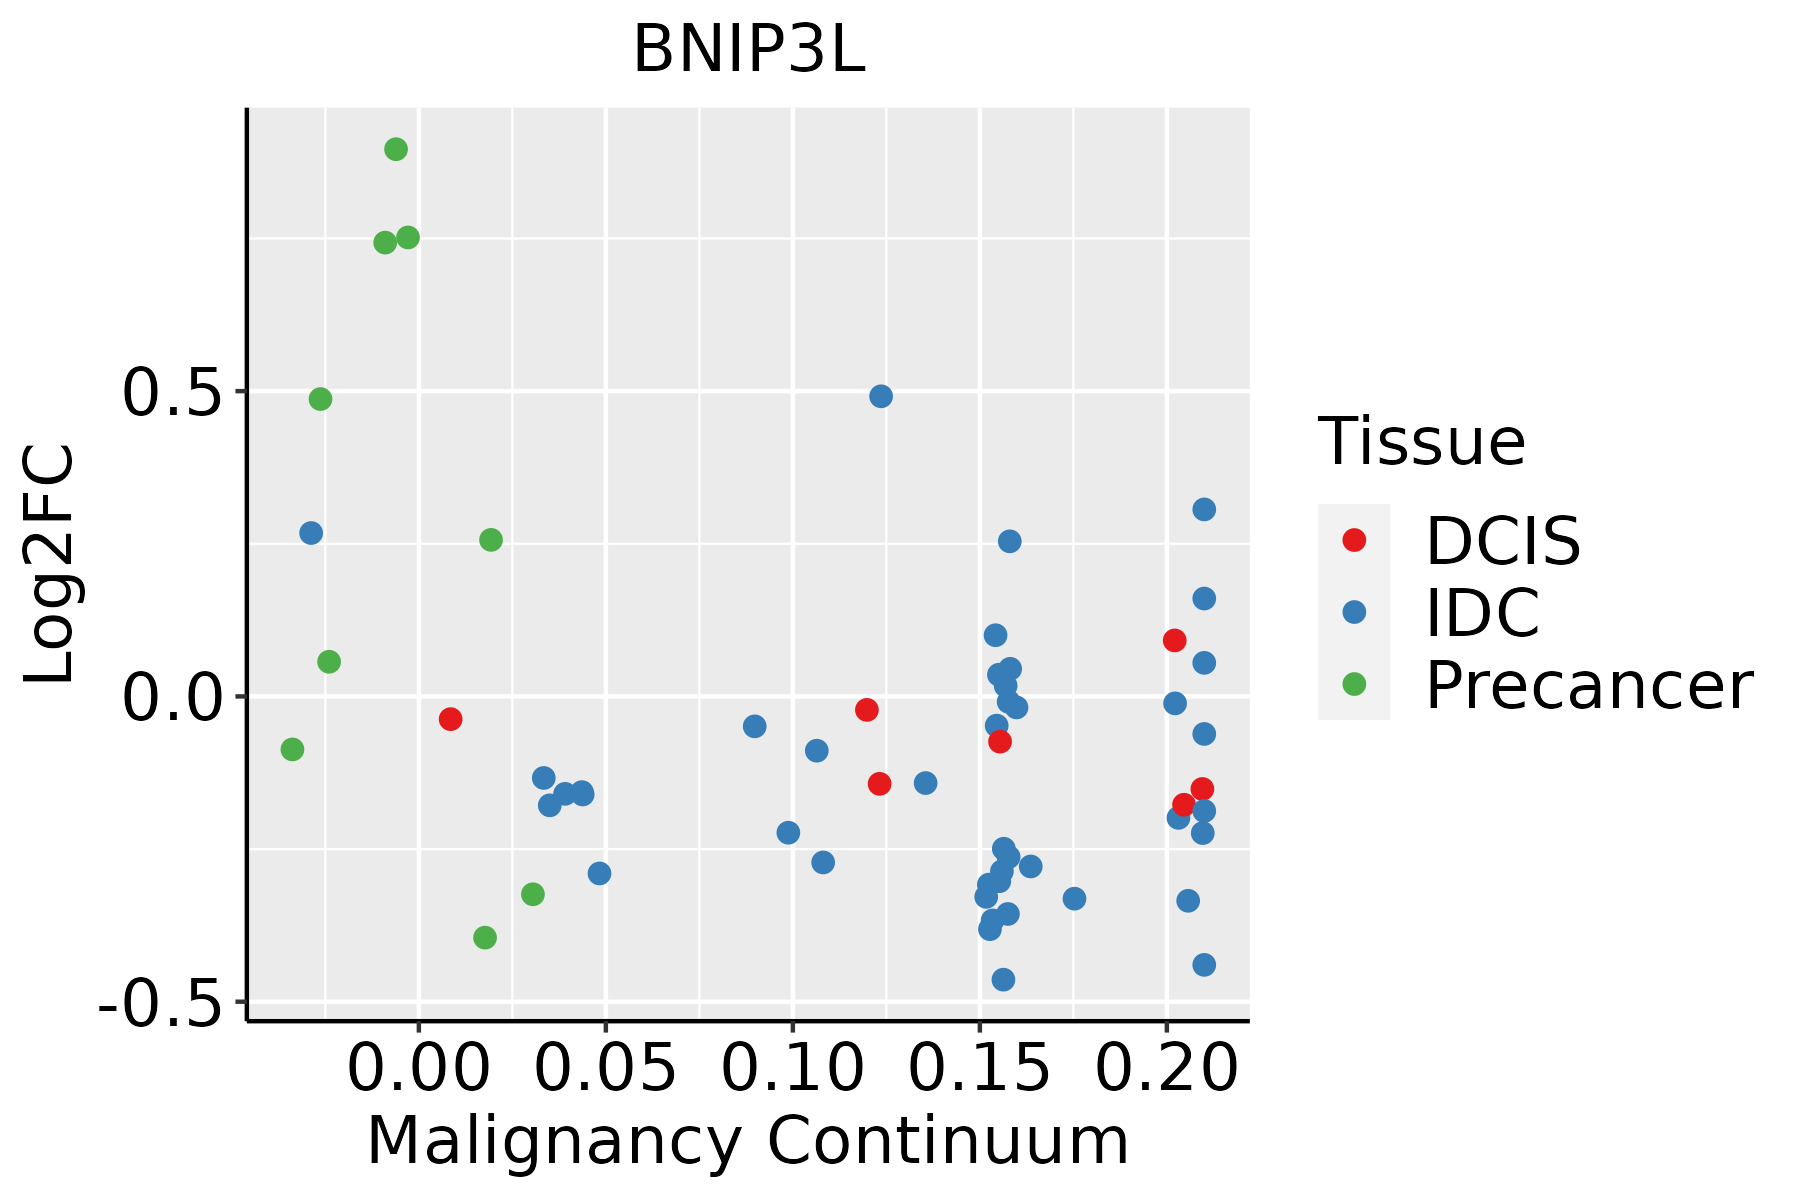 | IDC: Invasive ductal carcinoma |
| DCIS: Ductal carcinoma in situ | ||
| Precancer(BRCA1-mut): Precancerous lesion from BRCA1 mutation carriers | ||
| Endometrium | 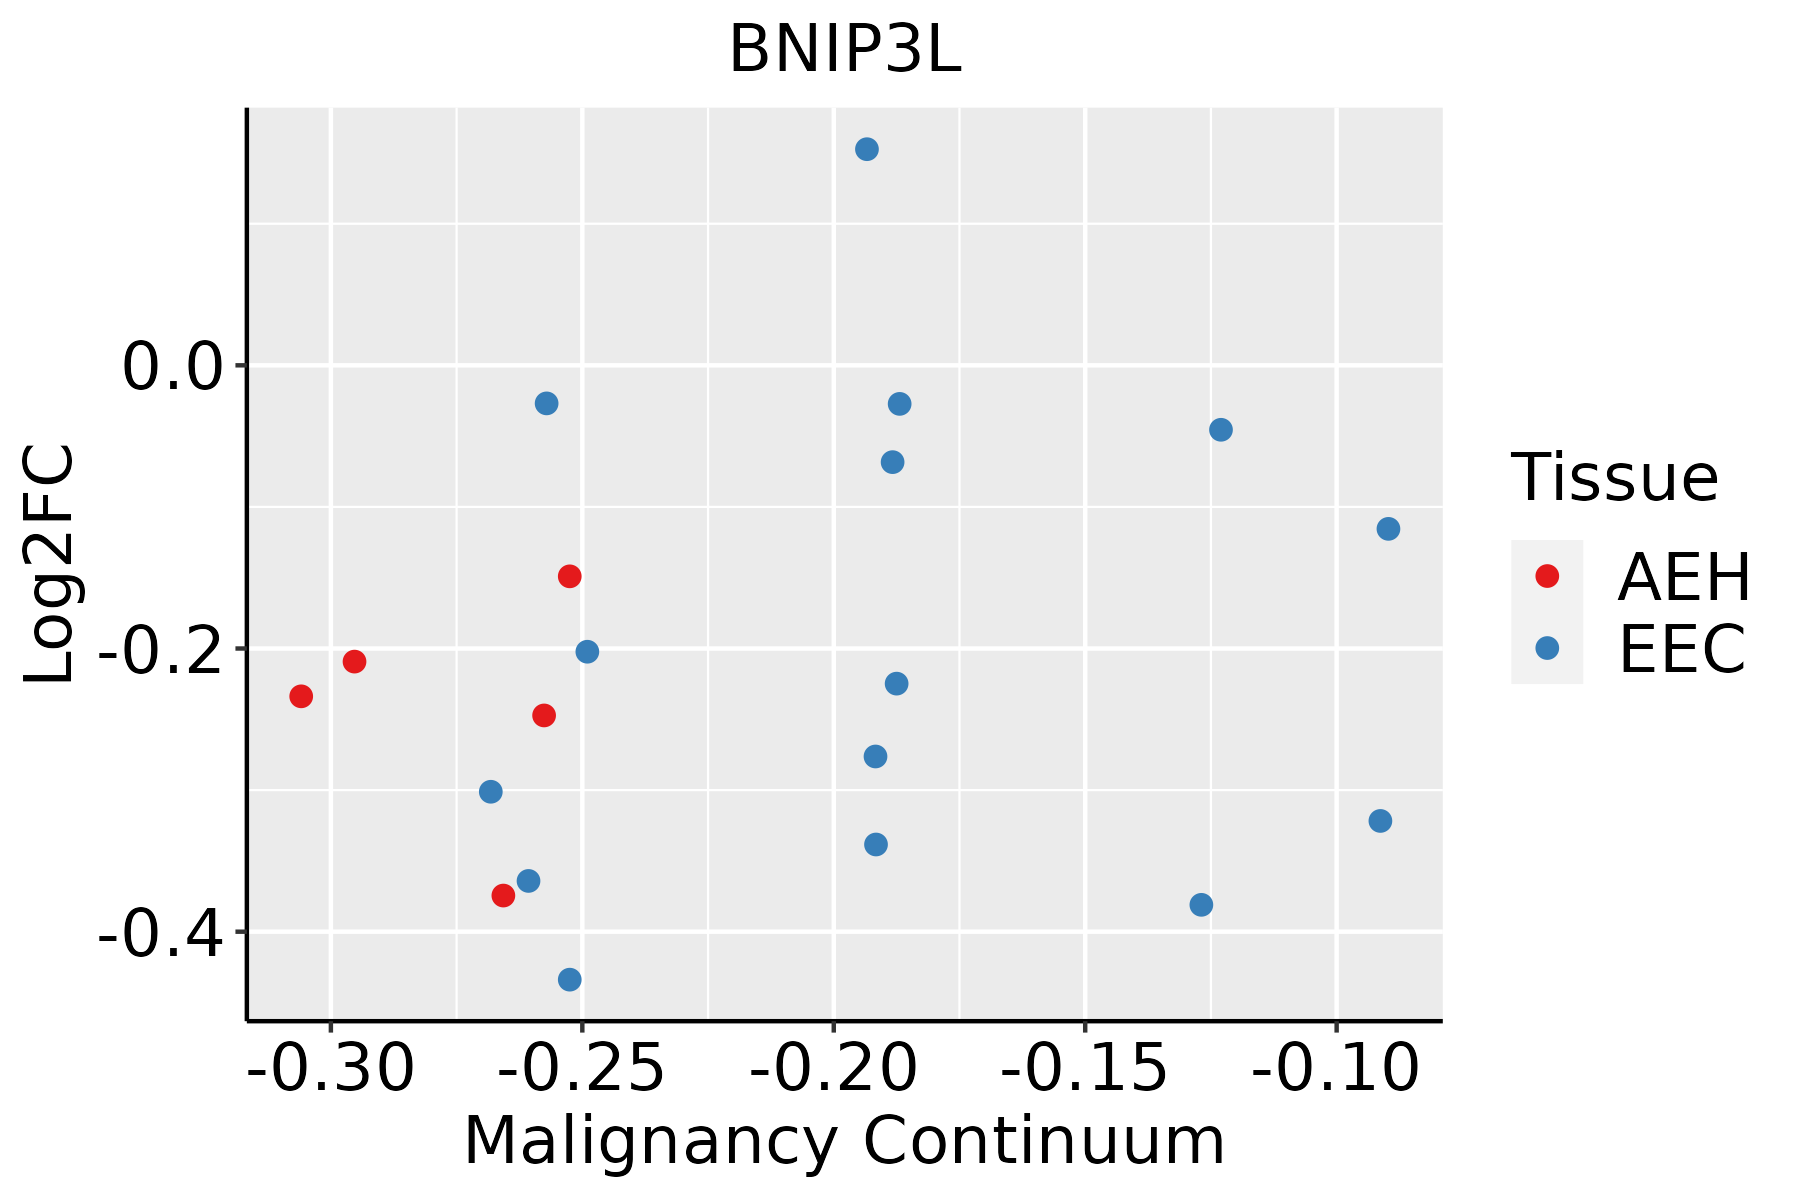 | AEH: Atypical endometrial hyperplasia |
| EEC: Endometrioid Cancer | ||
| Esophagus |  | ESCC: Esophageal squamous cell carcinoma |
| HGIN: High-grade intraepithelial neoplasias | ||
| LGIN: Low-grade intraepithelial neoplasias | ||
| Liver | 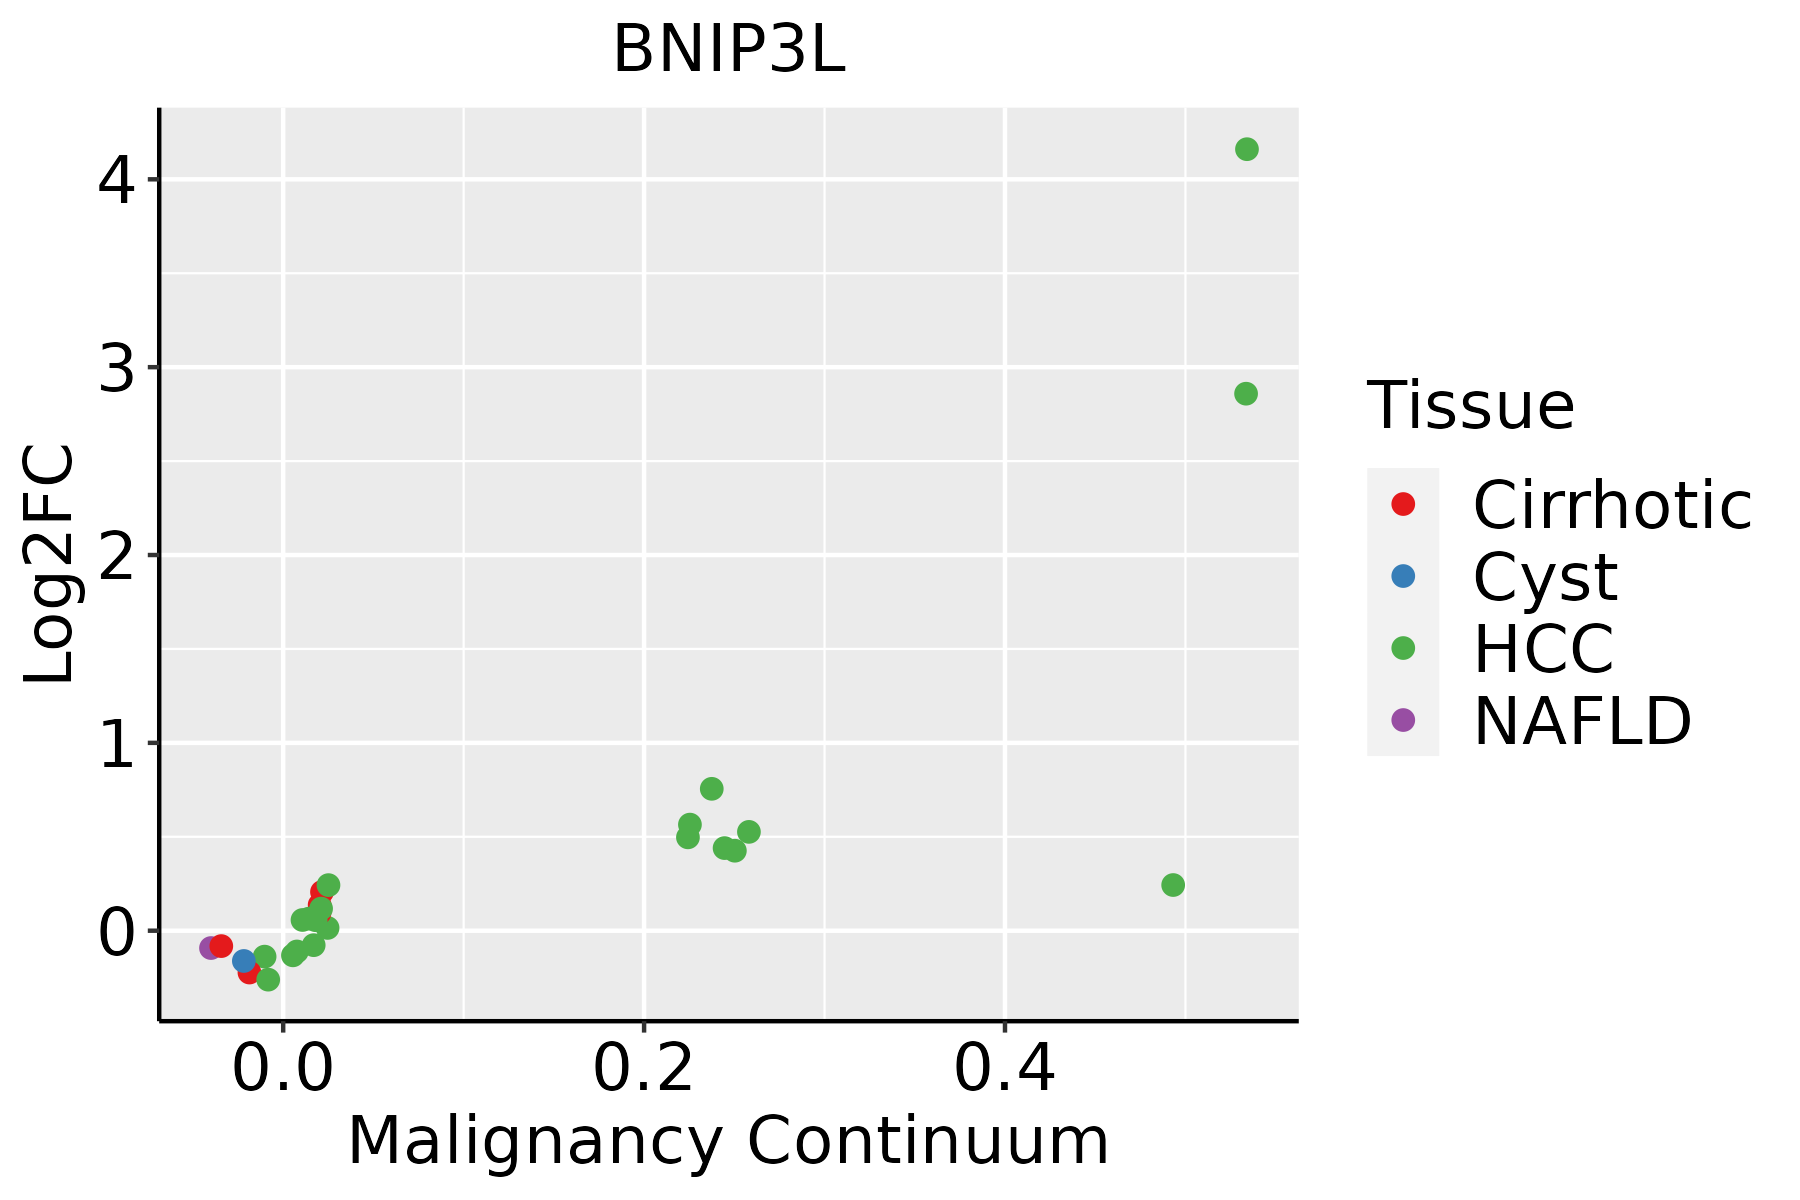 | HCC: Hepatocellular carcinoma |
| NAFLD: Non-alcoholic fatty liver disease | ||
| Oral Cavity |  | EOLP: Erosive Oral lichen planus |
| LP: leukoplakia | ||
| NEOLP: Non-erosive oral lichen planus | ||
| OSCC: Oral squamous cell carcinoma | ||
| Prostate | 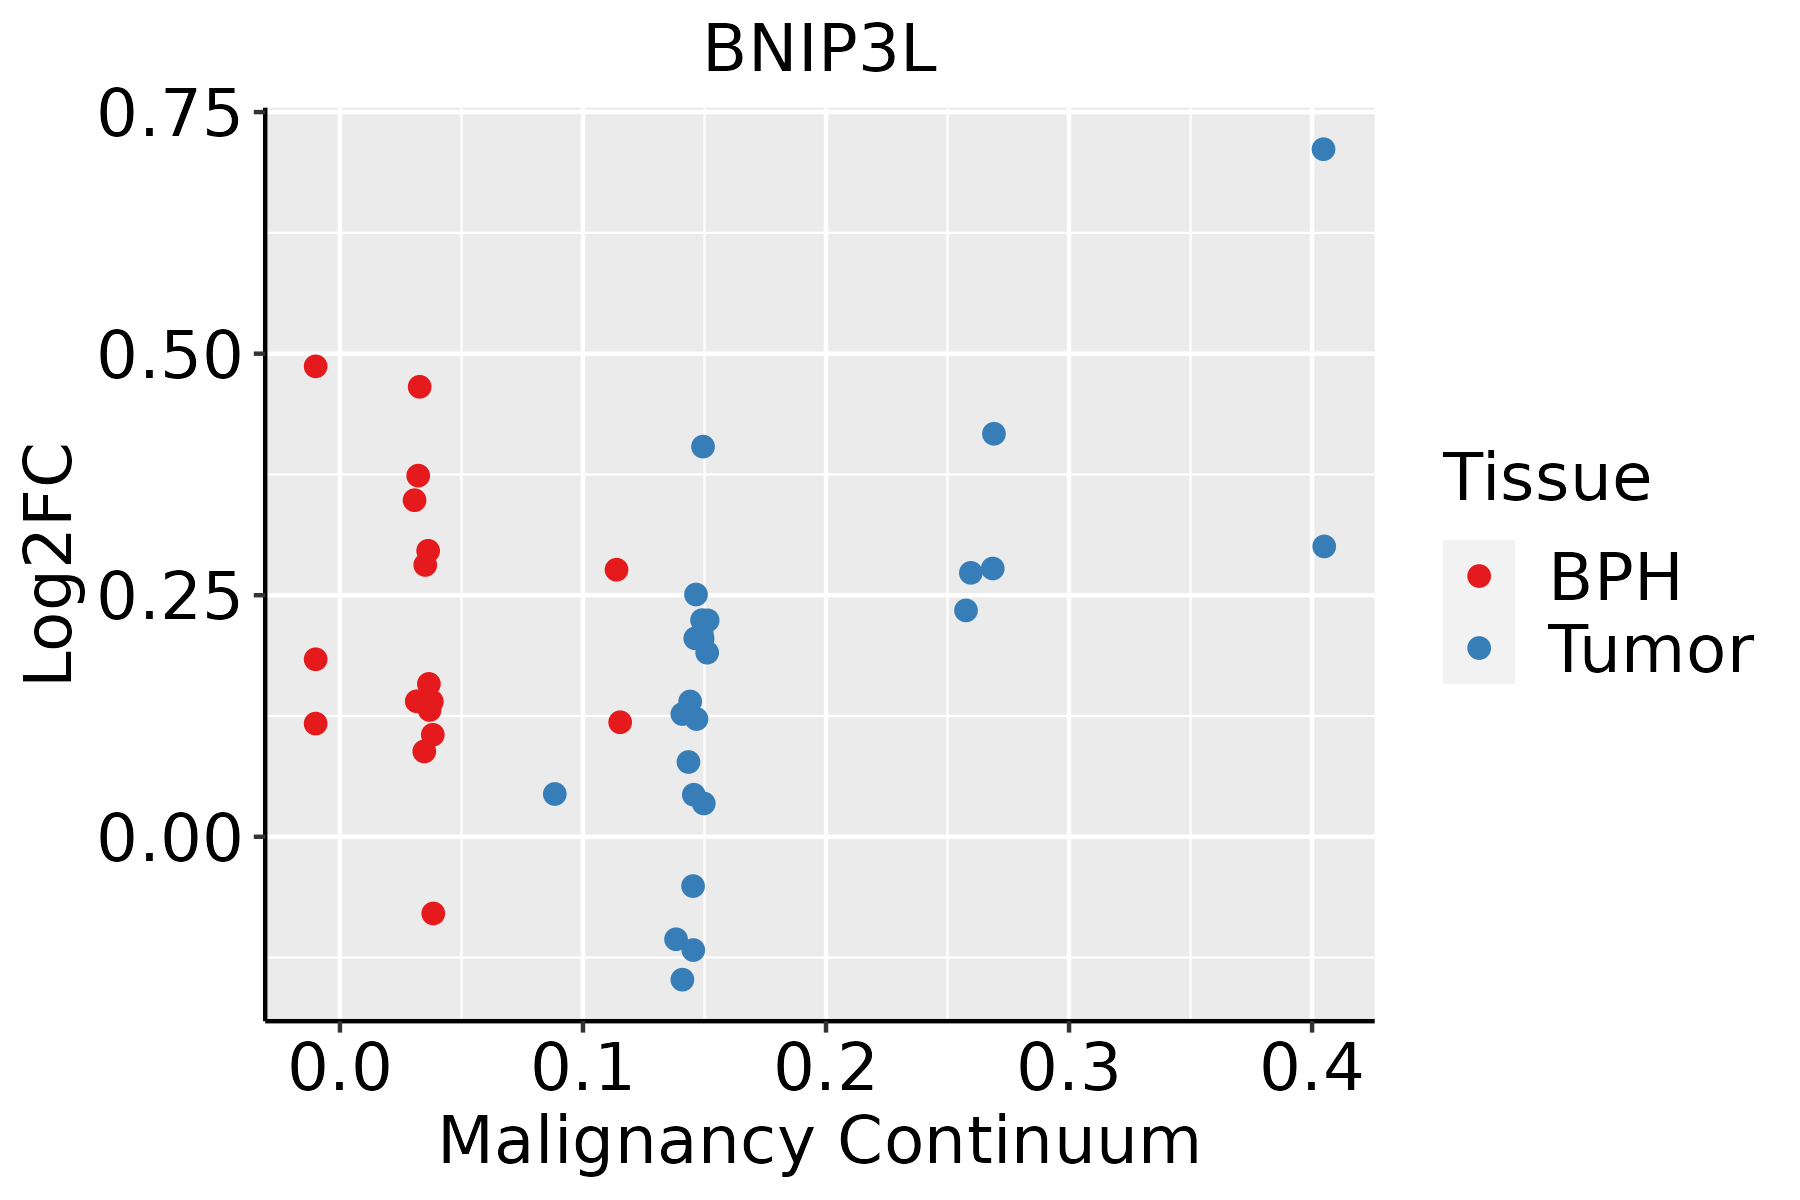 | BPH: Benign Prostatic Hyperplasia |
| Skin |  | AK: Actinic keratosis |
| cSCC: Cutaneous squamous cell carcinoma | ||
| SCCIS:squamous cell carcinoma in situ | ||
| Thyroid | 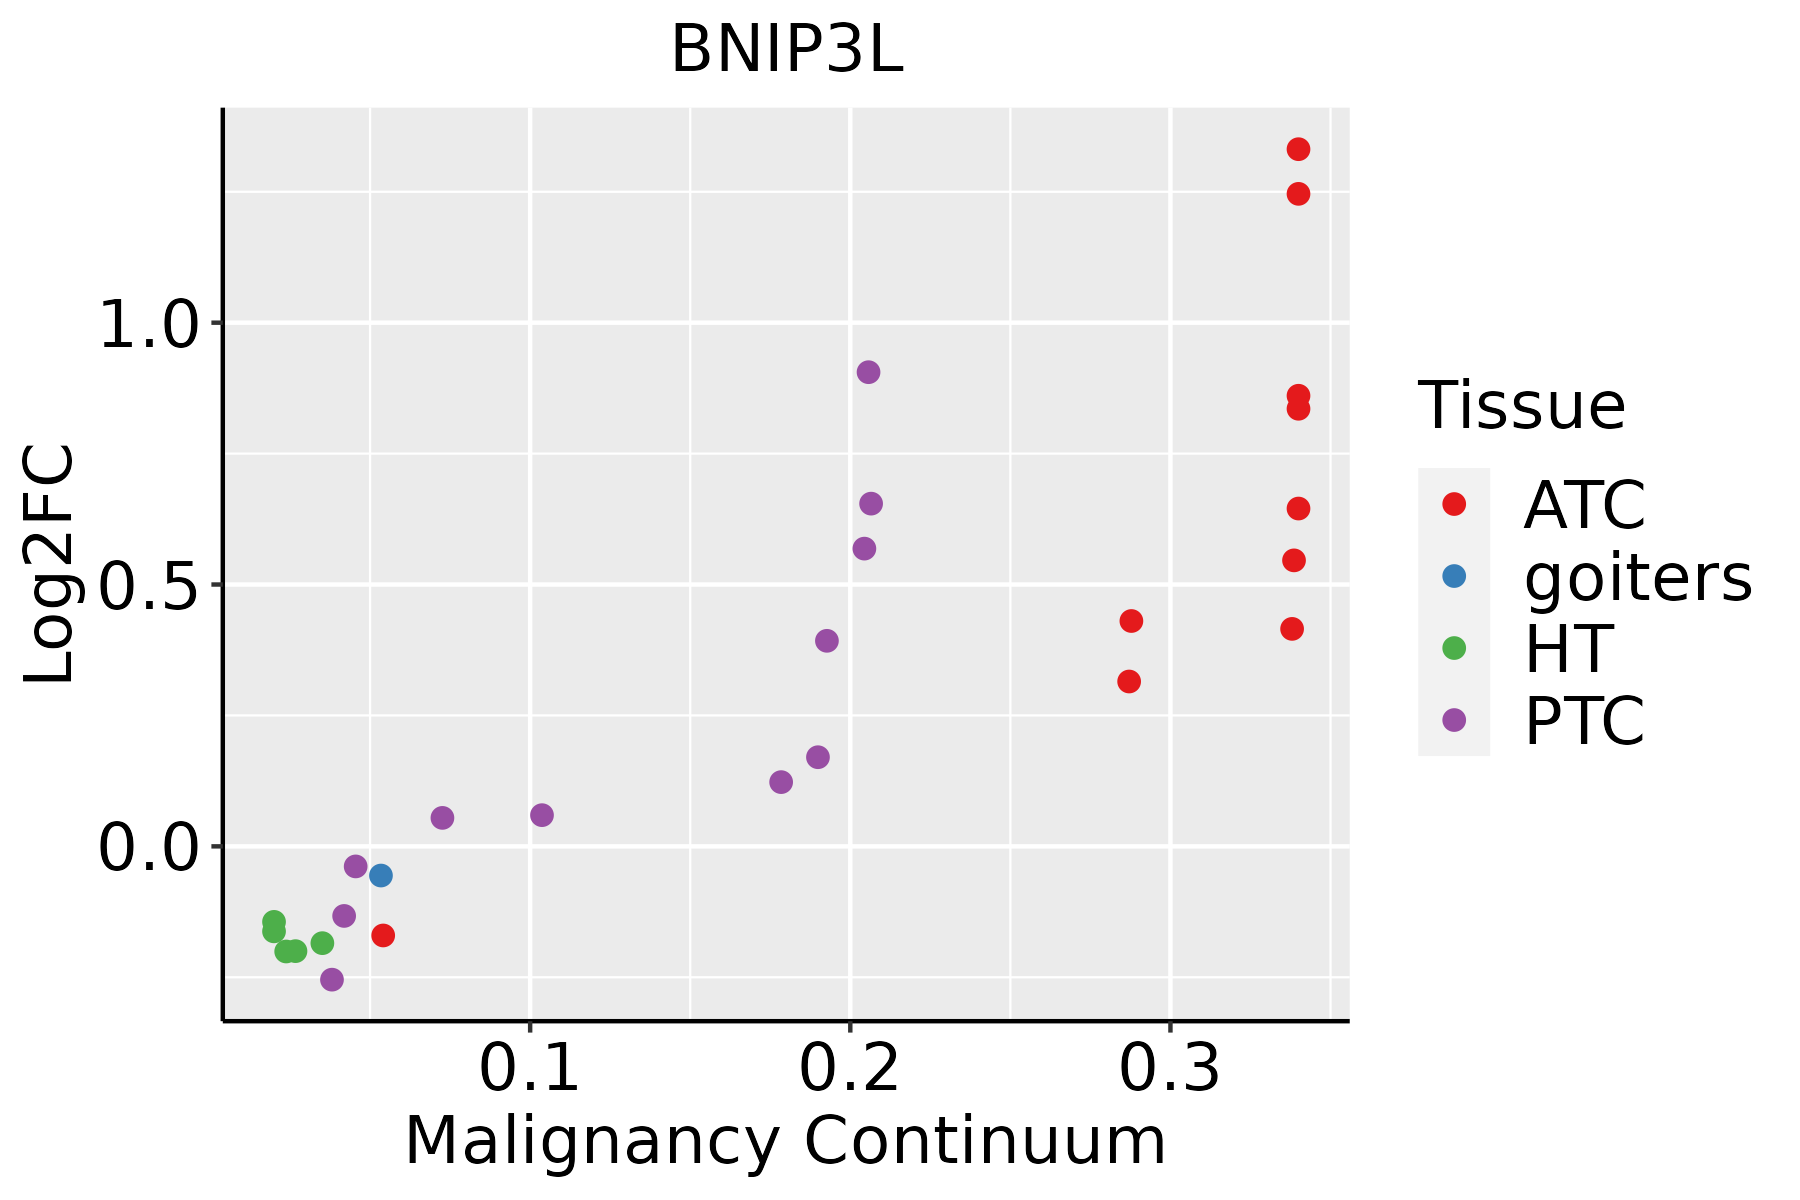 | ATC: Anaplastic thyroid cancer |
| HT: Hashimoto's thyroiditis | ||
| PTC: Papillary thyroid cancer |
| ∗log2FC in expression of this searched gene in stem-like cells from each diseased tissue sample relative to stem-like cells in normal samples in each tissue plotted against the malignancy continuum. Samples are colored based on if they are from different disease stage. |
Top |
Malignant transformation related pathway analysis |
| Find out the enriched GO biological processes and KEGG pathways involved in transition from healthy to precancer to cancer |
| Tissue | Disease Stage | Enriched GO biological Processes |
| Colorectum | AD |  |
| Colorectum | SER |  |
| Colorectum | MSS |  |
| Colorectum | MSI-H |  |
| Colorectum | FAP |  |
| ∗Top 15 enriched GO BP terms are showed in the bar plot of each disease state in each tissue. Each row represents a significant GO biological process which is colored according to the -log10(p.adjust). |
| Page: 1 2 3 4 5 6 7 8 9 |
| GO ID | Tissue | Disease Stage | Description | Gene Ratio | Bg Ratio | pvalue | p.adjust | Count |
| GO:00362939 | Breast | Precancer | response to decreased oxygen levels | 53/1080 | 322/18723 | 4.09e-12 | 6.84e-10 | 53 |
| GO:00016669 | Breast | Precancer | response to hypoxia | 51/1080 | 307/18723 | 7.33e-12 | 1.11e-09 | 51 |
| GO:00704829 | Breast | Precancer | response to oxygen levels | 55/1080 | 347/18723 | 7.47e-12 | 1.11e-09 | 55 |
| GO:00068398 | Breast | Precancer | mitochondrial transport | 45/1080 | 254/18723 | 1.37e-11 | 1.88e-09 | 45 |
| GO:00362948 | Breast | Precancer | cellular response to decreased oxygen levels | 31/1080 | 161/18723 | 2.61e-09 | 2.11e-07 | 31 |
| GO:00714538 | Breast | Precancer | cellular response to oxygen levels | 32/1080 | 177/18723 | 7.32e-09 | 5.52e-07 | 32 |
| GO:00714565 | Breast | Precancer | cellular response to hypoxia | 29/1080 | 151/18723 | 8.98e-09 | 6.50e-07 | 29 |
| GO:00086378 | Breast | Precancer | apoptotic mitochondrial changes | 23/1080 | 107/18723 | 3.44e-08 | 2.12e-06 | 23 |
| GO:00518816 | Breast | Precancer | regulation of mitochondrial membrane potential | 18/1080 | 74/18723 | 1.45e-07 | 7.82e-06 | 18 |
| GO:00705858 | Breast | Precancer | protein localization to mitochondrion | 21/1080 | 125/18723 | 9.07e-06 | 2.42e-04 | 21 |
| GO:00070066 | Breast | Precancer | mitochondrial membrane organization | 20/1080 | 116/18723 | 9.88e-06 | 2.61e-04 | 20 |
| GO:00726558 | Breast | Precancer | establishment of protein localization to mitochondrion | 20/1080 | 120/18723 | 1.66e-05 | 4.03e-04 | 20 |
| GO:00905595 | Breast | Precancer | regulation of membrane permeability | 15/1080 | 78/18723 | 3.35e-05 | 7.29e-04 | 15 |
| GO:0010917 | Breast | Precancer | negative regulation of mitochondrial membrane potential | 6/1080 | 13/18723 | 4.39e-05 | 9.40e-04 | 6 |
| GO:00469025 | Breast | Precancer | regulation of mitochondrial membrane permeability | 13/1080 | 63/18723 | 5.13e-05 | 1.07e-03 | 13 |
| GO:0045837 | Breast | Precancer | negative regulation of membrane potential | 6/1080 | 14/18723 | 7.30e-05 | 1.44e-03 | 6 |
| GO:00004226 | Breast | Precancer | autophagy of mitochondrion | 14/1080 | 81/18723 | 2.01e-04 | 3.16e-03 | 14 |
| GO:00617266 | Breast | Precancer | mitochondrion disassembly | 14/1080 | 81/18723 | 2.01e-04 | 3.16e-03 | 14 |
| GO:00098969 | Breast | Precancer | positive regulation of catabolic process | 48/1080 | 492/18723 | 2.62e-04 | 3.84e-03 | 48 |
| GO:00313319 | Breast | Precancer | positive regulation of cellular catabolic process | 43/1080 | 427/18723 | 2.75e-04 | 4.00e-03 | 43 |
| Page: 1 2 3 4 5 6 7 8 9 10 11 12 13 14 15 16 17 18 19 20 21 22 23 24 25 26 27 28 29 30 31 32 33 |
| Pathway ID | Tissue | Disease Stage | Description | Gene Ratio | Bg Ratio | pvalue | p.adjust | qvalue | Count |
| hsa0413716 | Breast | Precancer | Mitophagy - animal | 15/684 | 72/8465 | 5.22e-04 | 3.93e-03 | 3.01e-03 | 15 |
| hsa0413717 | Breast | Precancer | Mitophagy - animal | 15/684 | 72/8465 | 5.22e-04 | 3.93e-03 | 3.01e-03 | 15 |
| hsa0413723 | Breast | IDC | Mitophagy - animal | 17/867 | 72/8465 | 7.61e-04 | 6.04e-03 | 4.52e-03 | 17 |
| hsa0413733 | Breast | IDC | Mitophagy - animal | 17/867 | 72/8465 | 7.61e-04 | 6.04e-03 | 4.52e-03 | 17 |
| hsa0413742 | Breast | DCIS | Mitophagy - animal | 17/846 | 72/8465 | 5.75e-04 | 4.42e-03 | 3.26e-03 | 17 |
| hsa0413752 | Breast | DCIS | Mitophagy - animal | 17/846 | 72/8465 | 5.75e-04 | 4.42e-03 | 3.26e-03 | 17 |
| hsa0413720 | Endometrium | AEH | Mitophagy - animal | 21/1197 | 72/8465 | 7.03e-04 | 4.86e-03 | 3.56e-03 | 21 |
| hsa04137110 | Endometrium | AEH | Mitophagy - animal | 21/1197 | 72/8465 | 7.03e-04 | 4.86e-03 | 3.56e-03 | 21 |
| hsa0413725 | Endometrium | EEC | Mitophagy - animal | 22/1237 | 72/8465 | 4.12e-04 | 3.30e-03 | 2.46e-03 | 22 |
| hsa0413735 | Endometrium | EEC | Mitophagy - animal | 22/1237 | 72/8465 | 4.12e-04 | 3.30e-03 | 2.46e-03 | 22 |
| hsa04137210 | Esophagus | ESCC | Mitophagy - animal | 54/4205 | 72/8465 | 9.33e-06 | 4.96e-05 | 2.54e-05 | 54 |
| hsa0413738 | Esophagus | ESCC | Mitophagy - animal | 54/4205 | 72/8465 | 9.33e-06 | 4.96e-05 | 2.54e-05 | 54 |
| hsa0413721 | Liver | Cirrhotic | Mitophagy - animal | 39/2530 | 72/8465 | 1.38e-05 | 1.24e-04 | 7.64e-05 | 39 |
| hsa0413731 | Liver | Cirrhotic | Mitophagy - animal | 39/2530 | 72/8465 | 1.38e-05 | 1.24e-04 | 7.64e-05 | 39 |
| hsa0413741 | Liver | HCC | Mitophagy - animal | 53/4020 | 72/8465 | 5.49e-06 | 4.59e-05 | 2.56e-05 | 53 |
| hsa0413751 | Liver | HCC | Mitophagy - animal | 53/4020 | 72/8465 | 5.49e-06 | 4.59e-05 | 2.56e-05 | 53 |
| hsa0413728 | Oral cavity | OSCC | Mitophagy - animal | 58/3704 | 72/8465 | 1.48e-10 | 2.07e-09 | 1.05e-09 | 58 |
| hsa04137112 | Oral cavity | OSCC | Mitophagy - animal | 58/3704 | 72/8465 | 1.48e-10 | 2.07e-09 | 1.05e-09 | 58 |
| hsa0413743 | Oral cavity | EOLP | Mitophagy - animal | 25/1218 | 72/8465 | 1.18e-05 | 6.69e-05 | 3.95e-05 | 25 |
| hsa0413753 | Oral cavity | EOLP | Mitophagy - animal | 25/1218 | 72/8465 | 1.18e-05 | 6.69e-05 | 3.95e-05 | 25 |
| Page: 1 2 |
Top |
Cell-cell communication analysis |
| Identification of potential cell-cell interactions between two cell types and their ligand-receptor pairs for different disease states |
| Ligand | Receptor | LRpair | Pathway | Tissue | Disease Stage |
| Page: 1 |
Top |
Single-cell gene regulatory network inference analysis |
| Find out the significant the regulons (TFs) and the target genes of each regulon across cell types for different disease states |
| TF | Cell Type | Tissue | Disease Stage | Target Gene | RSS | Regulon Activity |
| ∗The dot plots of a searched regulon are shown for all cell subpopulations in each disease state of each tissue based on the regulon specific score inferred using pySCENIC and by calculating the average expression. |
| Page: 1 |
Top |
Somatic mutation of malignant transformation related genes |
| Annotation of somatic variants for genes involved in malignant transformation |
| Hugo Symbol | Variant Class | Variant Classification | dbSNP RS | HGVSc | HGVSp | HGVSp Short | SWISSPROT | BIOTYPE | SIFT | PolyPhen | Tumor Sample Barcode | Tissue | Histology | Sex | Age | Stage | Therapy Types | Drugs | Outcome |
| BNIP3L | SNV | Missense_Mutation | c.402N>T | p.Leu134Phe | p.L134F | O60238 | protein_coding | deleterious(0) | probably_damaging(0.919) | TCGA-B6-A0RE-01 | Breast | breast invasive carcinoma | Female | <65 | I/II | Unknown | Unknown | SD | |
| BNIP3L | SNV | Missense_Mutation | rs762423471 | c.403N>G | p.Lys135Glu | p.K135E | O60238 | protein_coding | deleterious(0.01) | possibly_damaging(0.652) | TCGA-B6-A0RE-01 | Breast | breast invasive carcinoma | Female | <65 | I/II | Unknown | Unknown | SD |
| BNIP3L | insertion | Frame_Shift_Ins | novel | c.551_552insTTGGTATCTTTTCTGTCTAGATTTTTCTTTGT | p.Glu184AspfsTer14 | p.E184Dfs*14 | O60238 | protein_coding | TCGA-A8-A09D-01 | Breast | breast invasive carcinoma | Female | <65 | I/II | Chemotherapy | doxorubicin | CR | ||
| BNIP3L | SNV | Missense_Mutation | rs747118549 | c.394G>A | p.Glu132Lys | p.E132K | O60238 | protein_coding | deleterious(0.02) | benign(0.114) | TCGA-AA-A00N-01 | Colorectum | colon adenocarcinoma | Male | >=65 | I/II | Unknown | Unknown | PD |
| BNIP3L | SNV | Missense_Mutation | c.287N>A | p.Pro96His | p.P96H | O60238 | protein_coding | tolerated(0.07) | probably_damaging(0.987) | TCGA-AA-A01R-01 | Colorectum | colon adenocarcinoma | Male | <65 | III/IV | Chemotherapy | 5-fluorouracil | PD | |
| BNIP3L | SNV | Missense_Mutation | novel | c.556N>A | p.Leu186Met | p.L186M | O60238 | protein_coding | deleterious(0.04) | probably_damaging(0.985) | TCGA-CA-6717-01 | Colorectum | colon adenocarcinoma | Male | <65 | I/II | Chemotherapy | oxaliplatin | CR |
| BNIP3L | SNV | Missense_Mutation | c.223N>A | p.Leu75Ile | p.L75I | O60238 | protein_coding | deleterious(0) | possibly_damaging(0.793) | TCGA-CA-6718-01 | Colorectum | colon adenocarcinoma | Male | <65 | I/II | Unknown | Unknown | PD | |
| BNIP3L | SNV | Missense_Mutation | c.445G>A | p.Glu149Lys | p.E149K | O60238 | protein_coding | deleterious(0.02) | probably_damaging(0.996) | TCGA-EI-6917-01 | Colorectum | rectum adenocarcinoma | Male | <65 | III/IV | Chemotherapy | 5fluorouracil+oxaciplatina+l-folinian | SD | |
| BNIP3L | deletion | Frame_Shift_Del | novel | c.163delN | p.Leu57TrpfsTer69 | p.L57Wfs*69 | O60238 | protein_coding | TCGA-D5-6928-01 | Colorectum | colon adenocarcinoma | Male | >=65 | I/II | Unknown | Unknown | SD | ||
| BNIP3L | SNV | Missense_Mutation | rs773482295 | c.413C>T | p.Ala138Val | p.A138V | O60238 | protein_coding | tolerated(0.45) | benign(0.012) | TCGA-A5-A0G2-01 | Endometrium | uterine corpus endometrioid carcinoma | Female | <65 | III/IV | Unknown | Unknown | SD |
| Page: 1 2 |
Top |
Related drugs of malignant transformation related genes |
| Identification of chemicals and drugs interact with genes involved in malignant transfromation |
| (DGIdb 4.0) |
| Entrez ID | Symbol | Category | Interaction Types | Drug Claim Name | Drug Name | PMIDs |
| Page: 1 |

Copyright 2023-Present -The University of Texas Health Science Center at Houston |