
|
|||||
|
 | |
| |
| |
| |
| |
| |
|
Gene: BNIP3 |
Gene summary for BNIP3 |
| Gene information | Species | Human | Gene symbol | BNIP3 | Gene ID | 664 |
| Gene name | BCL2 interacting protein 3 | |
| Gene Alias | NIP3 | |
| Cytomap | 10q26.3 | |
| Gene Type | protein-coding | GO ID | GO:0000266 | UniProtAcc | Q12983 |
Top |
Malignant transformation analysis |
| Identification of the aberrant gene expression in precancerous and cancerous lesions by comparing the gene expression of stem-like cells in diseased tissues with normal stem cells |
| Entrez ID | Symbol | Replicates | Species | Organ | Tissue | Adj P-value | Log2FC | Malignancy |
| 664 | BNIP3 | GSM4909280 | Human | Breast | Precancer | 5.71e-03 | -4.33e-01 | 0.0305 |
| 664 | BNIP3 | GSM4909281 | Human | Breast | IDC | 1.04e-11 | 5.40e-01 | 0.21 |
| 664 | BNIP3 | GSM4909282 | Human | Breast | IDC | 2.61e-04 | -2.75e-01 | -0.0288 |
| 664 | BNIP3 | GSM4909286 | Human | Breast | IDC | 1.42e-03 | -1.74e-01 | 0.1081 |
| 664 | BNIP3 | GSM4909296 | Human | Breast | IDC | 5.16e-06 | -1.84e-01 | 0.1524 |
| 664 | BNIP3 | GSM4909297 | Human | Breast | IDC | 1.09e-06 | -2.11e-01 | 0.1517 |
| 664 | BNIP3 | GSM4909307 | Human | Breast | IDC | 7.16e-07 | -3.16e-01 | 0.1569 |
| 664 | BNIP3 | GSM4909308 | Human | Breast | IDC | 2.48e-09 | -3.54e-01 | 0.158 |
| 664 | BNIP3 | GSM4909309 | Human | Breast | IDC | 5.20e-06 | -3.07e-01 | 0.0483 |
| 664 | BNIP3 | GSM4909311 | Human | Breast | IDC | 2.78e-19 | -3.14e-01 | 0.1534 |
| 664 | BNIP3 | GSM4909312 | Human | Breast | IDC | 3.12e-04 | 4.48e-02 | 0.1552 |
| 664 | BNIP3 | GSM4909315 | Human | Breast | IDC | 1.56e-55 | 1.04e+00 | 0.21 |
| 664 | BNIP3 | GSM4909316 | Human | Breast | IDC | 1.06e-08 | 5.08e-01 | 0.21 |
| 664 | BNIP3 | GSM4909318 | Human | Breast | IDC | 2.83e-03 | 3.89e-01 | 0.2031 |
| 664 | BNIP3 | GSM4909319 | Human | Breast | IDC | 1.04e-21 | -3.17e-01 | 0.1563 |
| 664 | BNIP3 | GSM4909320 | Human | Breast | IDC | 4.52e-06 | -3.36e-01 | 0.1575 |
| 664 | BNIP3 | GSM4909321 | Human | Breast | IDC | 4.06e-05 | -5.19e-02 | 0.1559 |
| 664 | BNIP3 | ctrl6 | Human | Breast | Precancer | 3.31e-18 | 7.67e-01 | -0.0061 |
| 664 | BNIP3 | brca1 | Human | Breast | Precancer | 9.68e-03 | 2.94e-01 | -0.0338 |
| 664 | BNIP3 | brca3 | Human | Breast | Precancer | 9.82e-30 | 6.94e-01 | -0.0263 |
| Page: 1 2 3 4 5 6 7 8 |
| Tissue | Expression Dynamics | Abbreviation |
| Breast | 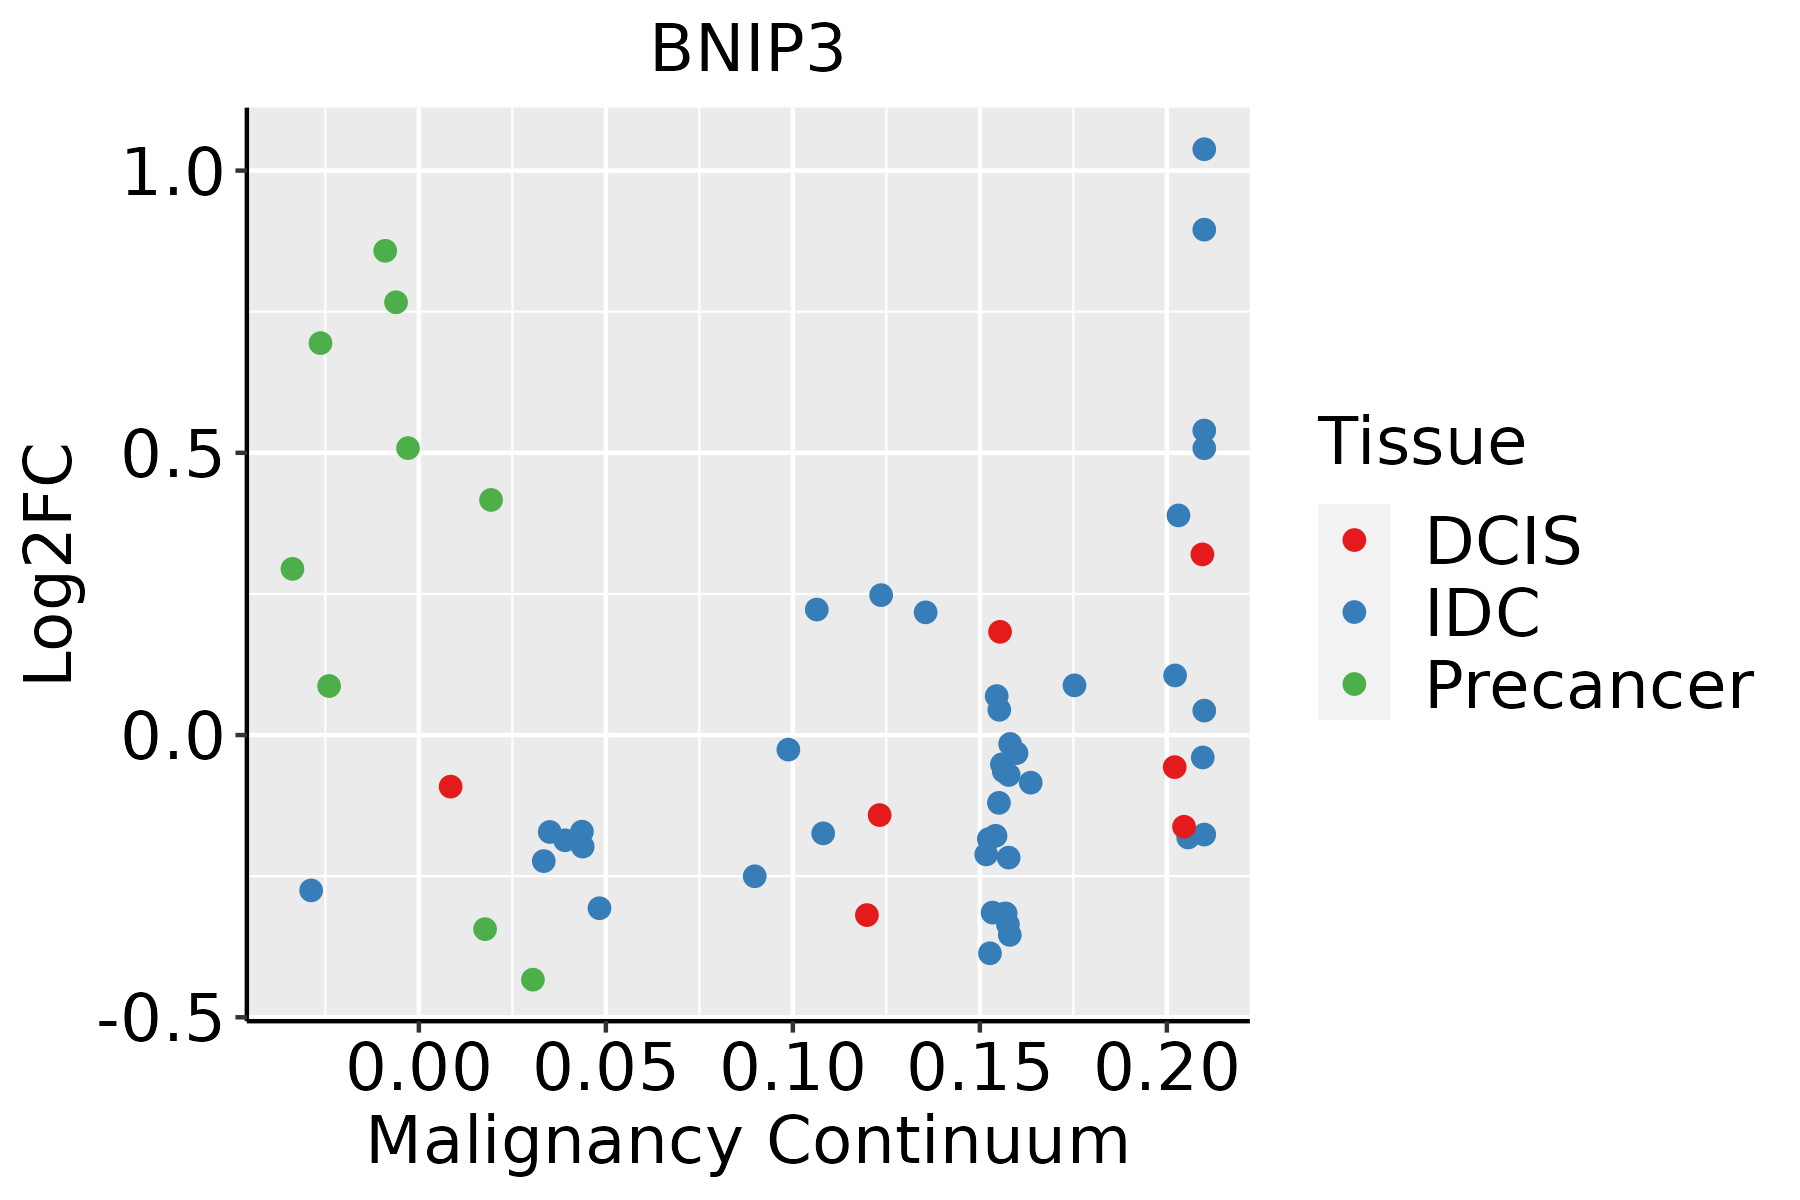 | IDC: Invasive ductal carcinoma |
| DCIS: Ductal carcinoma in situ | ||
| Precancer(BRCA1-mut): Precancerous lesion from BRCA1 mutation carriers | ||
| Endometrium |  | AEH: Atypical endometrial hyperplasia |
| EEC: Endometrioid Cancer | ||
| Esophagus | 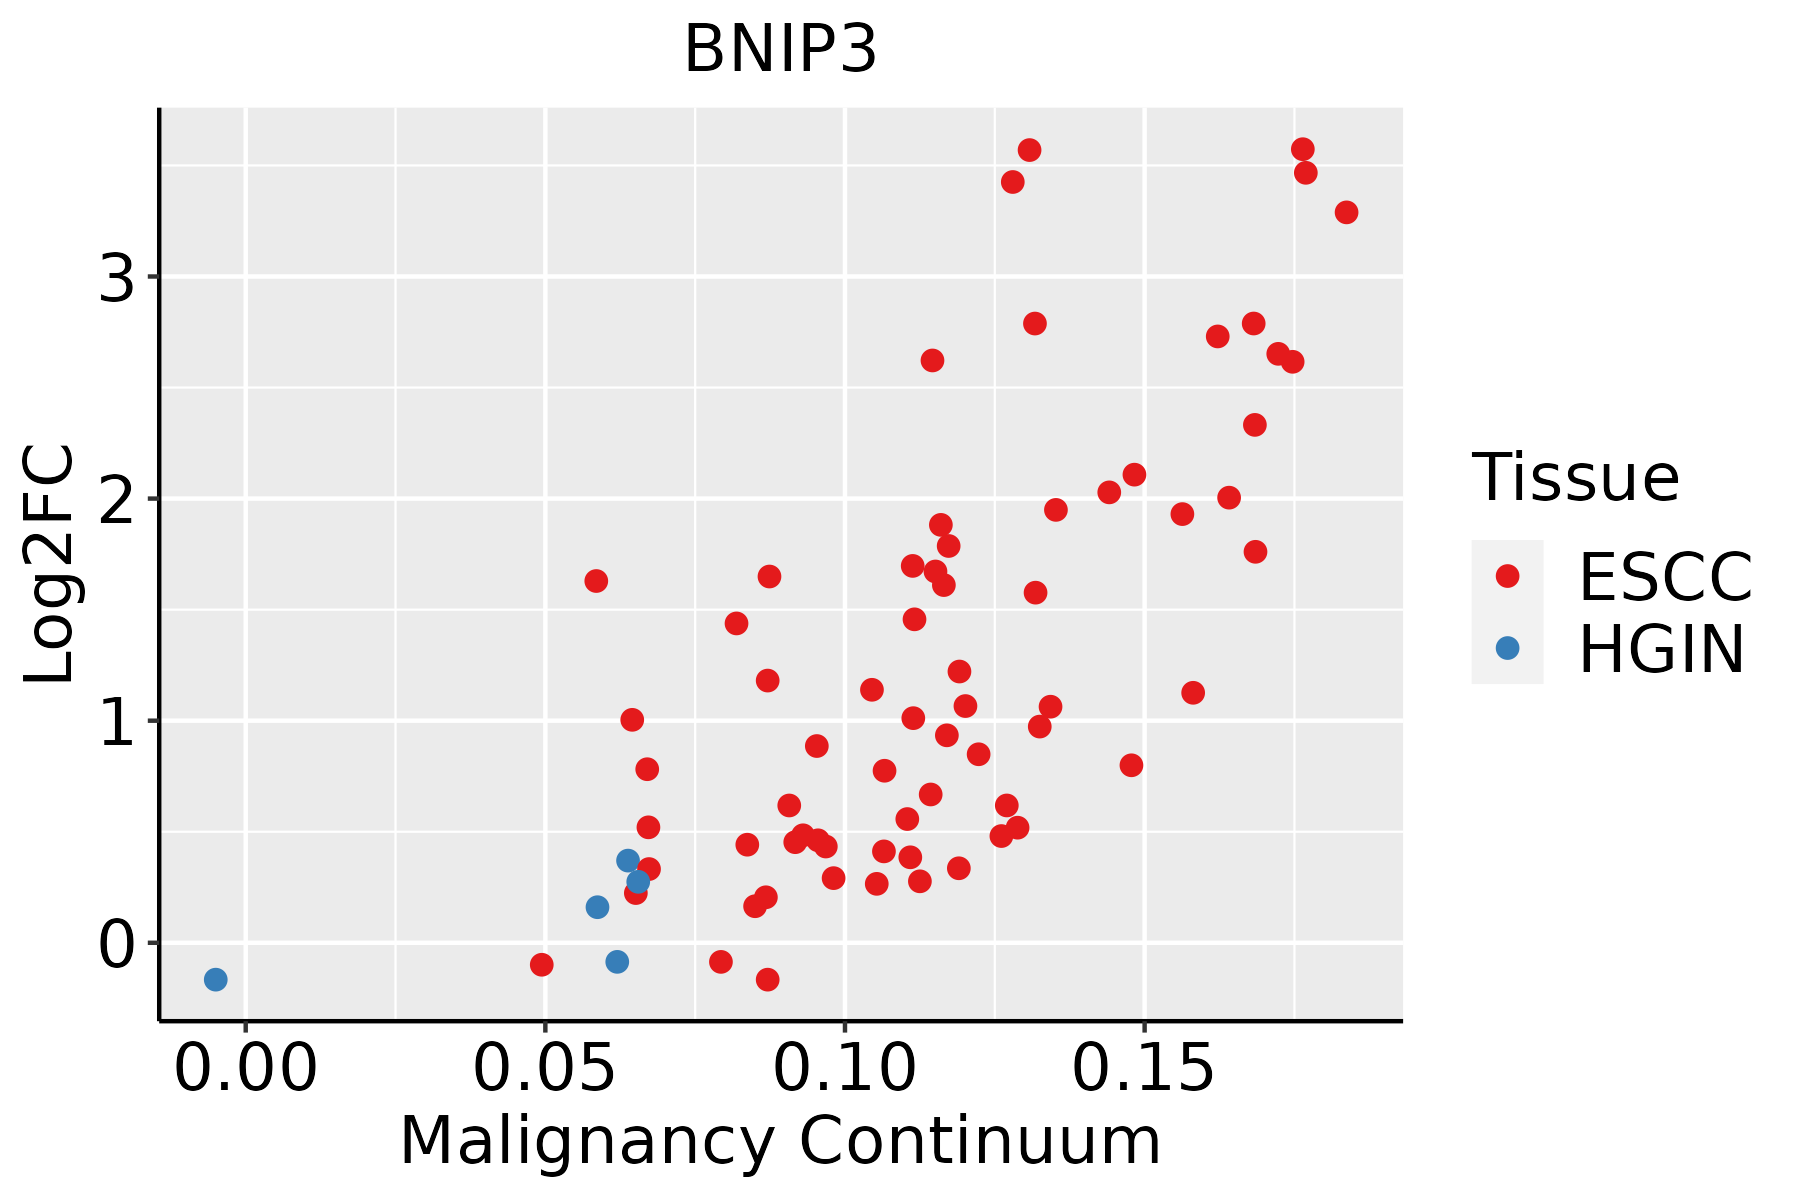 | ESCC: Esophageal squamous cell carcinoma |
| HGIN: High-grade intraepithelial neoplasias | ||
| LGIN: Low-grade intraepithelial neoplasias | ||
| Liver | 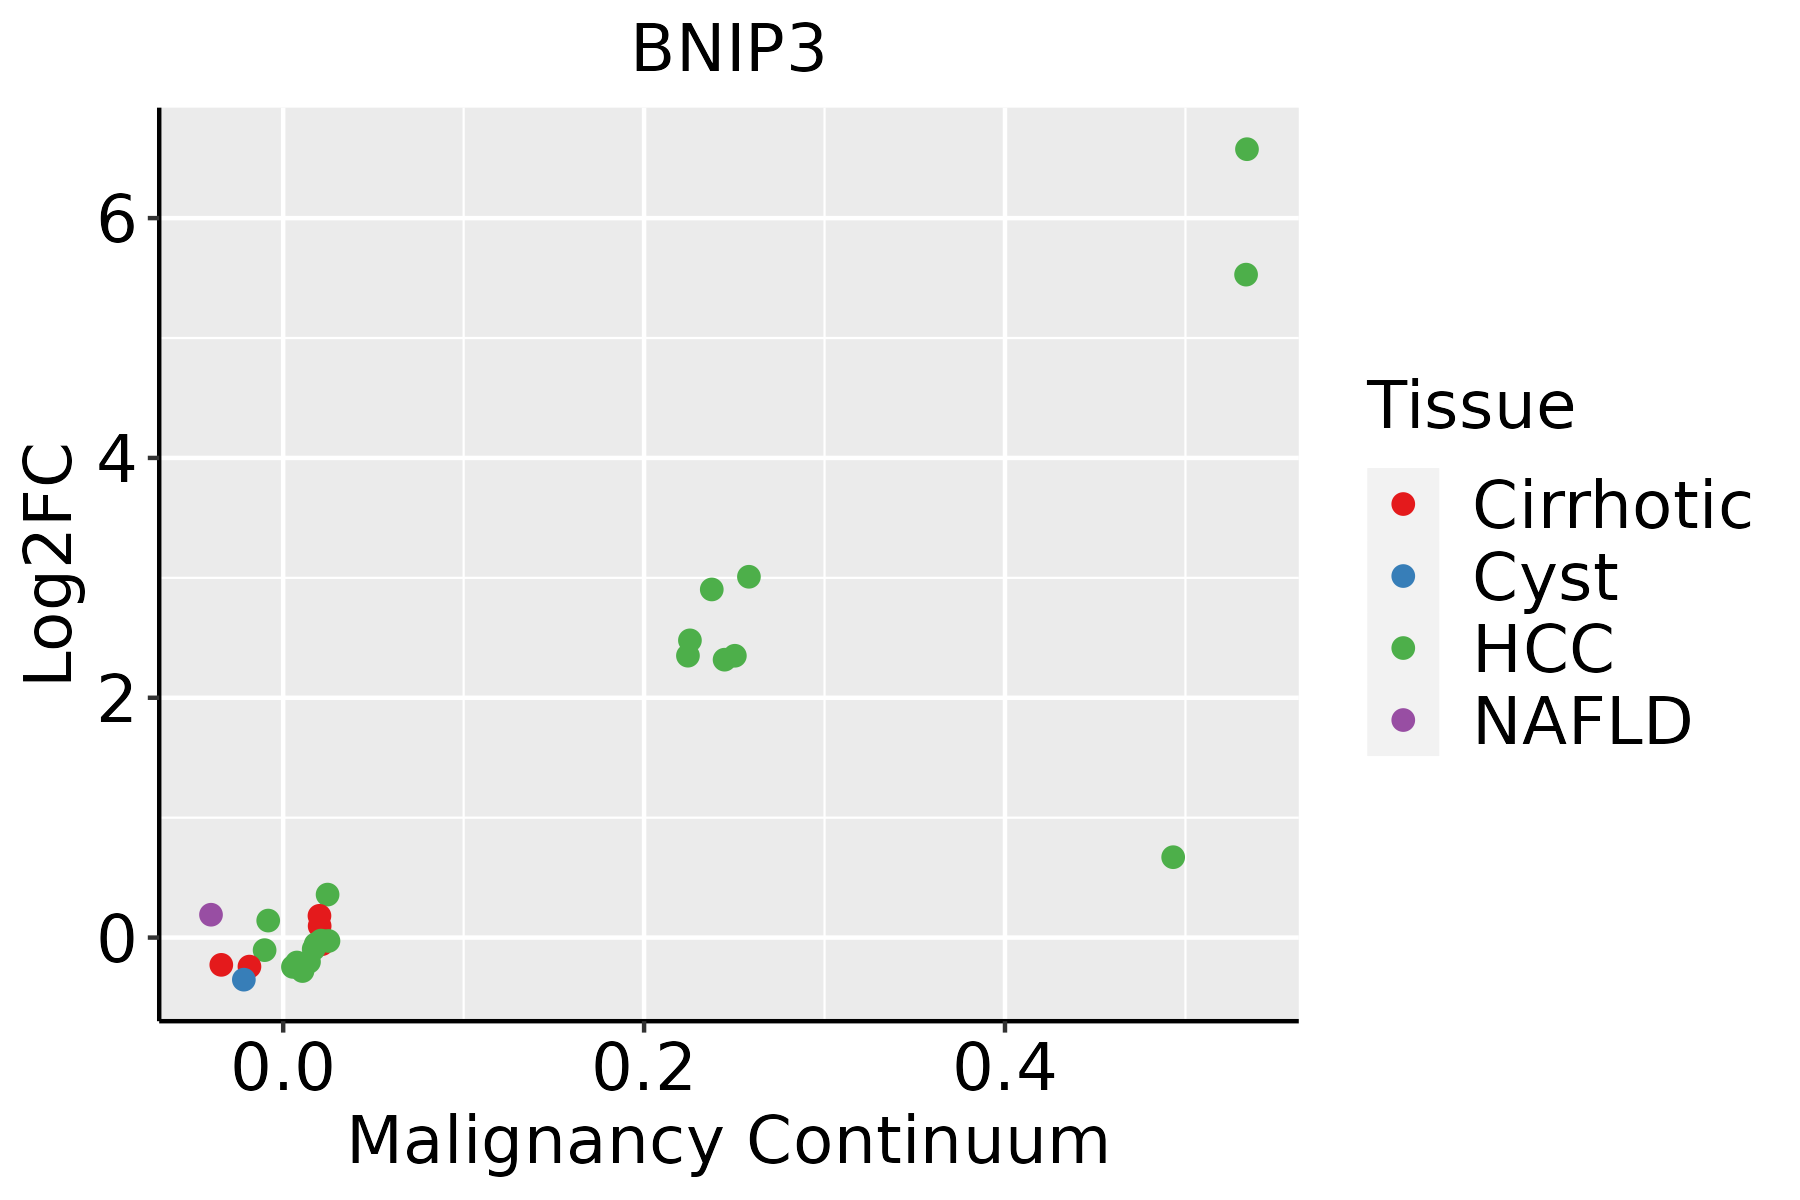 | HCC: Hepatocellular carcinoma |
| NAFLD: Non-alcoholic fatty liver disease | ||
| Oral Cavity | 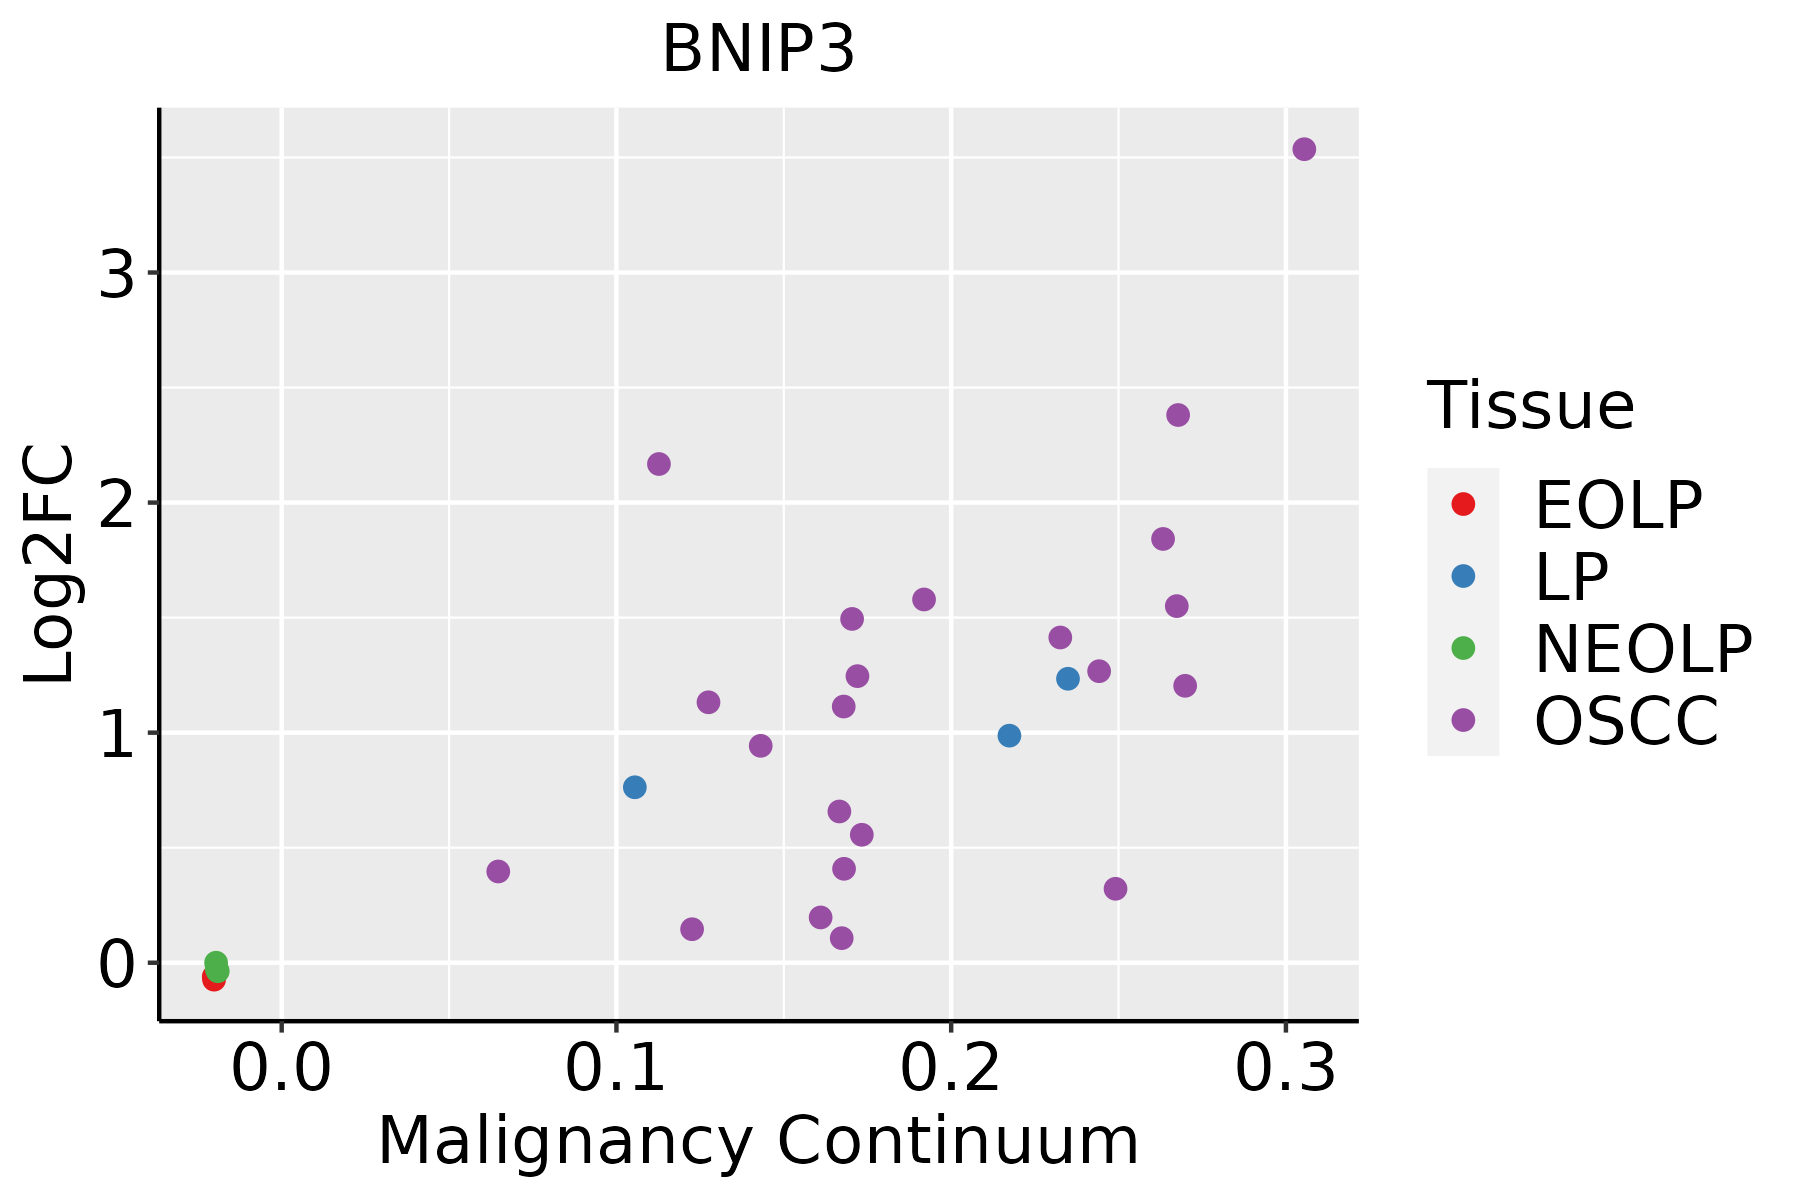 | EOLP: Erosive Oral lichen planus |
| LP: leukoplakia | ||
| NEOLP: Non-erosive oral lichen planus | ||
| OSCC: Oral squamous cell carcinoma | ||
| Prostate | 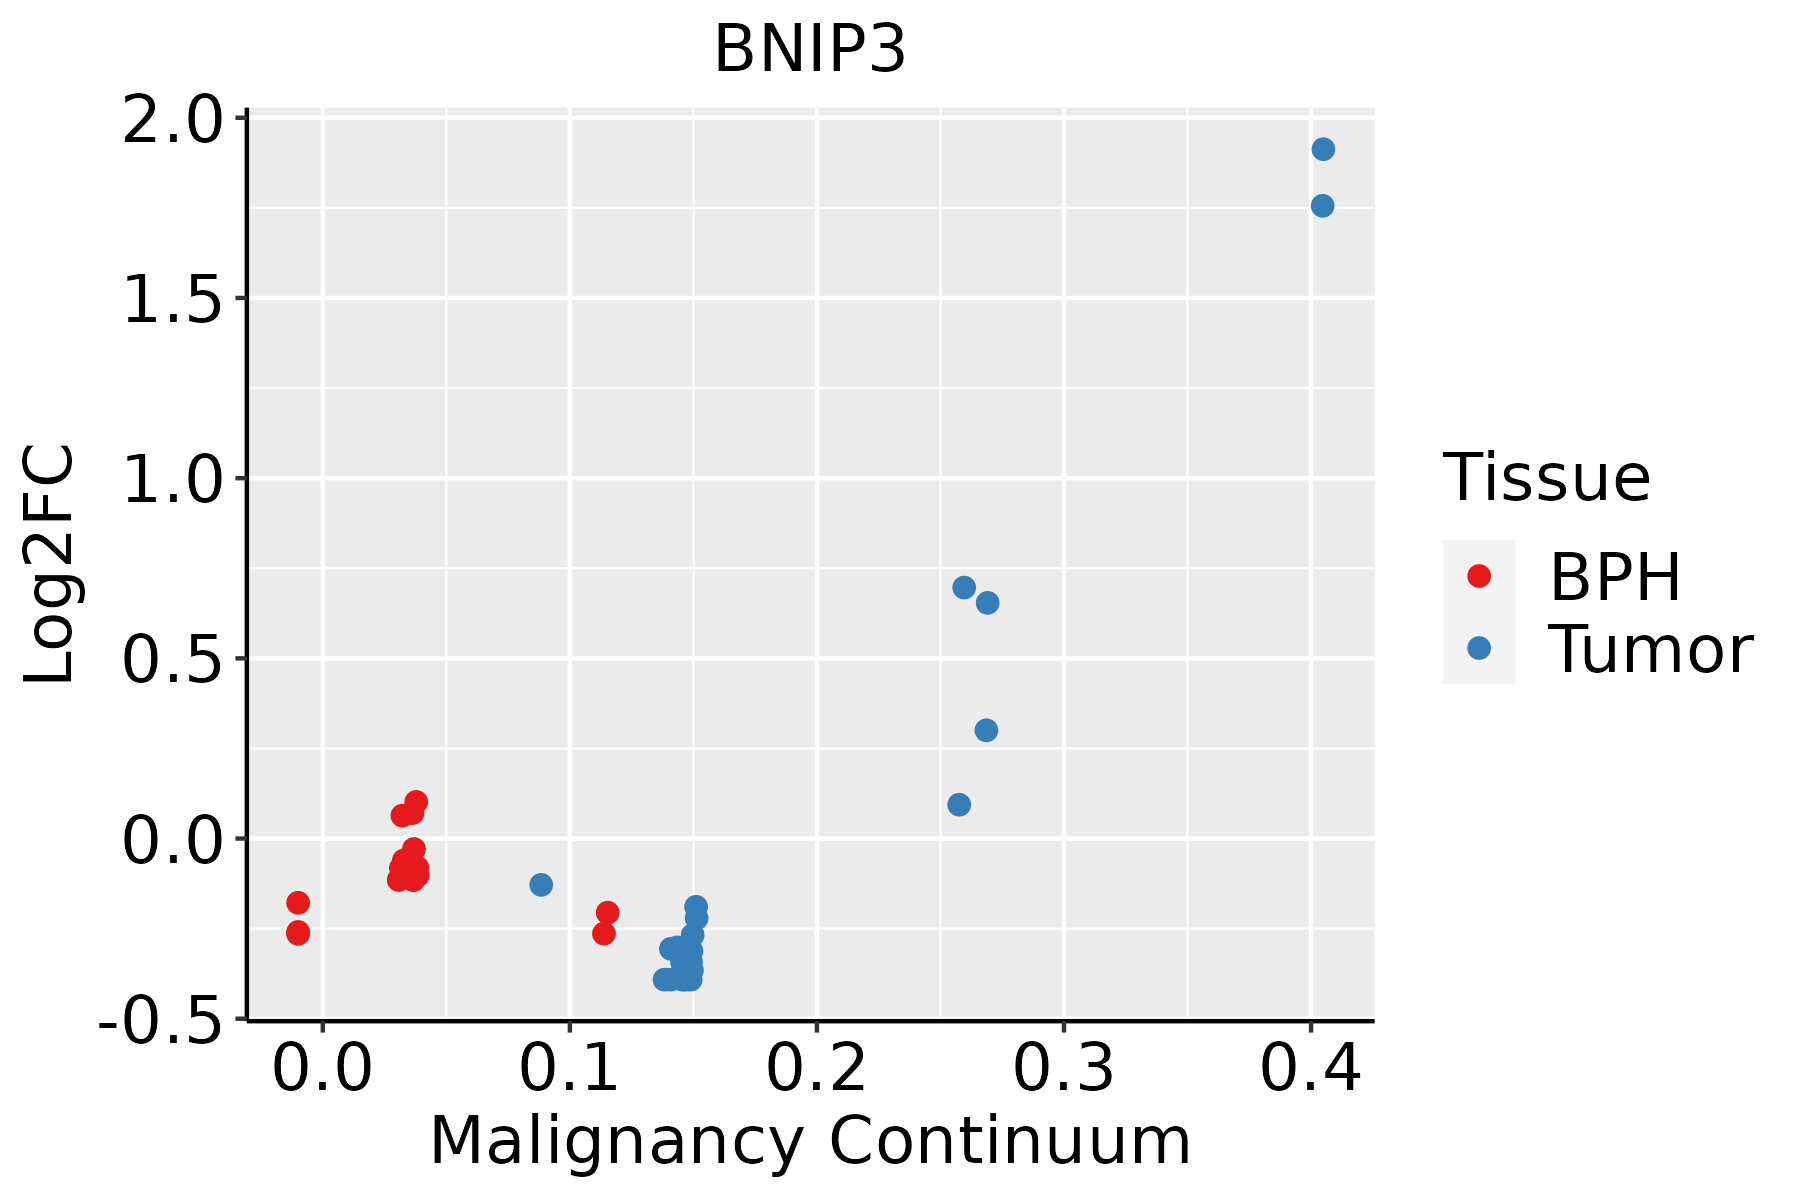 | BPH: Benign Prostatic Hyperplasia |
| Skin |  | AK: Actinic keratosis |
| cSCC: Cutaneous squamous cell carcinoma | ||
| SCCIS:squamous cell carcinoma in situ | ||
| Thyroid | 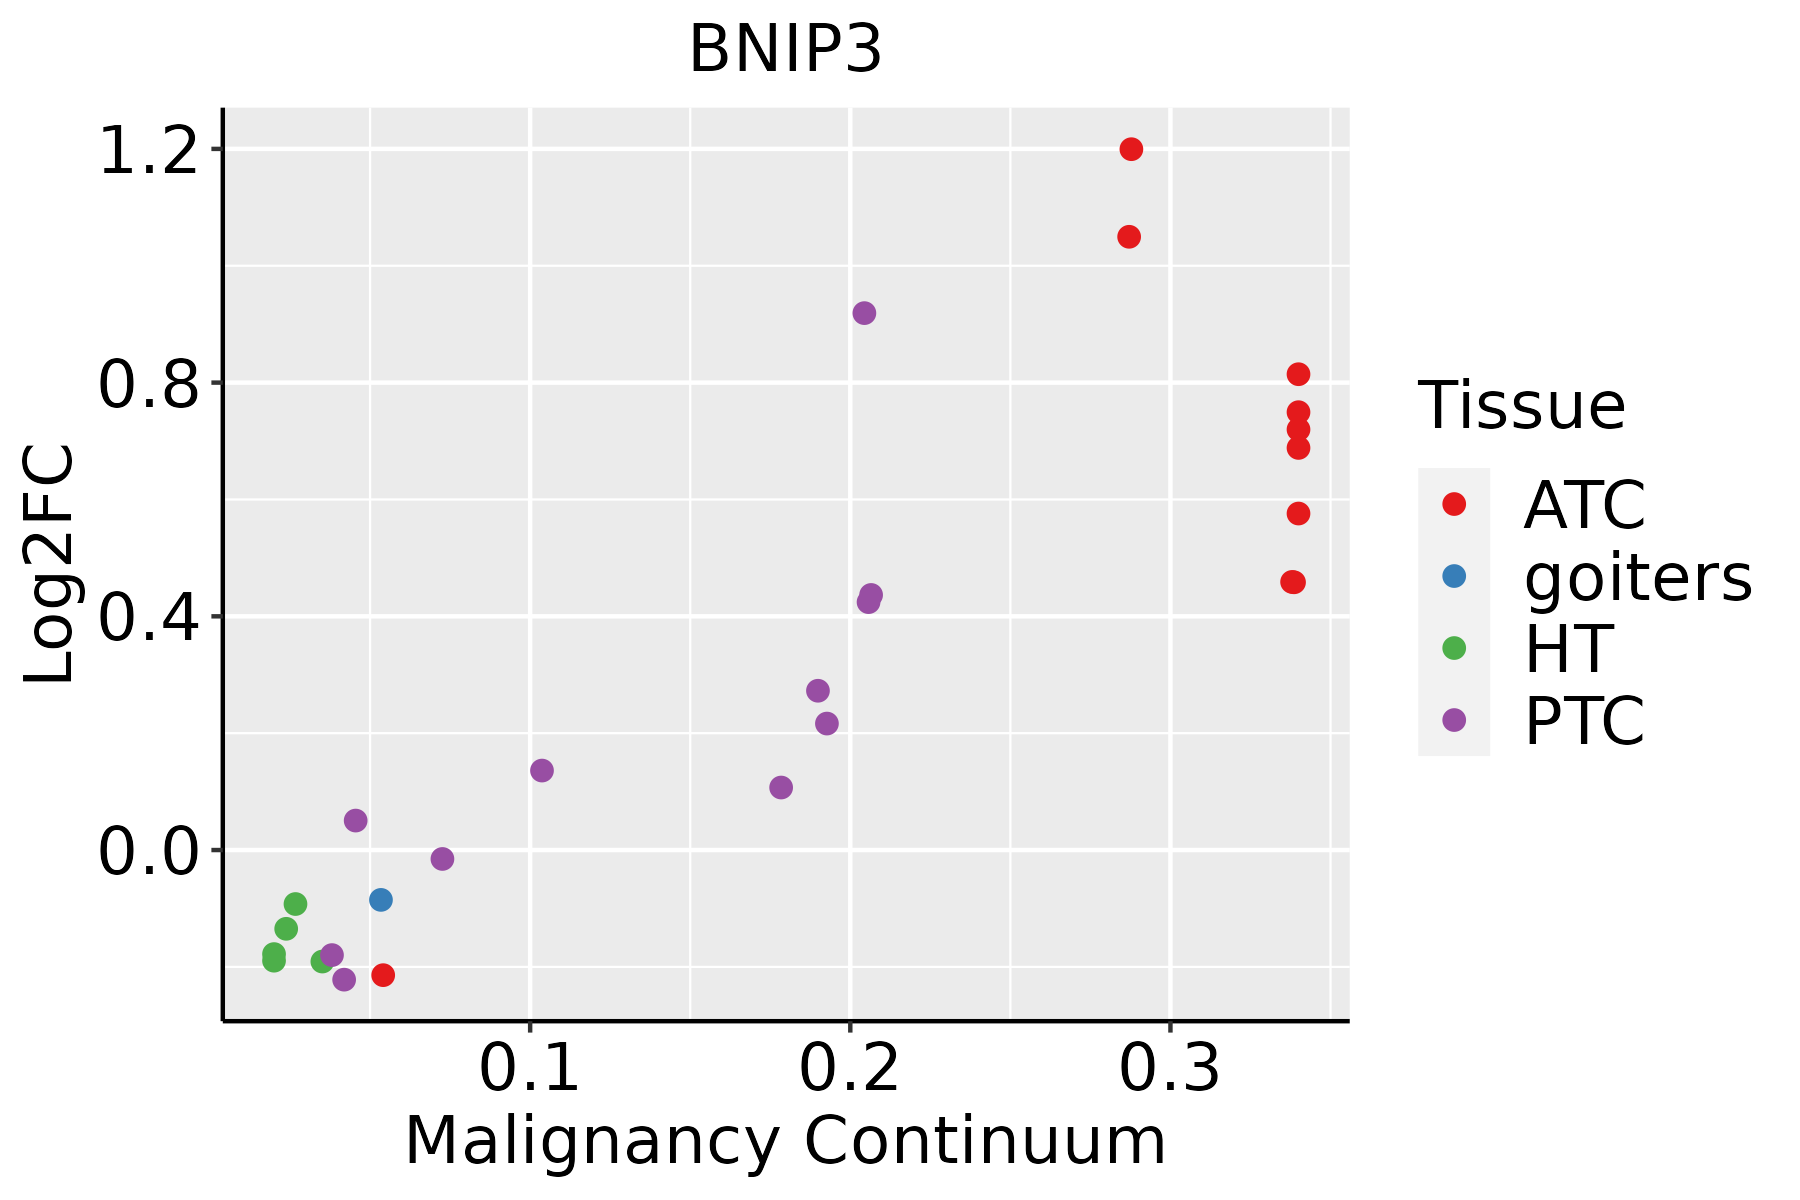 | ATC: Anaplastic thyroid cancer |
| HT: Hashimoto's thyroiditis | ||
| PTC: Papillary thyroid cancer |
| ∗log2FC in expression of this searched gene in stem-like cells from each diseased tissue sample relative to stem-like cells in normal samples in each tissue plotted against the malignancy continuum. Samples are colored based on if they are from different disease stage. |
Top |
Malignant transformation related pathway analysis |
| Find out the enriched GO biological processes and KEGG pathways involved in transition from healthy to precancer to cancer |
| Tissue | Disease Stage | Enriched GO biological Processes |
| Colorectum | AD |  |
| Colorectum | SER |  |
| Colorectum | MSS |  |
| Colorectum | MSI-H |  |
| Colorectum | FAP |  |
| ∗Top 15 enriched GO BP terms are showed in the bar plot of each disease state in each tissue. Each row represents a significant GO biological process which is colored according to the -log10(p.adjust). |
| Page: 1 2 3 4 5 6 7 8 9 |
| GO ID | Tissue | Disease Stage | Description | Gene Ratio | Bg Ratio | pvalue | p.adjust | Count |
| GO:00090608 | Breast | Precancer | aerobic respiration | 58/1080 | 189/18723 | 5.69e-27 | 7.62e-24 | 58 |
| GO:00060918 | Breast | Precancer | generation of precursor metabolites and energy | 94/1080 | 490/18723 | 1.54e-25 | 1.64e-22 | 94 |
| GO:00453338 | Breast | Precancer | cellular respiration | 59/1080 | 230/18723 | 5.97e-23 | 5.32e-20 | 59 |
| GO:00159808 | Breast | Precancer | energy derivation by oxidation of organic compounds | 70/1080 | 318/18723 | 8.33e-23 | 6.37e-20 | 70 |
| GO:00971939 | Breast | Precancer | intrinsic apoptotic signaling pathway | 59/1080 | 288/18723 | 8.07e-18 | 3.60e-15 | 59 |
| GO:00069799 | Breast | Precancer | response to oxidative stress | 70/1080 | 446/18723 | 1.59e-14 | 4.26e-12 | 70 |
| GO:00362939 | Breast | Precancer | response to decreased oxygen levels | 53/1080 | 322/18723 | 4.09e-12 | 6.84e-10 | 53 |
| GO:00016669 | Breast | Precancer | response to hypoxia | 51/1080 | 307/18723 | 7.33e-12 | 1.11e-09 | 51 |
| GO:00704829 | Breast | Precancer | response to oxygen levels | 55/1080 | 347/18723 | 7.47e-12 | 1.11e-09 | 55 |
| GO:00068398 | Breast | Precancer | mitochondrial transport | 45/1080 | 254/18723 | 1.37e-11 | 1.88e-09 | 45 |
| GO:00621979 | Breast | Precancer | cellular response to chemical stress | 51/1080 | 337/18723 | 2.40e-10 | 2.34e-08 | 51 |
| GO:00003029 | Breast | Precancer | response to reactive oxygen species | 38/1080 | 222/18723 | 1.47e-09 | 1.23e-07 | 38 |
| GO:00362948 | Breast | Precancer | cellular response to decreased oxygen levels | 31/1080 | 161/18723 | 2.61e-09 | 2.11e-07 | 31 |
| GO:00714538 | Breast | Precancer | cellular response to oxygen levels | 32/1080 | 177/18723 | 7.32e-09 | 5.52e-07 | 32 |
| GO:00709979 | Breast | Precancer | neuron death | 50/1080 | 361/18723 | 7.75e-09 | 5.70e-07 | 50 |
| GO:00714565 | Breast | Precancer | cellular response to hypoxia | 29/1080 | 151/18723 | 8.98e-09 | 6.50e-07 | 29 |
| GO:00514029 | Breast | Precancer | neuron apoptotic process | 38/1080 | 246/18723 | 2.68e-08 | 1.75e-06 | 38 |
| GO:00345999 | Breast | Precancer | cellular response to oxidative stress | 42/1080 | 288/18723 | 2.78e-08 | 1.79e-06 | 42 |
| GO:00086378 | Breast | Precancer | apoptotic mitochondrial changes | 23/1080 | 107/18723 | 3.44e-08 | 2.12e-06 | 23 |
| GO:00518816 | Breast | Precancer | regulation of mitochondrial membrane potential | 18/1080 | 74/18723 | 1.45e-07 | 7.82e-06 | 18 |
| Page: 1 2 3 4 5 6 7 8 9 10 11 12 13 14 15 16 17 18 19 20 21 22 23 24 25 26 27 28 29 30 31 32 33 34 35 36 37 38 39 40 41 42 43 44 45 46 47 48 49 50 51 52 53 54 55 56 57 58 59 60 61 62 63 64 65 66 |
| Pathway ID | Tissue | Disease Stage | Description | Gene Ratio | Bg Ratio | pvalue | p.adjust | qvalue | Count |
| hsa0513414 | Breast | Precancer | Legionellosis | 19/684 | 57/8465 | 4.62e-08 | 9.12e-07 | 6.98e-07 | 19 |
| hsa0513118 | Breast | Precancer | Shigellosis | 44/684 | 247/8465 | 3.91e-07 | 6.86e-06 | 5.26e-06 | 44 |
| hsa0413716 | Breast | Precancer | Mitophagy - animal | 15/684 | 72/8465 | 5.22e-04 | 3.93e-03 | 3.01e-03 | 15 |
| hsa0513415 | Breast | Precancer | Legionellosis | 19/684 | 57/8465 | 4.62e-08 | 9.12e-07 | 6.98e-07 | 19 |
| hsa0513119 | Breast | Precancer | Shigellosis | 44/684 | 247/8465 | 3.91e-07 | 6.86e-06 | 5.26e-06 | 44 |
| hsa0413717 | Breast | Precancer | Mitophagy - animal | 15/684 | 72/8465 | 5.22e-04 | 3.93e-03 | 3.01e-03 | 15 |
| hsa0513124 | Breast | IDC | Shigellosis | 47/867 | 247/8465 | 1.78e-05 | 2.00e-04 | 1.49e-04 | 47 |
| hsa0513134 | Breast | IDC | Shigellosis | 47/867 | 247/8465 | 1.78e-05 | 2.00e-04 | 1.49e-04 | 47 |
| hsa0513441 | Breast | DCIS | Legionellosis | 19/846 | 57/8465 | 1.30e-06 | 2.10e-05 | 1.55e-05 | 19 |
| hsa0513144 | Breast | DCIS | Shigellosis | 46/846 | 247/8465 | 2.06e-05 | 2.38e-04 | 1.75e-04 | 46 |
| hsa0413742 | Breast | DCIS | Mitophagy - animal | 17/846 | 72/8465 | 5.75e-04 | 4.42e-03 | 3.26e-03 | 17 |
| hsa0513451 | Breast | DCIS | Legionellosis | 19/846 | 57/8465 | 1.30e-06 | 2.10e-05 | 1.55e-05 | 19 |
| hsa0513154 | Breast | DCIS | Shigellosis | 46/846 | 247/8465 | 2.06e-05 | 2.38e-04 | 1.75e-04 | 46 |
| hsa0413752 | Breast | DCIS | Mitophagy - animal | 17/846 | 72/8465 | 5.75e-04 | 4.42e-03 | 3.26e-03 | 17 |
| hsa0513127 | Endometrium | EEC | Shigellosis | 79/1237 | 247/8465 | 1.80e-12 | 3.95e-11 | 2.95e-11 | 79 |
| hsa0413725 | Endometrium | EEC | Mitophagy - animal | 22/1237 | 72/8465 | 4.12e-04 | 3.30e-03 | 2.46e-03 | 22 |
| hsa0513418 | Endometrium | EEC | Legionellosis | 17/1237 | 57/8465 | 2.42e-03 | 1.47e-02 | 1.10e-02 | 17 |
| hsa0513136 | Endometrium | EEC | Shigellosis | 79/1237 | 247/8465 | 1.80e-12 | 3.95e-11 | 2.95e-11 | 79 |
| hsa0413735 | Endometrium | EEC | Mitophagy - animal | 22/1237 | 72/8465 | 4.12e-04 | 3.30e-03 | 2.46e-03 | 22 |
| hsa0513419 | Endometrium | EEC | Legionellosis | 17/1237 | 57/8465 | 2.42e-03 | 1.47e-02 | 1.10e-02 | 17 |
| Page: 1 2 3 4 5 |
Top |
Cell-cell communication analysis |
| Identification of potential cell-cell interactions between two cell types and their ligand-receptor pairs for different disease states |
| Ligand | Receptor | LRpair | Pathway | Tissue | Disease Stage |
| Page: 1 |
Top |
Single-cell gene regulatory network inference analysis |
| Find out the significant the regulons (TFs) and the target genes of each regulon across cell types for different disease states |
| TF | Cell Type | Tissue | Disease Stage | Target Gene | RSS | Regulon Activity |
| ∗The dot plots of a searched regulon are shown for all cell subpopulations in each disease state of each tissue based on the regulon specific score inferred using pySCENIC and by calculating the average expression. |
| Page: 1 |
Top |
Somatic mutation of malignant transformation related genes |
| Annotation of somatic variants for genes involved in malignant transformation |
| Hugo Symbol | Variant Class | Variant Classification | dbSNP RS | HGVSc | HGVSp | HGVSp Short | SWISSPROT | BIOTYPE | SIFT | PolyPhen | Tumor Sample Barcode | Tissue | Histology | Sex | Age | Stage | Therapy Types | Drugs | Outcome |
| BNIP3 | SNV | Missense_Mutation | c.377G>A | p.Ser126Asn | p.S126N | Q12983 | protein_coding | tolerated(0.2) | benign(0.331) | TCGA-AO-A128-01 | Breast | breast invasive carcinoma | Female | <65 | I/II | Chemotherapy | doxorubicin | SD | |
| BNIP3 | SNV | Missense_Mutation | c.638C>G | p.Thr213Arg | p.T213R | Q12983 | protein_coding | deleterious(0) | probably_damaging(0.991) | TCGA-JW-A5VL-01 | Cervix | cervical & endocervical cancer | Female | <65 | I/II | Unknown | Unknown | SD | |
| BNIP3 | SNV | Missense_Mutation | novel | c.460N>C | p.Glu154Gln | p.E154Q | Q12983 | protein_coding | tolerated(0.08) | probably_damaging(0.972) | TCGA-VS-A8EL-01 | Cervix | cervical & endocervical cancer | Female | <65 | I/II | Chemotherapy | cisplatin | CR |
| BNIP3 | SNV | Missense_Mutation | c.222N>T | p.Met74Ile | p.M74I | Q12983 | protein_coding | tolerated(0.23) | benign(0.042) | TCGA-A6-5665-01 | Colorectum | colon adenocarcinoma | Female | >=65 | I/II | Unknown | Unknown | PD | |
| BNIP3 | insertion | Frame_Shift_Ins | novel | c.331_332insA | p.Ile111AsnfsTer8 | p.I111Nfs*8 | Q12983 | protein_coding | TCGA-A6-3809-01 | Colorectum | colon adenocarcinoma | Female | >=65 | I/II | Unknown | Unknown | SD | ||
| BNIP3 | SNV | Missense_Mutation | c.727N>A | p.Gly243Arg | p.G243R | Q12983 | protein_coding | deleterious(0) | probably_damaging(0.999) | TCGA-AJ-A3EL-01 | Endometrium | uterine corpus endometrioid carcinoma | Female | <65 | I/II | Unknown | Unknown | SD | |
| BNIP3 | SNV | Missense_Mutation | rs745677503 | c.752N>A | p.Arg251His | p.R251H | Q12983 | protein_coding | deleterious(0) | benign(0.33) | TCGA-AJ-A3OJ-01 | Endometrium | uterine corpus endometrioid carcinoma | Female | <65 | I/II | Chemotherapy | carboplatin | CR |
| BNIP3 | SNV | Missense_Mutation | rs746423542 | c.401G>A | p.Arg134His | p.R134H | Q12983 | protein_coding | tolerated(0.08) | benign(0.33) | TCGA-AP-A1DV-01 | Endometrium | uterine corpus endometrioid carcinoma | Female | <65 | I/II | Unknown | Unknown | SD |
| BNIP3 | SNV | Missense_Mutation | c.751N>T | p.Arg251Cys | p.R251C | Q12983 | protein_coding | deleterious(0.02) | benign(0.221) | TCGA-AX-A05Z-01 | Endometrium | uterine corpus endometrioid carcinoma | Female | <65 | III/IV | Chemotherapy | adriamycin | SD | |
| BNIP3 | SNV | Missense_Mutation | novel | c.445N>G | p.Thr149Ala | p.T149A | Q12983 | protein_coding | tolerated(0.25) | benign(0.036) | TCGA-D1-A175-01 | Endometrium | uterine corpus endometrioid carcinoma | Female | <65 | I/II | Chemotherapy | paclitaxel | SD |
| Page: 1 2 |
Top |
Related drugs of malignant transformation related genes |
| Identification of chemicals and drugs interact with genes involved in malignant transfromation |
| (DGIdb 4.0) |
| Entrez ID | Symbol | Category | Interaction Types | Drug Claim Name | Drug Name | PMIDs |
| Page: 1 |

Copyright 2023-Present -The University of Texas Health Science Center at Houston |