
|
|||||
|
 | |
| |
| |
| |
| |
| |
|
Gene: BNIP2 |
Gene summary for BNIP2 |
| Gene information | Species | Human | Gene symbol | BNIP2 | Gene ID | 663 |
| Gene name | BCL2 interacting protein 2 | |
| Gene Alias | BNIP-2 | |
| Cytomap | 15q22.2 | |
| Gene Type | protein-coding | GO ID | GO:0006915 | UniProtAcc | Q12982 |
Top |
Malignant transformation analysis |
| Identification of the aberrant gene expression in precancerous and cancerous lesions by comparing the gene expression of stem-like cells in diseased tissues with normal stem cells |
| Entrez ID | Symbol | Replicates | Species | Organ | Tissue | Adj P-value | Log2FC | Malignancy |
| 663 | BNIP2 | LZE2T | Human | Esophagus | ESCC | 7.11e-04 | 4.59e-01 | 0.082 |
| 663 | BNIP2 | LZE4T | Human | Esophagus | ESCC | 7.15e-17 | 4.24e-01 | 0.0811 |
| 663 | BNIP2 | LZE5T | Human | Esophagus | ESCC | 4.48e-02 | 2.12e-01 | 0.0514 |
| 663 | BNIP2 | LZE7T | Human | Esophagus | ESCC | 2.56e-07 | 7.83e-01 | 0.0667 |
| 663 | BNIP2 | LZE8T | Human | Esophagus | ESCC | 1.02e-10 | 4.66e-01 | 0.067 |
| 663 | BNIP2 | LZE20T | Human | Esophagus | ESCC | 5.78e-04 | 4.35e-02 | 0.0662 |
| 663 | BNIP2 | LZE24T | Human | Esophagus | ESCC | 1.59e-12 | 3.09e-01 | 0.0596 |
| 663 | BNIP2 | LZE21T | Human | Esophagus | ESCC | 9.13e-03 | 3.79e-01 | 0.0655 |
| 663 | BNIP2 | LZE6T | Human | Esophagus | ESCC | 3.38e-05 | 3.25e-01 | 0.0845 |
| 663 | BNIP2 | P1T-E | Human | Esophagus | ESCC | 1.28e-12 | 8.47e-01 | 0.0875 |
| 663 | BNIP2 | P2T-E | Human | Esophagus | ESCC | 7.65e-32 | 6.44e-01 | 0.1177 |
| 663 | BNIP2 | P4T-E | Human | Esophagus | ESCC | 1.86e-32 | 8.98e-01 | 0.1323 |
| 663 | BNIP2 | P5T-E | Human | Esophagus | ESCC | 7.13e-28 | 3.96e-01 | 0.1327 |
| 663 | BNIP2 | P8T-E | Human | Esophagus | ESCC | 3.02e-35 | 7.02e-01 | 0.0889 |
| 663 | BNIP2 | P9T-E | Human | Esophagus | ESCC | 4.20e-18 | 4.56e-01 | 0.1131 |
| 663 | BNIP2 | P10T-E | Human | Esophagus | ESCC | 6.95e-35 | 6.58e-01 | 0.116 |
| 663 | BNIP2 | P11T-E | Human | Esophagus | ESCC | 5.97e-14 | 4.27e-01 | 0.1426 |
| 663 | BNIP2 | P12T-E | Human | Esophagus | ESCC | 7.48e-25 | 6.62e-01 | 0.1122 |
| 663 | BNIP2 | P15T-E | Human | Esophagus | ESCC | 3.31e-28 | 6.86e-01 | 0.1149 |
| 663 | BNIP2 | P16T-E | Human | Esophagus | ESCC | 3.88e-30 | 6.34e-01 | 0.1153 |
| Page: 1 2 3 4 5 6 7 |
| Tissue | Expression Dynamics | Abbreviation |
| Esophagus |  | ESCC: Esophageal squamous cell carcinoma |
| HGIN: High-grade intraepithelial neoplasias | ||
| LGIN: Low-grade intraepithelial neoplasias | ||
| Liver | 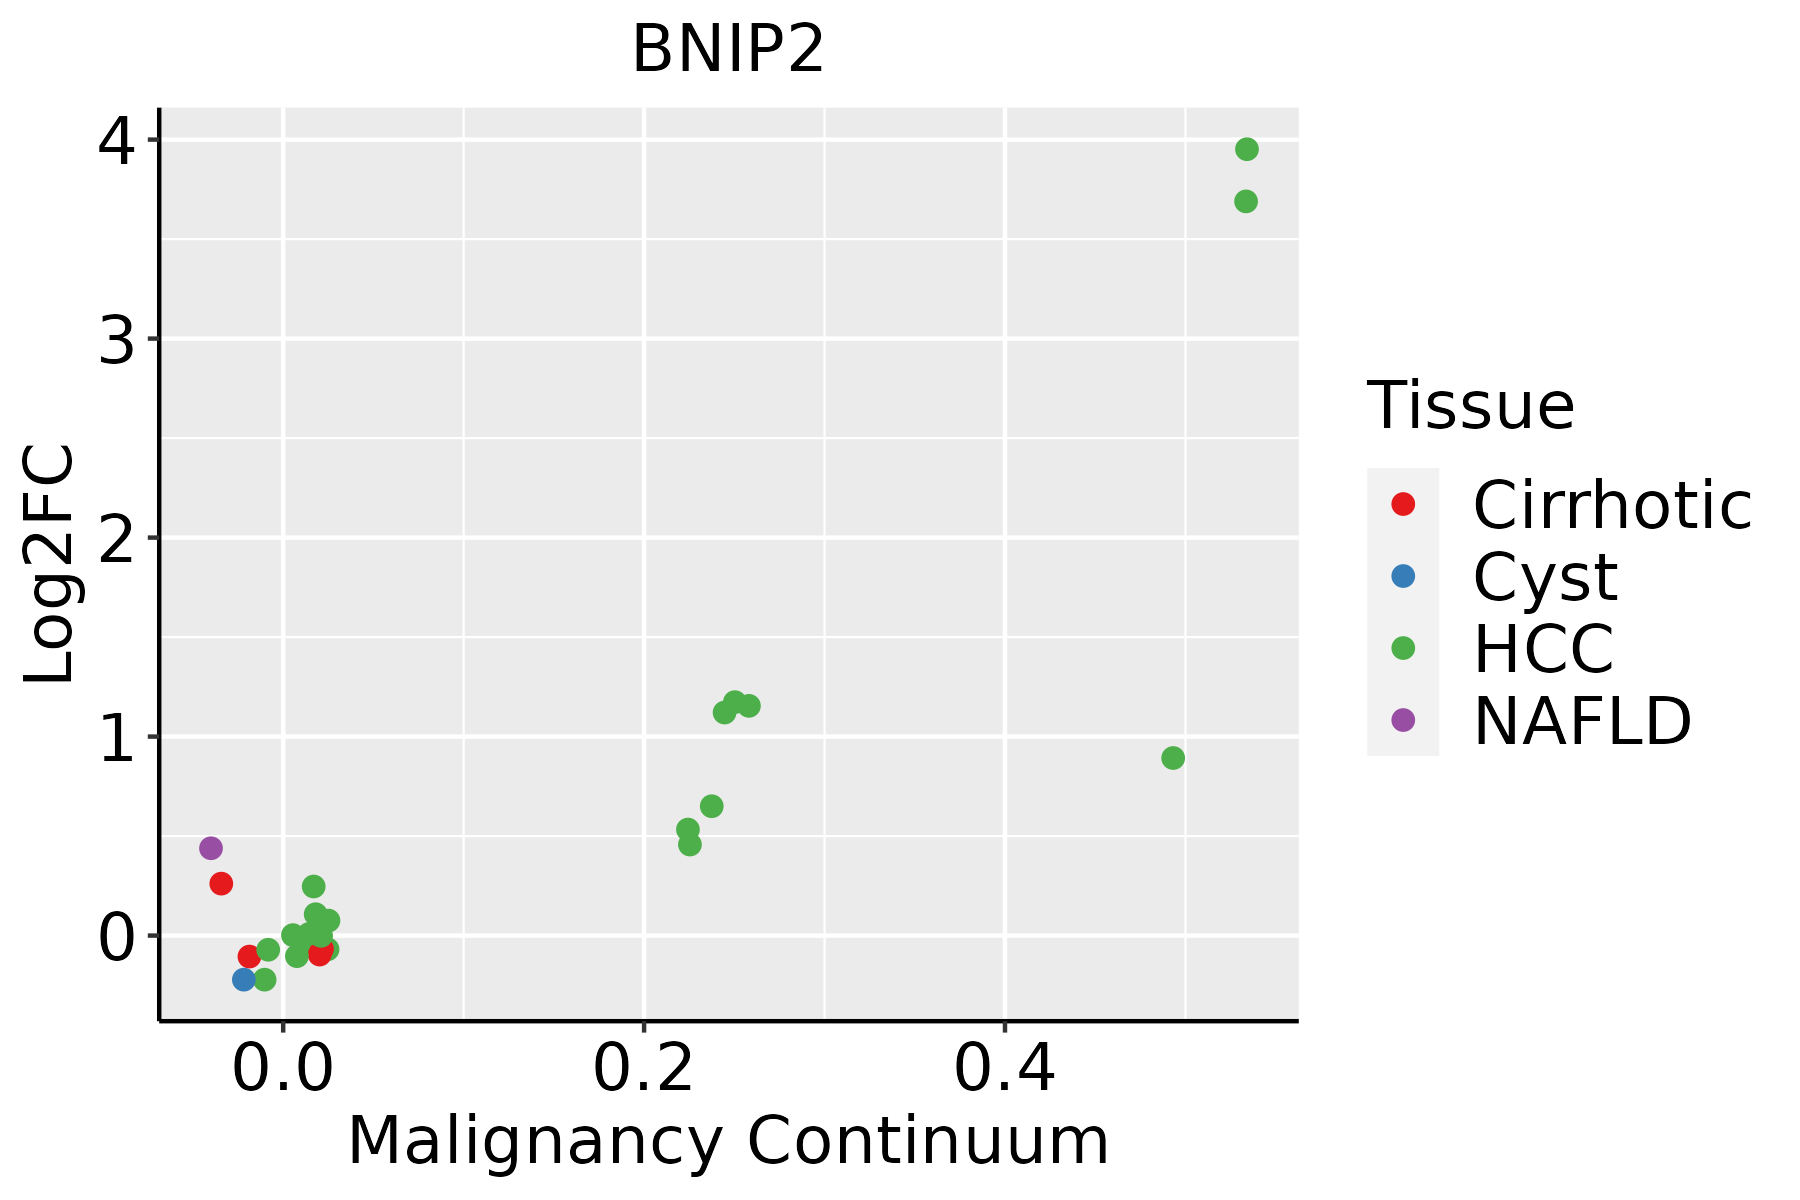 | HCC: Hepatocellular carcinoma |
| NAFLD: Non-alcoholic fatty liver disease | ||
| Oral Cavity |  | EOLP: Erosive Oral lichen planus |
| LP: leukoplakia | ||
| NEOLP: Non-erosive oral lichen planus | ||
| OSCC: Oral squamous cell carcinoma | ||
| Skin | 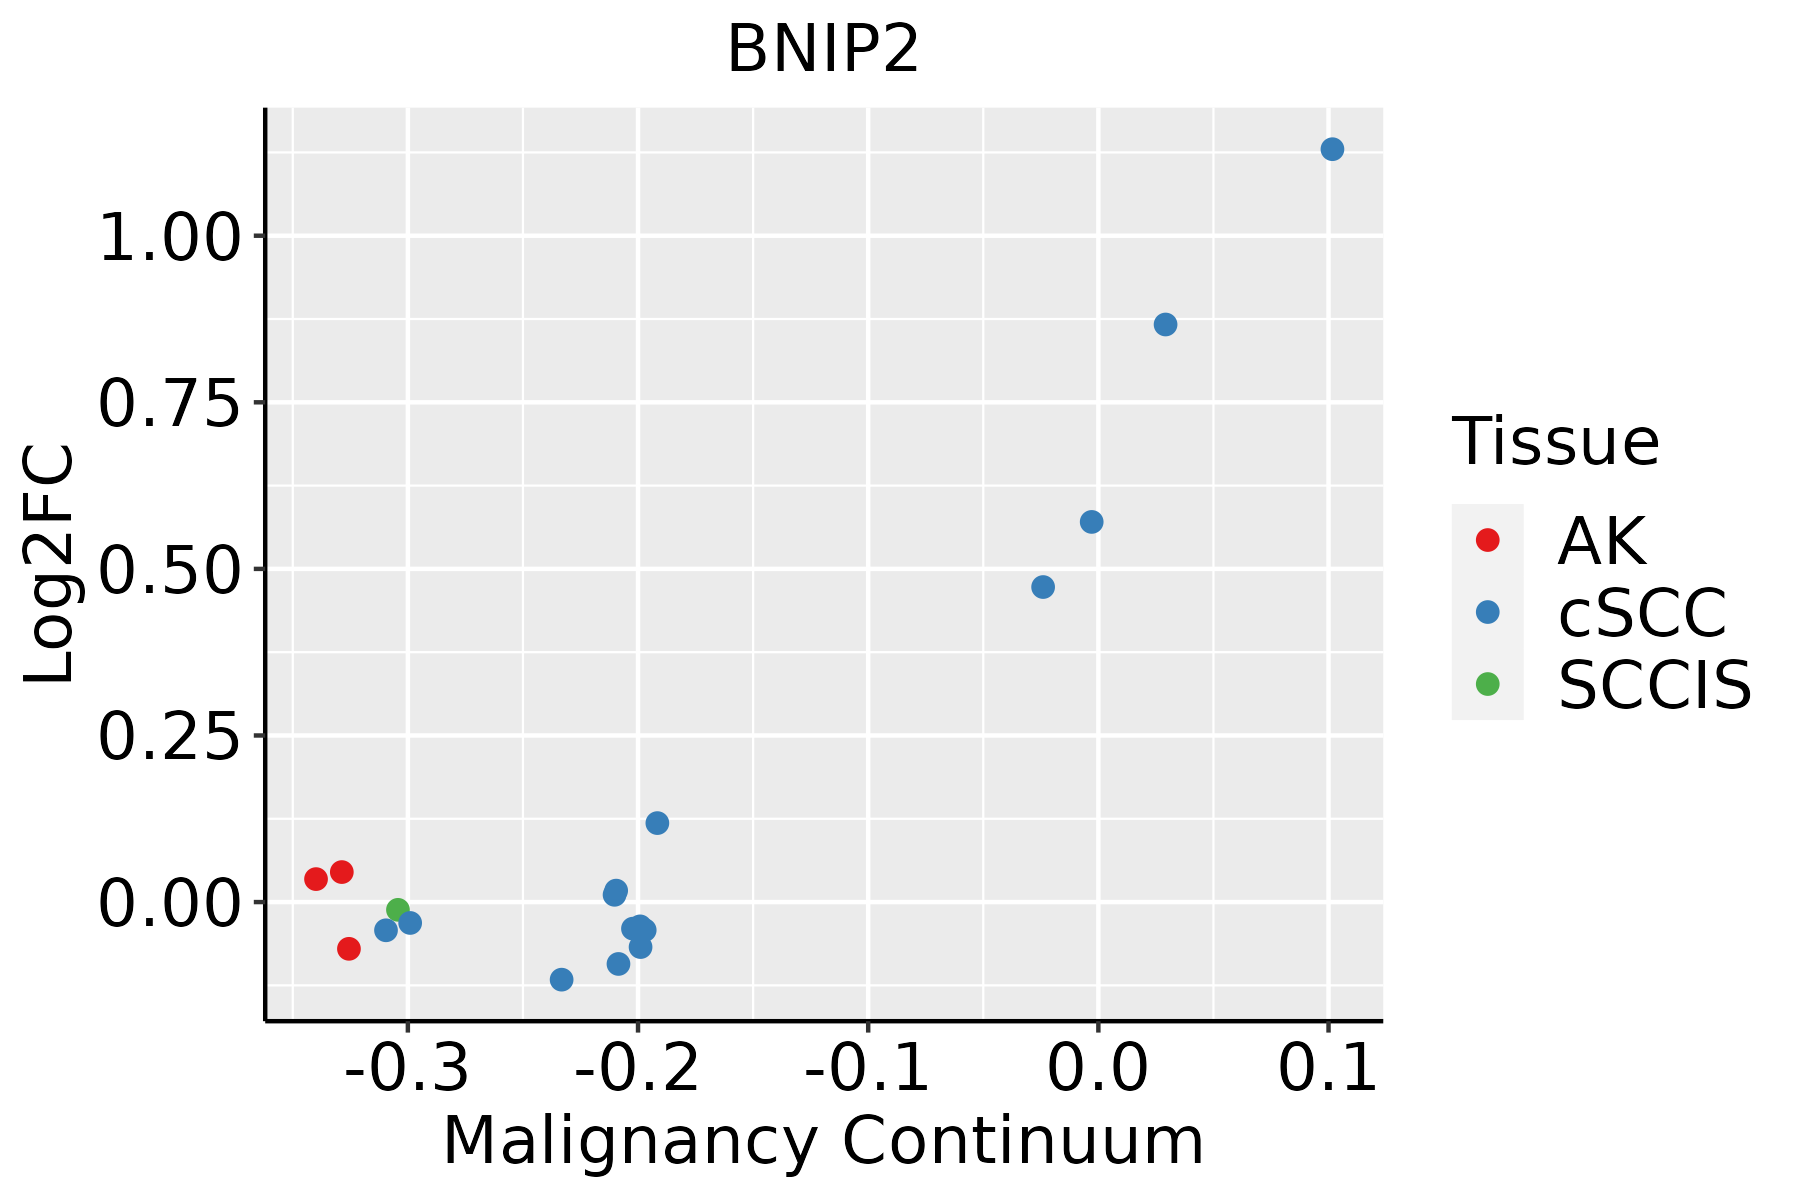 | AK: Actinic keratosis |
| cSCC: Cutaneous squamous cell carcinoma | ||
| SCCIS:squamous cell carcinoma in situ | ||
| Thyroid | 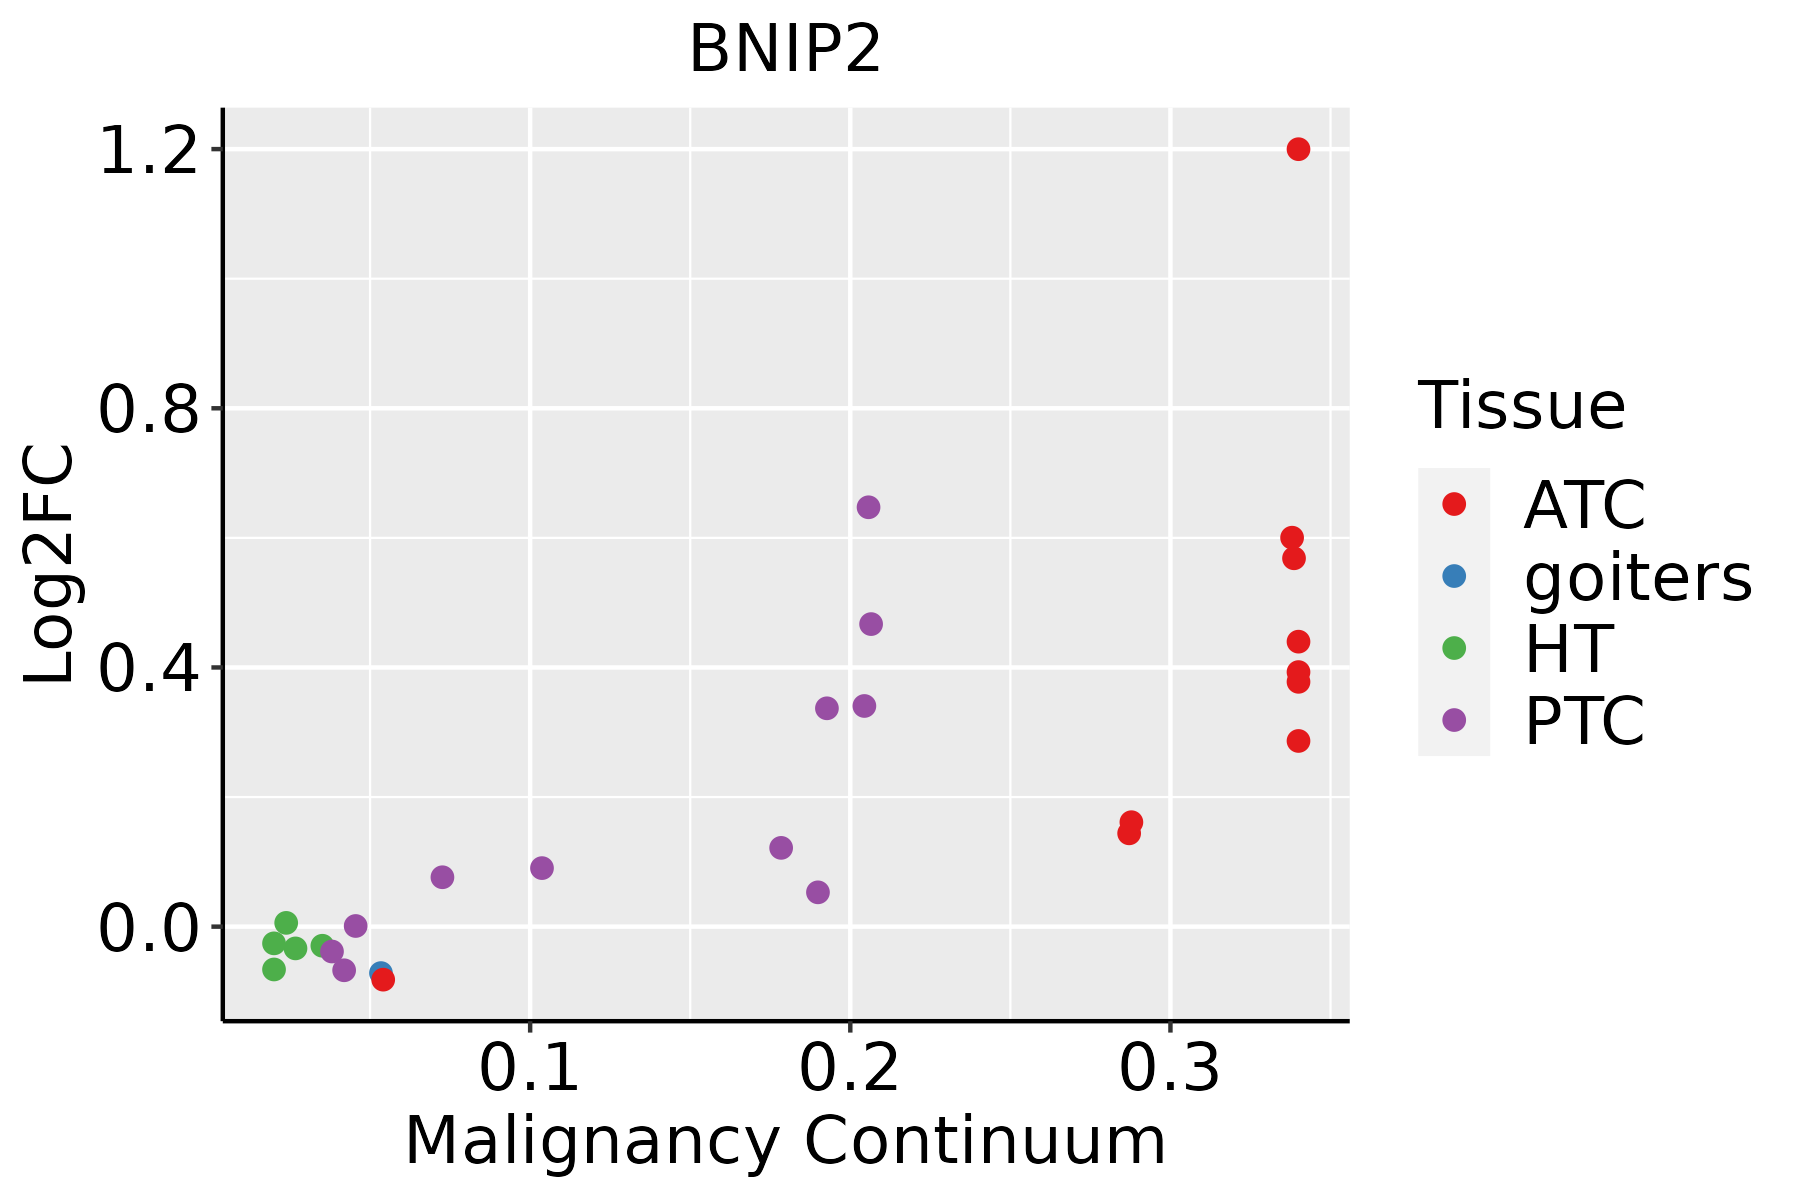 | ATC: Anaplastic thyroid cancer |
| HT: Hashimoto's thyroiditis | ||
| PTC: Papillary thyroid cancer |
| ∗log2FC in expression of this searched gene in stem-like cells from each diseased tissue sample relative to stem-like cells in normal samples in each tissue plotted against the malignancy continuum. Samples are colored based on if they are from different disease stage. |
Top |
Malignant transformation related pathway analysis |
| Find out the enriched GO biological processes and KEGG pathways involved in transition from healthy to precancer to cancer |
| Tissue | Disease Stage | Enriched GO biological Processes |
| Colorectum | AD |  |
| Colorectum | SER |  |
| Colorectum | MSS |  |
| Colorectum | MSI-H |  |
| Colorectum | FAP |  |
| ∗Top 15 enriched GO BP terms are showed in the bar plot of each disease state in each tissue. Each row represents a significant GO biological process which is colored according to the -log10(p.adjust). |
| Page: 1 2 3 4 5 6 7 8 9 |
| GO ID | Tissue | Disease Stage | Description | Gene Ratio | Bg Ratio | pvalue | p.adjust | Count |
| GO:0031667111 | Esophagus | ESCC | response to nutrient levels | 289/8552 | 474/18723 | 9.25e-12 | 3.47e-10 | 289 |
| GO:0070482111 | Esophagus | ESCC | response to oxygen levels | 218/8552 | 347/18723 | 6.91e-11 | 2.17e-09 | 218 |
| GO:0036293111 | Esophagus | ESCC | response to decreased oxygen levels | 201/8552 | 322/18723 | 8.37e-10 | 2.04e-08 | 201 |
| GO:0090649 | Esophagus | ESCC | response to oxygen-glucose deprivation | 10/8552 | 11/18723 | 2.54e-03 | 1.08e-02 | 10 |
| GO:00316677 | Liver | NAFLD | response to nutrient levels | 85/1882 | 474/18723 | 8.23e-08 | 7.09e-06 | 85 |
| GO:003166712 | Liver | Cirrhotic | response to nutrient levels | 174/4634 | 474/18723 | 3.08e-09 | 1.27e-07 | 174 |
| GO:00704827 | Liver | Cirrhotic | response to oxygen levels | 125/4634 | 347/18723 | 1.55e-06 | 3.02e-05 | 125 |
| GO:00362937 | Liver | Cirrhotic | response to decreased oxygen levels | 113/4634 | 322/18723 | 1.87e-05 | 2.52e-04 | 113 |
| GO:003166722 | Liver | HCC | response to nutrient levels | 276/7958 | 474/18723 | 2.30e-12 | 1.08e-10 | 276 |
| GO:003629312 | Liver | HCC | response to decreased oxygen levels | 179/7958 | 322/18723 | 1.29e-06 | 1.87e-05 | 179 |
| GO:007048212 | Liver | HCC | response to oxygen levels | 191/7958 | 347/18723 | 1.42e-06 | 2.03e-05 | 191 |
| GO:007048219 | Oral cavity | OSCC | response to oxygen levels | 200/7305 | 347/18723 | 1.17e-12 | 5.13e-11 | 200 |
| GO:003629319 | Oral cavity | OSCC | response to decreased oxygen levels | 182/7305 | 322/18723 | 1.14e-10 | 3.41e-09 | 182 |
| GO:003166720 | Oral cavity | OSCC | response to nutrient levels | 245/7305 | 474/18723 | 1.02e-08 | 2.10e-07 | 245 |
| GO:0031667110 | Oral cavity | LP | response to nutrient levels | 165/4623 | 474/18723 | 3.87e-07 | 1.12e-05 | 165 |
| GO:0070482110 | Oral cavity | LP | response to oxygen levels | 122/4623 | 347/18723 | 7.10e-06 | 1.37e-04 | 122 |
| GO:0036293110 | Oral cavity | LP | response to decreased oxygen levels | 109/4623 | 322/18723 | 1.25e-04 | 1.46e-03 | 109 |
| GO:007048226 | Skin | cSCC | response to oxygen levels | 133/4864 | 347/18723 | 2.39e-07 | 5.07e-06 | 133 |
| GO:003629326 | Skin | cSCC | response to decreased oxygen levels | 119/4864 | 322/18723 | 7.98e-06 | 1.09e-04 | 119 |
| GO:003166728 | Skin | cSCC | response to nutrient levels | 160/4864 | 474/18723 | 8.44e-05 | 8.02e-04 | 160 |
| Page: 1 2 |
| Pathway ID | Tissue | Disease Stage | Description | Gene Ratio | Bg Ratio | pvalue | p.adjust | qvalue | Count |
| Page: 1 |
Top |
Cell-cell communication analysis |
| Identification of potential cell-cell interactions between two cell types and their ligand-receptor pairs for different disease states |
| Ligand | Receptor | LRpair | Pathway | Tissue | Disease Stage |
| Page: 1 |
Top |
Single-cell gene regulatory network inference analysis |
| Find out the significant the regulons (TFs) and the target genes of each regulon across cell types for different disease states |
| TF | Cell Type | Tissue | Disease Stage | Target Gene | RSS | Regulon Activity |
| ∗The dot plots of a searched regulon are shown for all cell subpopulations in each disease state of each tissue based on the regulon specific score inferred using pySCENIC and by calculating the average expression. |
| Page: 1 |
Top |
Somatic mutation of malignant transformation related genes |
| Annotation of somatic variants for genes involved in malignant transformation |
| Hugo Symbol | Variant Class | Variant Classification | dbSNP RS | HGVSc | HGVSp | HGVSp Short | SWISSPROT | BIOTYPE | SIFT | PolyPhen | Tumor Sample Barcode | Tissue | Histology | Sex | Age | Stage | Therapy Types | Drugs | Outcome |
| BNIP2 | SNV | Missense_Mutation | c.1063G>A | p.Asp355Asn | p.D355N | protein_coding | deleterious(0.03) | possibly_damaging(0.686) | TCGA-C8-A26Y-01 | Breast | breast invasive carcinoma | Female | >=65 | I/II | Unknown | Unknown | SD | ||
| BNIP2 | SNV | Missense_Mutation | novel | c.1300G>C | p.Glu434Gln | p.E434Q | protein_coding | deleterious_low_confidence(0.01) | benign(0.086) | TCGA-OL-A5RW-01 | Breast | breast invasive carcinoma | Female | <65 | I/II | Chemotherapy | adriamycin | CR | |
| BNIP2 | SNV | Missense_Mutation | c.736G>C | p.Glu246Gln | p.E246Q | protein_coding | tolerated(0.07) | possibly_damaging(0.84) | TCGA-EK-A2RJ-01 | Cervix | cervical & endocervical cancer | Female | <65 | I/II | Unknown | Unknown | SD | ||
| BNIP2 | SNV | Missense_Mutation | novel | c.860N>T | p.Ala287Val | p.A287V | protein_coding | deleterious(0.01) | probably_damaging(0.999) | TCGA-A6-3809-01 | Colorectum | colon adenocarcinoma | Female | >=65 | I/II | Unknown | Unknown | SD | |
| BNIP2 | SNV | Missense_Mutation | c.662N>G | p.Asp221Gly | p.D221G | protein_coding | deleterious(0.01) | probably_damaging(0.999) | TCGA-AA-3811-01 | Colorectum | colon adenocarcinoma | Female | >=65 | III/IV | Unknown | Unknown | PD | ||
| BNIP2 | SNV | Missense_Mutation | rs762238174 | c.449N>C | p.Ile150Thr | p.I150T | protein_coding | tolerated(0.46) | benign(0.007) | TCGA-AZ-4315-01 | Colorectum | colon adenocarcinoma | Male | <65 | I/II | Unknown | Unknown | SD | |
| BNIP2 | SNV | Missense_Mutation | c.1182A>T | p.Arg394Ser | p.R394S | protein_coding | deleterious(0.03) | possibly_damaging(0.786) | TCGA-D5-6537-01 | Colorectum | colon adenocarcinoma | Male | <65 | III/IV | Unknown | Unknown | PD | ||
| BNIP2 | SNV | Missense_Mutation | rs375444414 | c.1186N>A | p.Val396Met | p.V396M | protein_coding | deleterious(0.02) | probably_damaging(0.98) | TCGA-AJ-A3BH-01 | Endometrium | uterine corpus endometrioid carcinoma | Female | Unknown | I/II | Unknown | Unknown | SD | |
| BNIP2 | SNV | Missense_Mutation | novel | c.410C>T | p.Pro137Leu | p.P137L | protein_coding | deleterious(0) | probably_damaging(1) | TCGA-AJ-A5DW-01 | Endometrium | uterine corpus endometrioid carcinoma | Female | <65 | I/II | Unknown | Unknown | SD | |
| BNIP2 | SNV | Missense_Mutation | c.541C>A | p.Leu181Met | p.L181M | protein_coding | deleterious(0.01) | possibly_damaging(0.73) | TCGA-AP-A051-01 | Endometrium | uterine corpus endometrioid carcinoma | Female | >=65 | I/II | Unknown | Unknown | SD |
| Page: 1 2 |
Top |
Related drugs of malignant transformation related genes |
| Identification of chemicals and drugs interact with genes involved in malignant transfromation |
| (DGIdb 4.0) |
| Entrez ID | Symbol | Category | Interaction Types | Drug Claim Name | Drug Name | PMIDs |
| Page: 1 |

Copyright 2023-Present -The University of Texas Health Science Center at Houston |