
|
|||||
|
 | |
| |
| |
| |
| |
| |
|
Gene: BMT2 |
Gene summary for BMT2 |
| Gene information | Species | Human | Gene symbol | BMT2 | Gene ID | 154743 |
| Gene name | base methyltransferase of 25S rRNA 2 homolog | |
| Gene Alias | C7orf60 | |
| Cytomap | 7q31.1 | |
| Gene Type | protein-coding | GO ID | GO:0006950 | UniProtAcc | Q1RMZ1 |
Top |
Malignant transformation analysis |
| Identification of the aberrant gene expression in precancerous and cancerous lesions by comparing the gene expression of stem-like cells in diseased tissues with normal stem cells |
| Entrez ID | Symbol | Replicates | Species | Organ | Tissue | Adj P-value | Log2FC | Malignancy |
| 154743 | BMT2 | S014 | Human | Liver | HCC | 5.71e-08 | 2.66e-01 | 0.2254 |
| 154743 | BMT2 | S016 | Human | Liver | HCC | 6.73e-07 | 2.17e-01 | 0.2243 |
| 154743 | BMT2 | S027 | Human | Liver | HCC | 6.88e-10 | 5.84e-01 | 0.2446 |
| 154743 | BMT2 | S028 | Human | Liver | HCC | 7.29e-17 | 5.64e-01 | 0.2503 |
| 154743 | BMT2 | S029 | Human | Liver | HCC | 4.60e-12 | 4.56e-01 | 0.2581 |
| 154743 | BMT2 | RNA-P6T2-P6T2-1 | Human | Lung | IAC | 3.82e-12 | 4.58e-01 | -0.0166 |
| 154743 | BMT2 | RNA-P6T2-P6T2-2 | Human | Lung | IAC | 1.49e-10 | 4.16e-01 | -0.0132 |
| 154743 | BMT2 | RNA-P6T2-P6T2-3 | Human | Lung | IAC | 3.60e-12 | 4.20e-01 | -0.013 |
| 154743 | BMT2 | RNA-P6T2-P6T2-4 | Human | Lung | IAC | 2.29e-09 | 4.26e-01 | -0.0121 |
| 154743 | BMT2 | RNA-P7T1-P7T1-1 | Human | Lung | AIS | 6.59e-04 | 5.86e-01 | -0.0961 |
| 154743 | BMT2 | RNA-P7T1-P7T1-2 | Human | Lung | AIS | 2.62e-04 | 5.99e-01 | -0.0876 |
| 154743 | BMT2 | RNA-P7T1-P7T1-4 | Human | Lung | AIS | 4.77e-05 | 5.80e-01 | -0.0809 |
| Page: 1 |
| Tissue | Expression Dynamics | Abbreviation |
| Liver | 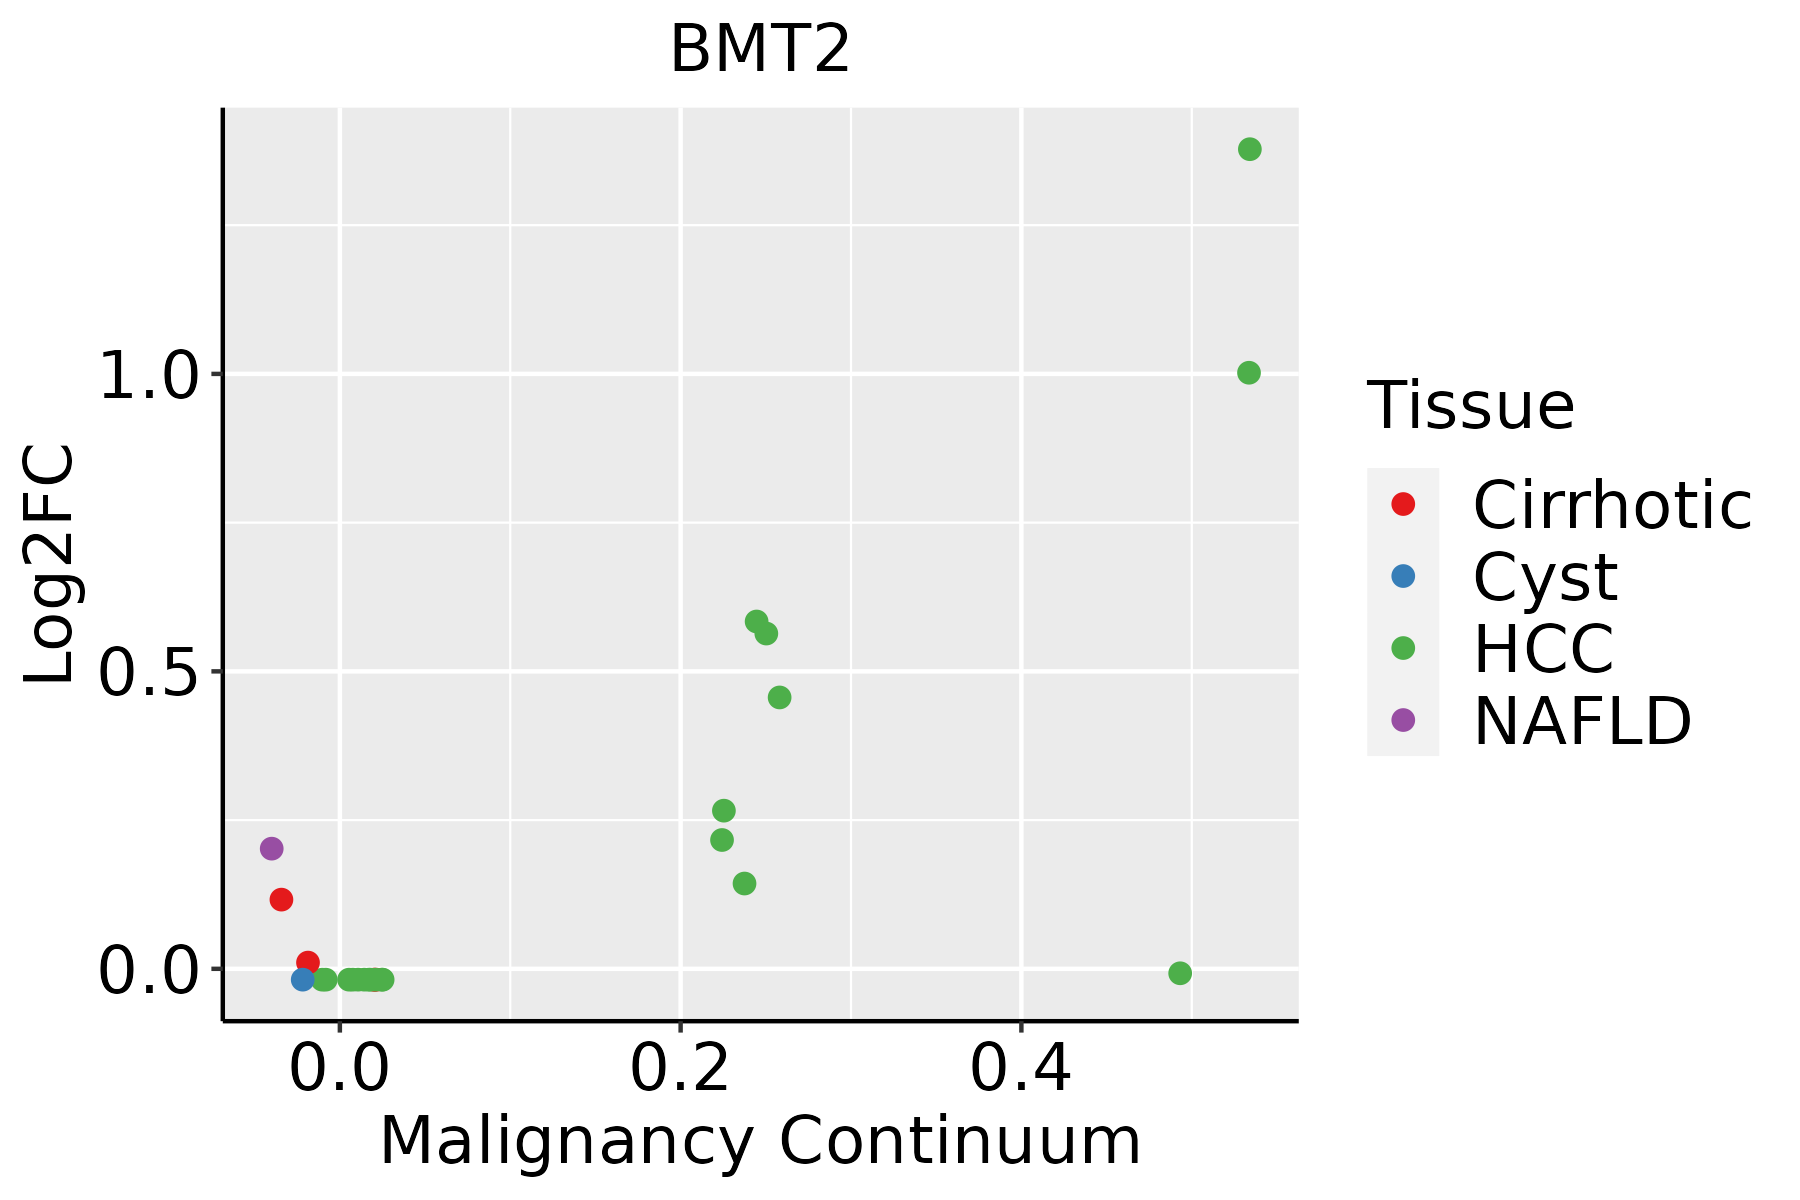 | HCC: Hepatocellular carcinoma |
| NAFLD: Non-alcoholic fatty liver disease | ||
| Lung | 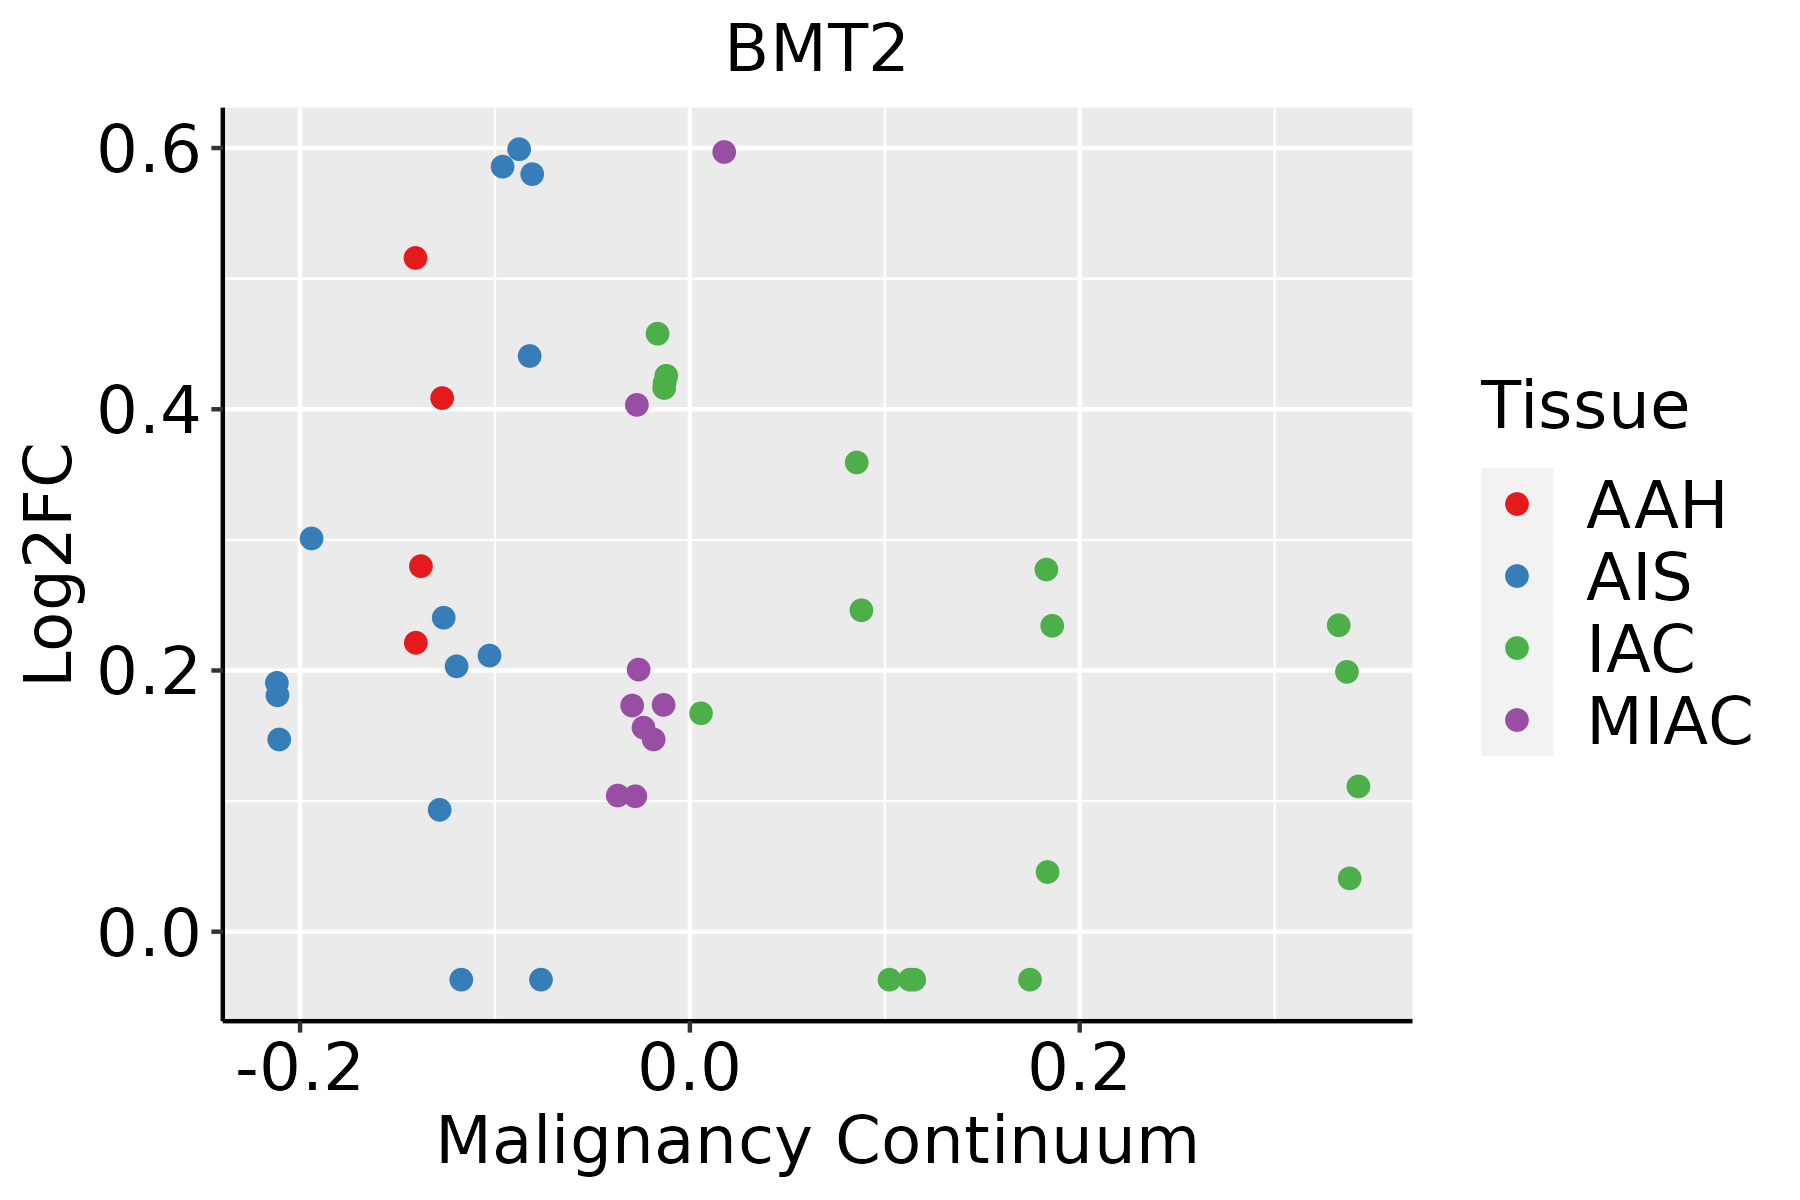 | AAH: Atypical adenomatous hyperplasia |
| AIS: Adenocarcinoma in situ | ||
| IAC: Invasive lung adenocarcinoma | ||
| MIA: Minimally invasive adenocarcinoma |
| ∗log2FC in expression of this searched gene in stem-like cells from each diseased tissue sample relative to stem-like cells in normal samples in each tissue plotted against the malignancy continuum. Samples are colored based on if they are from different disease stage. |
Top |
Malignant transformation related pathway analysis |
| Find out the enriched GO biological processes and KEGG pathways involved in transition from healthy to precancer to cancer |
| Tissue | Disease Stage | Enriched GO biological Processes |
| Colorectum | AD |  |
| Colorectum | SER |  |
| Colorectum | MSS |  |
| Colorectum | MSI-H |  |
| Colorectum | FAP |  |
| ∗Top 15 enriched GO BP terms are showed in the bar plot of each disease state in each tissue. Each row represents a significant GO biological process which is colored according to the -log10(p.adjust). |
| Page: 1 2 3 4 5 6 7 8 9 |
| GO ID | Tissue | Disease Stage | Description | Gene Ratio | Bg Ratio | pvalue | p.adjust | Count |
| GO:003166722 | Liver | HCC | response to nutrient levels | 276/7958 | 474/18723 | 2.30e-12 | 1.08e-10 | 276 |
| GO:007149622 | Liver | HCC | cellular response to external stimulus | 191/7958 | 320/18723 | 3.40e-10 | 1.13e-08 | 191 |
| GO:003166812 | Liver | HCC | cellular response to extracellular stimulus | 149/7958 | 246/18723 | 7.35e-09 | 1.86e-07 | 149 |
| GO:0032259 | Liver | HCC | methylation | 206/7958 | 364/18723 | 3.35e-08 | 7.53e-07 | 206 |
| GO:004259421 | Liver | HCC | response to starvation | 121/7958 | 197/18723 | 6.08e-08 | 1.28e-06 | 121 |
| GO:003166912 | Liver | HCC | cellular response to nutrient levels | 130/7958 | 215/18723 | 7.52e-08 | 1.51e-06 | 130 |
| GO:000926712 | Liver | HCC | cellular response to starvation | 94/7958 | 156/18723 | 5.61e-06 | 6.95e-05 | 94 |
| GO:00319291 | Liver | HCC | TOR signaling | 78/7958 | 126/18723 | 8.49e-06 | 9.97e-05 | 78 |
| GO:0032006 | Liver | HCC | regulation of TOR signaling | 63/7958 | 104/18723 | 1.50e-04 | 1.20e-03 | 63 |
| GO:19909281 | Liver | HCC | response to amino acid starvation | 33/7958 | 49/18723 | 3.86e-04 | 2.62e-03 | 33 |
| GO:00341981 | Liver | HCC | cellular response to amino acid starvation | 30/7958 | 46/18723 | 1.56e-03 | 8.23e-03 | 30 |
| GO:00714968 | Lung | IAC | cellular response to external stimulus | 60/2061 | 320/18723 | 2.50e-05 | 6.76e-04 | 60 |
| GO:00316687 | Lung | IAC | cellular response to extracellular stimulus | 48/2061 | 246/18723 | 5.62e-05 | 1.24e-03 | 48 |
| GO:00316696 | Lung | IAC | cellular response to nutrient levels | 41/2061 | 215/18723 | 3.13e-04 | 4.98e-03 | 41 |
| GO:00316678 | Lung | IAC | response to nutrient levels | 76/2061 | 474/18723 | 4.87e-04 | 7.08e-03 | 76 |
| GO:00092676 | Lung | IAC | cellular response to starvation | 29/2061 | 156/18723 | 3.26e-03 | 2.80e-02 | 29 |
| GO:00425946 | Lung | IAC | response to starvation | 34/2061 | 197/18723 | 5.29e-03 | 4.00e-02 | 34 |
| GO:003166813 | Lung | AIS | cellular response to extracellular stimulus | 41/1849 | 246/18723 | 5.90e-04 | 9.03e-03 | 41 |
| GO:007149613 | Lung | AIS | cellular response to external stimulus | 50/1849 | 320/18723 | 7.41e-04 | 1.07e-02 | 50 |
| GO:003166913 | Lung | AIS | cellular response to nutrient levels | 35/1849 | 215/18723 | 2.15e-03 | 2.31e-02 | 35 |
| Page: 1 2 |
| Pathway ID | Tissue | Disease Stage | Description | Gene Ratio | Bg Ratio | pvalue | p.adjust | qvalue | Count |
| Page: 1 |
Top |
Cell-cell communication analysis |
| Identification of potential cell-cell interactions between two cell types and their ligand-receptor pairs for different disease states |
| Ligand | Receptor | LRpair | Pathway | Tissue | Disease Stage |
| Page: 1 |
Top |
Single-cell gene regulatory network inference analysis |
| Find out the significant the regulons (TFs) and the target genes of each regulon across cell types for different disease states |
| TF | Cell Type | Tissue | Disease Stage | Target Gene | RSS | Regulon Activity |
| ∗The dot plots of a searched regulon are shown for all cell subpopulations in each disease state of each tissue based on the regulon specific score inferred using pySCENIC and by calculating the average expression. |
| Page: 1 |
Top |
Somatic mutation of malignant transformation related genes |
| Annotation of somatic variants for genes involved in malignant transformation |
| Hugo Symbol | Variant Class | Variant Classification | dbSNP RS | HGVSc | HGVSp | HGVSp Short | SWISSPROT | BIOTYPE | SIFT | PolyPhen | Tumor Sample Barcode | Tissue | Histology | Sex | Age | Stage | Therapy Types | Drugs | Outcome |
| BMT2 | SNV | Missense_Mutation | c.1129G>A | p.Asp377Asn | p.D377N | Q1RMZ1 | protein_coding | deleterious_low_confidence(0.02) | possibly_damaging(0.651) | TCGA-A2-A0CX-01 | Breast | breast invasive carcinoma | Female | <65 | I/II | Chemotherapy | adriamycin | SD | |
| BMT2 | SNV | Missense_Mutation | novel | c.355G>C | p.Asp119His | p.D119H | Q1RMZ1 | protein_coding | tolerated(0.06) | benign(0.196) | TCGA-OL-A5RW-01 | Breast | breast invasive carcinoma | Female | <65 | I/II | Chemotherapy | adriamycin | CR |
| BMT2 | SNV | Missense_Mutation | novel | c.488C>T | p.Ser163Leu | p.S163L | Q1RMZ1 | protein_coding | tolerated(0.38) | benign(0) | TCGA-MA-AA41-01 | Cervix | cervical & endocervical cancer | Female | <65 | I/II | Unknown | Unknown | SD |
| BMT2 | SNV | Missense_Mutation | c.755N>T | p.Ser252Phe | p.S252F | Q1RMZ1 | protein_coding | deleterious(0) | probably_damaging(0.995) | TCGA-AZ-4315-01 | Colorectum | colon adenocarcinoma | Male | <65 | I/II | Unknown | Unknown | SD | |
| BMT2 | SNV | Missense_Mutation | c.283N>T | p.Arg95Cys | p.R95C | Q1RMZ1 | protein_coding | deleterious(0) | probably_damaging(0.994) | TCGA-EI-6917-01 | Colorectum | rectum adenocarcinoma | Male | <65 | III/IV | Chemotherapy | 5fluorouracil+oxaciplatina+l-folinian | SD | |
| BMT2 | SNV | Missense_Mutation | rs778780309 | c.826A>G | p.Ile276Val | p.I276V | Q1RMZ1 | protein_coding | tolerated(0.13) | possibly_damaging(0.497) | TCGA-A5-A0G2-01 | Endometrium | uterine corpus endometrioid carcinoma | Female | <65 | III/IV | Unknown | Unknown | SD |
| BMT2 | SNV | Missense_Mutation | c.229G>A | p.Ala77Thr | p.A77T | Q1RMZ1 | protein_coding | deleterious(0) | probably_damaging(0.967) | TCGA-A5-A0G2-01 | Endometrium | uterine corpus endometrioid carcinoma | Female | <65 | III/IV | Unknown | Unknown | SD | |
| BMT2 | SNV | Missense_Mutation | rs376187358 | c.284N>A | p.Arg95His | p.R95H | Q1RMZ1 | protein_coding | deleterious(0) | probably_damaging(0.994) | TCGA-A5-A0GI-01 | Endometrium | uterine corpus endometrioid carcinoma | Female | <65 | I/II | Unknown | Unknown | SD |
| BMT2 | SNV | Missense_Mutation | novel | c.1208T>G | p.Leu403Arg | p.L403R | Q1RMZ1 | protein_coding | deleterious_low_confidence(0) | probably_damaging(0.994) | TCGA-A5-A1OF-01 | Endometrium | uterine corpus endometrioid carcinoma | Female | <65 | I/II | Unknown | Unknown | SD |
| BMT2 | SNV | Missense_Mutation | novel | c.92N>C | p.Leu31Pro | p.L31P | Q1RMZ1 | protein_coding | tolerated_low_confidence(0.26) | benign(0) | TCGA-AJ-A3EL-01 | Endometrium | uterine corpus endometrioid carcinoma | Female | <65 | I/II | Unknown | Unknown | SD |
| Page: 1 2 3 4 5 6 |
Top |
Related drugs of malignant transformation related genes |
| Identification of chemicals and drugs interact with genes involved in malignant transfromation |
| (DGIdb 4.0) |
| Entrez ID | Symbol | Category | Interaction Types | Drug Claim Name | Drug Name | PMIDs |
| Page: 1 |

Copyright 2023-Present -The University of Texas Health Science Center at Houston |