
|
|||||
|
 | |
| |
| |
| |
| |
| |
|
Gene: BMPR1B |
Gene summary for BMPR1B |
| Gene information | Species | Human | Gene symbol | BMPR1B | Gene ID | 658 |
| Gene name | bone morphogenetic protein receptor type 1B | |
| Gene Alias | ALK-6 | |
| Cytomap | 4q22.3 | |
| Gene Type | protein-coding | GO ID | GO:0000003 | UniProtAcc | O00238 |
Top |
Malignant transformation analysis |
| Identification of the aberrant gene expression in precancerous and cancerous lesions by comparing the gene expression of stem-like cells in diseased tissues with normal stem cells |
| Entrez ID | Symbol | Replicates | Species | Organ | Tissue | Adj P-value | Log2FC | Malignancy |
| 658 | BMPR1B | GSM4909286 | Human | Breast | IDC | 1.78e-08 | 1.70e-01 | 0.1081 |
| 658 | BMPR1B | GSM4909291 | Human | Breast | IDC | 4.69e-16 | 4.07e-01 | 0.1753 |
| 658 | BMPR1B | GSM4909301 | Human | Breast | IDC | 6.38e-36 | 7.33e-01 | 0.1577 |
| 658 | BMPR1B | GSM4909302 | Human | Breast | IDC | 1.58e-10 | 2.75e-01 | 0.1545 |
| 658 | BMPR1B | GSM4909303 | Human | Breast | IDC | 1.12e-03 | 2.34e-01 | 0.0438 |
| 658 | BMPR1B | GSM4909304 | Human | Breast | IDC | 3.01e-32 | 4.97e-01 | 0.1636 |
| 658 | BMPR1B | GSM4909307 | Human | Breast | IDC | 1.13e-55 | 8.88e-01 | 0.1569 |
| 658 | BMPR1B | GSM4909308 | Human | Breast | IDC | 2.11e-96 | 1.18e+00 | 0.158 |
| 658 | BMPR1B | GSM4909312 | Human | Breast | IDC | 8.25e-07 | 2.95e-01 | 0.1552 |
| 658 | BMPR1B | GSM4909313 | Human | Breast | IDC | 1.83e-24 | 7.77e-01 | 0.0391 |
| 658 | BMPR1B | GSM4909319 | Human | Breast | IDC | 3.04e-13 | 5.47e-01 | 0.1563 |
| 658 | BMPR1B | GSM4909321 | Human | Breast | IDC | 8.04e-10 | 3.33e-01 | 0.1559 |
| 658 | BMPR1B | M1 | Human | Breast | IDC | 6.78e-45 | 8.66e-01 | 0.1577 |
| 658 | BMPR1B | M5 | Human | Breast | IDC | 4.29e-35 | 1.39e+00 | 0.1598 |
| 658 | BMPR1B | NCCBC2 | Human | Breast | DCIS | 5.88e-04 | 4.92e-01 | 0.1554 |
| 658 | BMPR1B | P1 | Human | Breast | IDC | 4.94e-07 | 3.73e-01 | 0.1527 |
| 658 | BMPR1B | P3 | Human | Breast | IDC | 1.25e-20 | 9.68e-01 | 0.1542 |
| 658 | BMPR1B | H2 | Human | Cervix | HSIL_HPV | 1.27e-06 | 3.09e-01 | 0.0632 |
| 658 | BMPR1B | T2 | Human | Cervix | CC | 3.80e-04 | 4.36e-01 | 0.0709 |
| 658 | BMPR1B | AEH-subject1 | Human | Endometrium | AEH | 1.51e-75 | 1.17e+00 | -0.3059 |
| Page: 1 2 3 |
| Tissue | Expression Dynamics | Abbreviation |
| Breast | 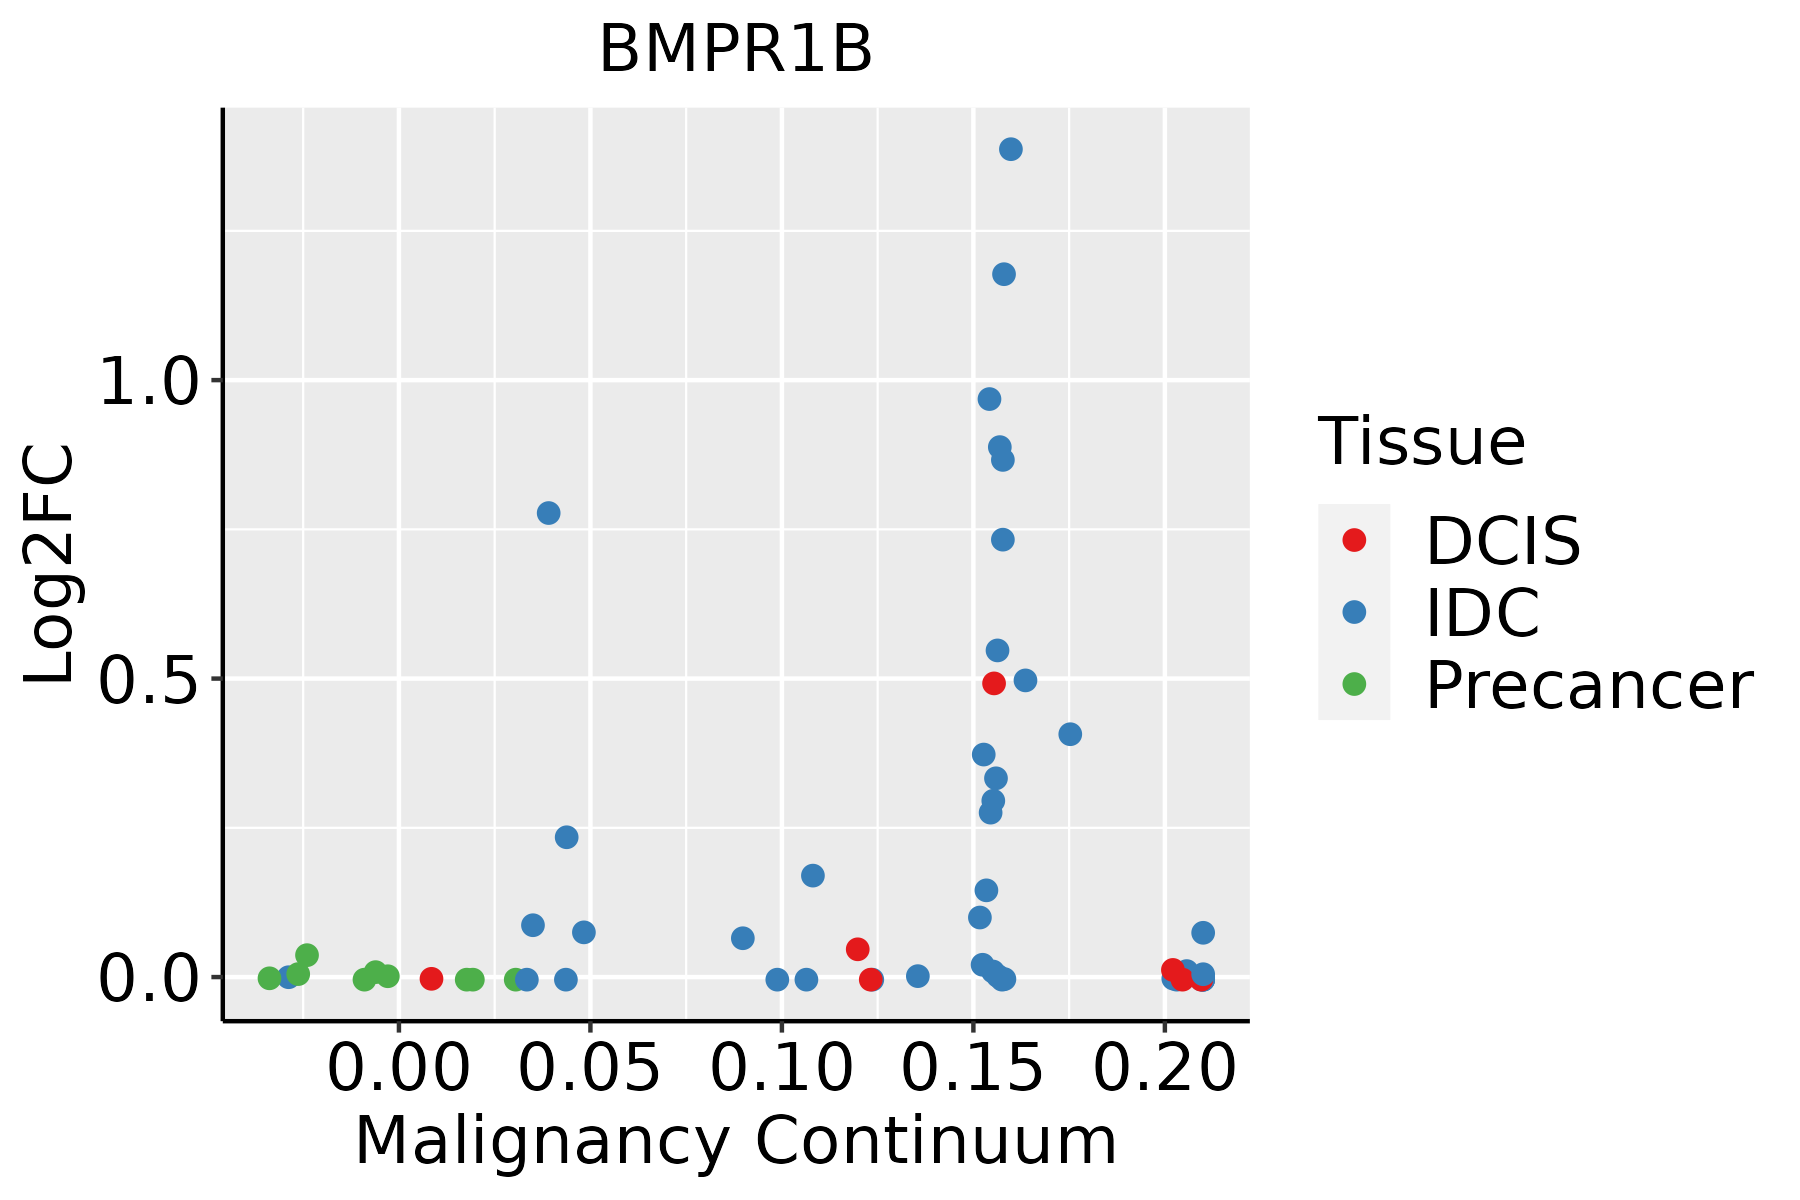 | IDC: Invasive ductal carcinoma |
| DCIS: Ductal carcinoma in situ | ||
| Precancer(BRCA1-mut): Precancerous lesion from BRCA1 mutation carriers | ||
| Cervix | 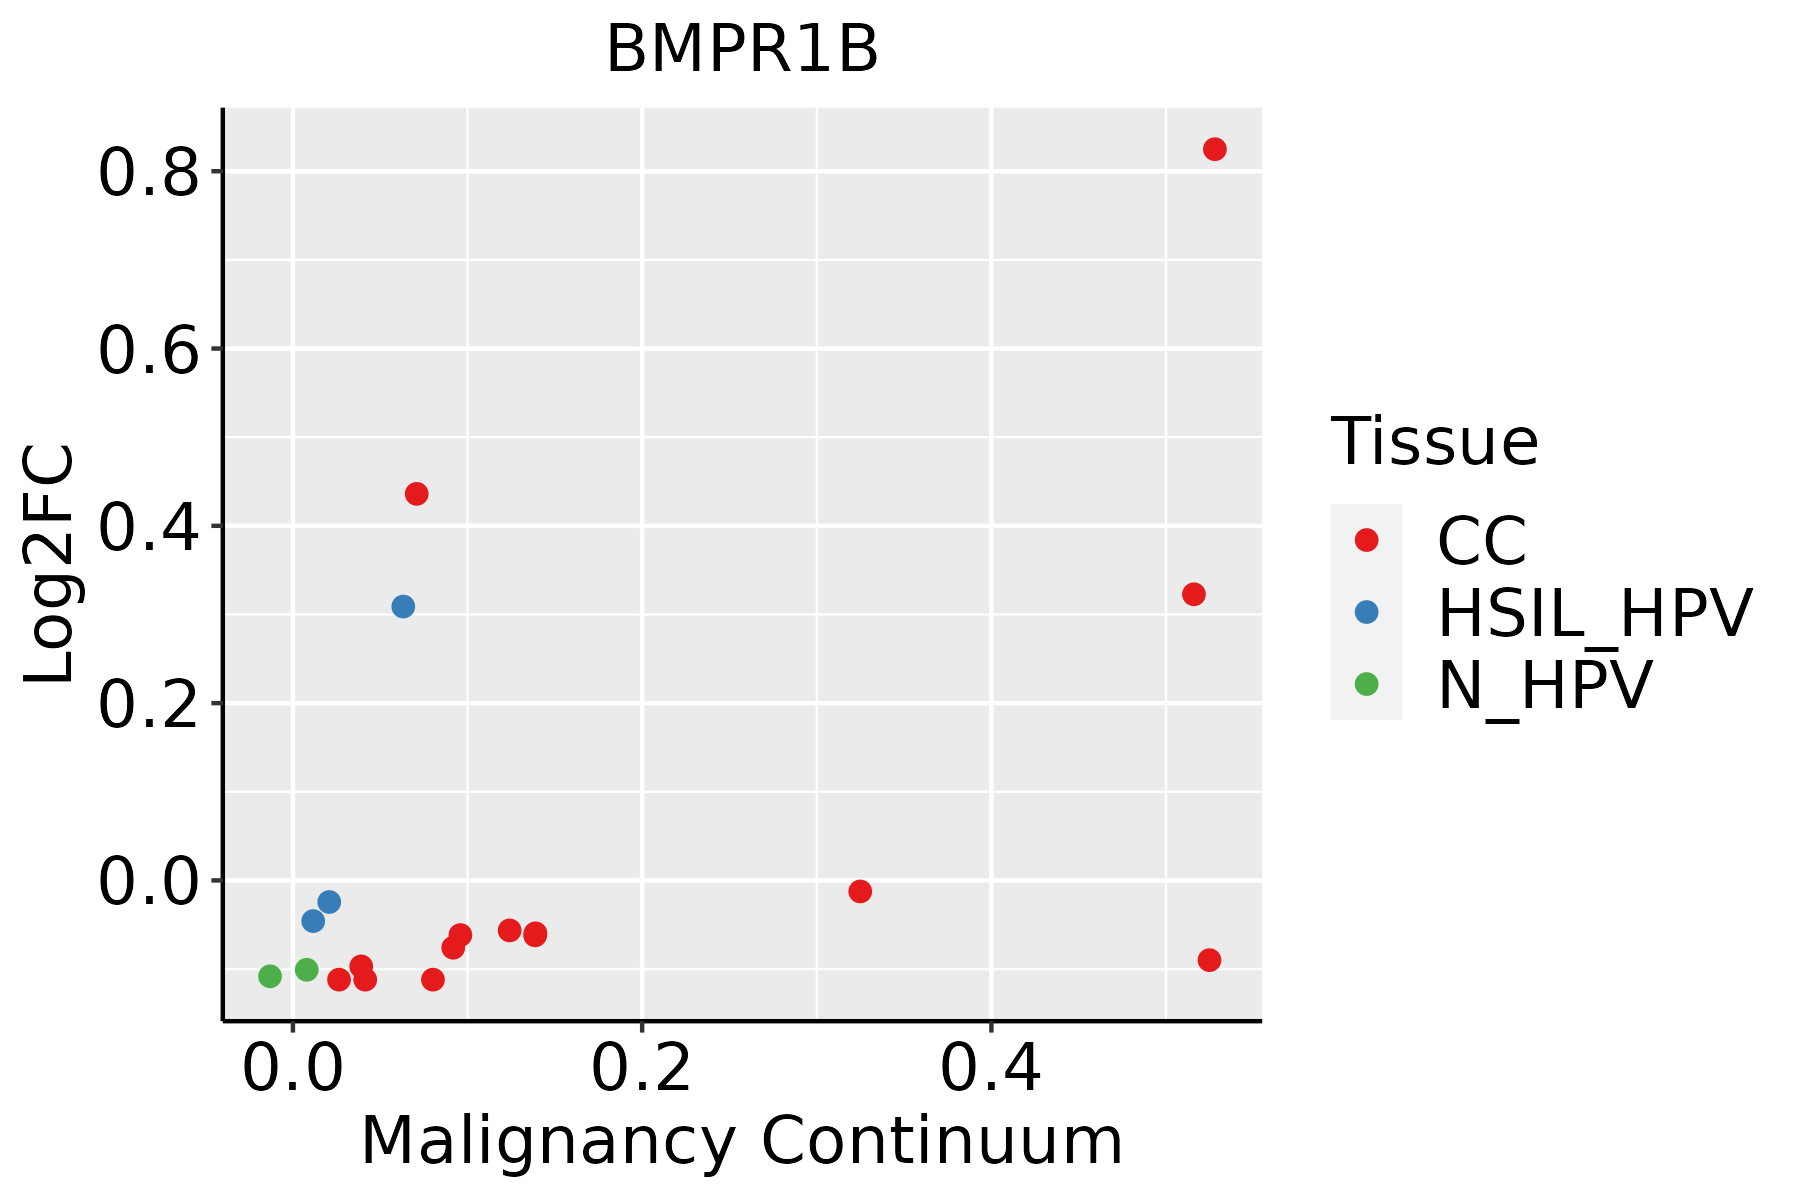 | CC: Cervix cancer |
| HSIL_HPV: HPV-infected high-grade squamous intraepithelial lesions | ||
| N_HPV: HPV-infected normal cervix | ||
| Endometrium | 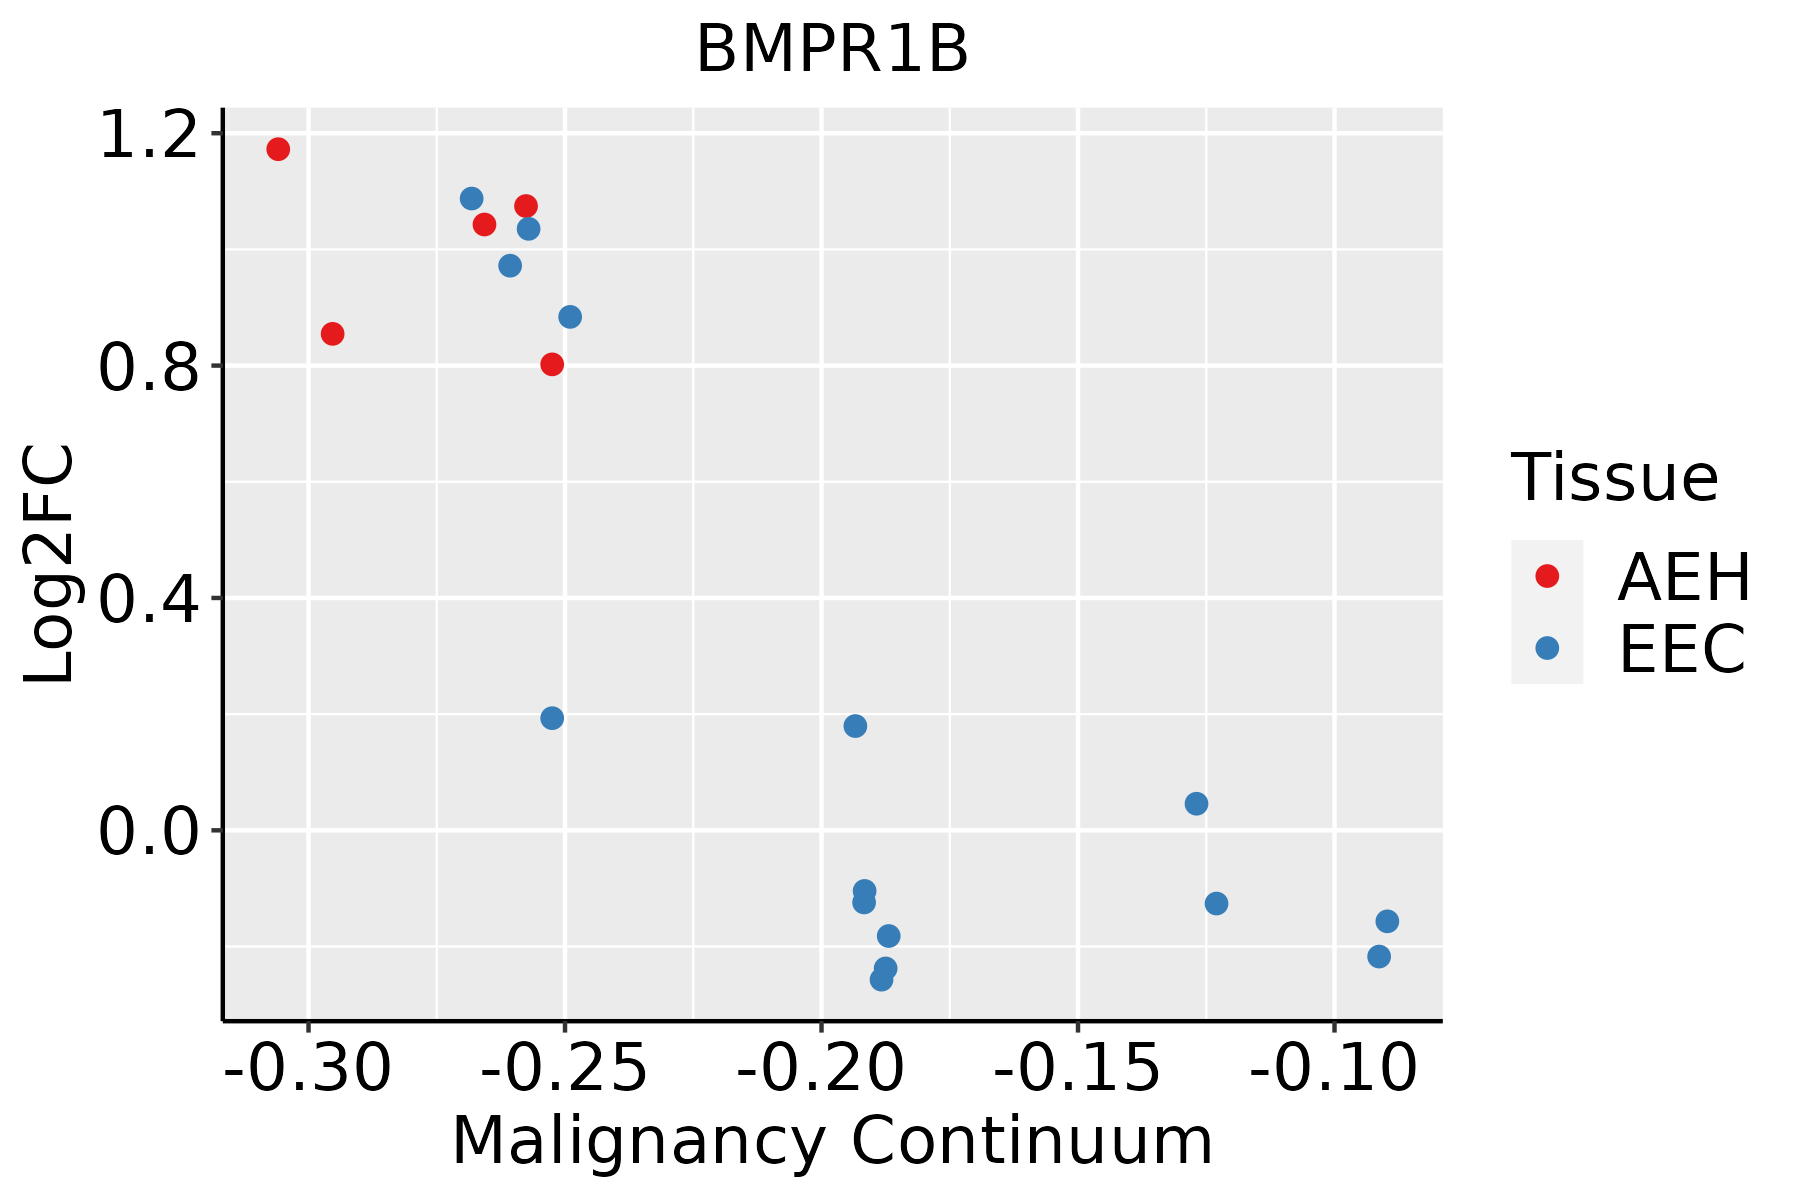 | AEH: Atypical endometrial hyperplasia |
| EEC: Endometrioid Cancer | ||
| Esophagus | 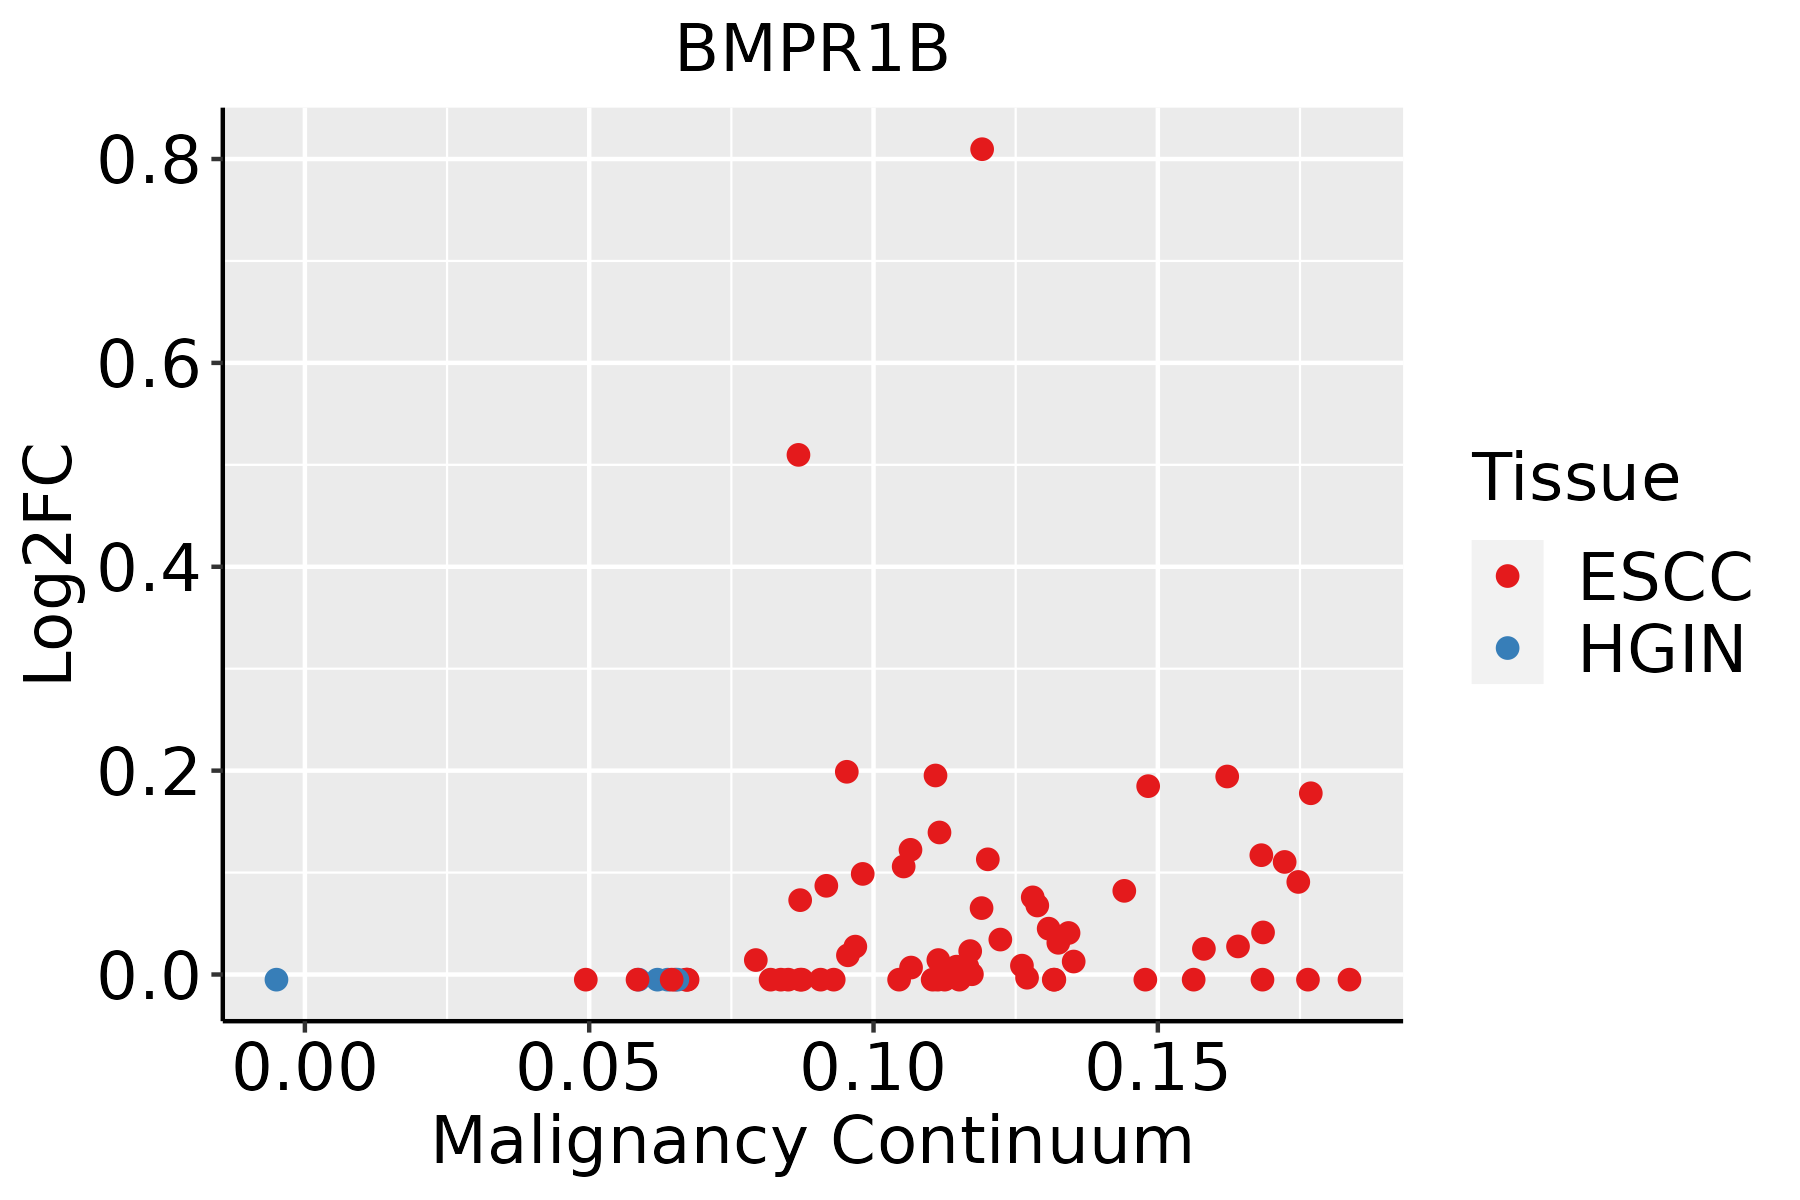 | ESCC: Esophageal squamous cell carcinoma |
| HGIN: High-grade intraepithelial neoplasias | ||
| LGIN: Low-grade intraepithelial neoplasias | ||
| Lung | 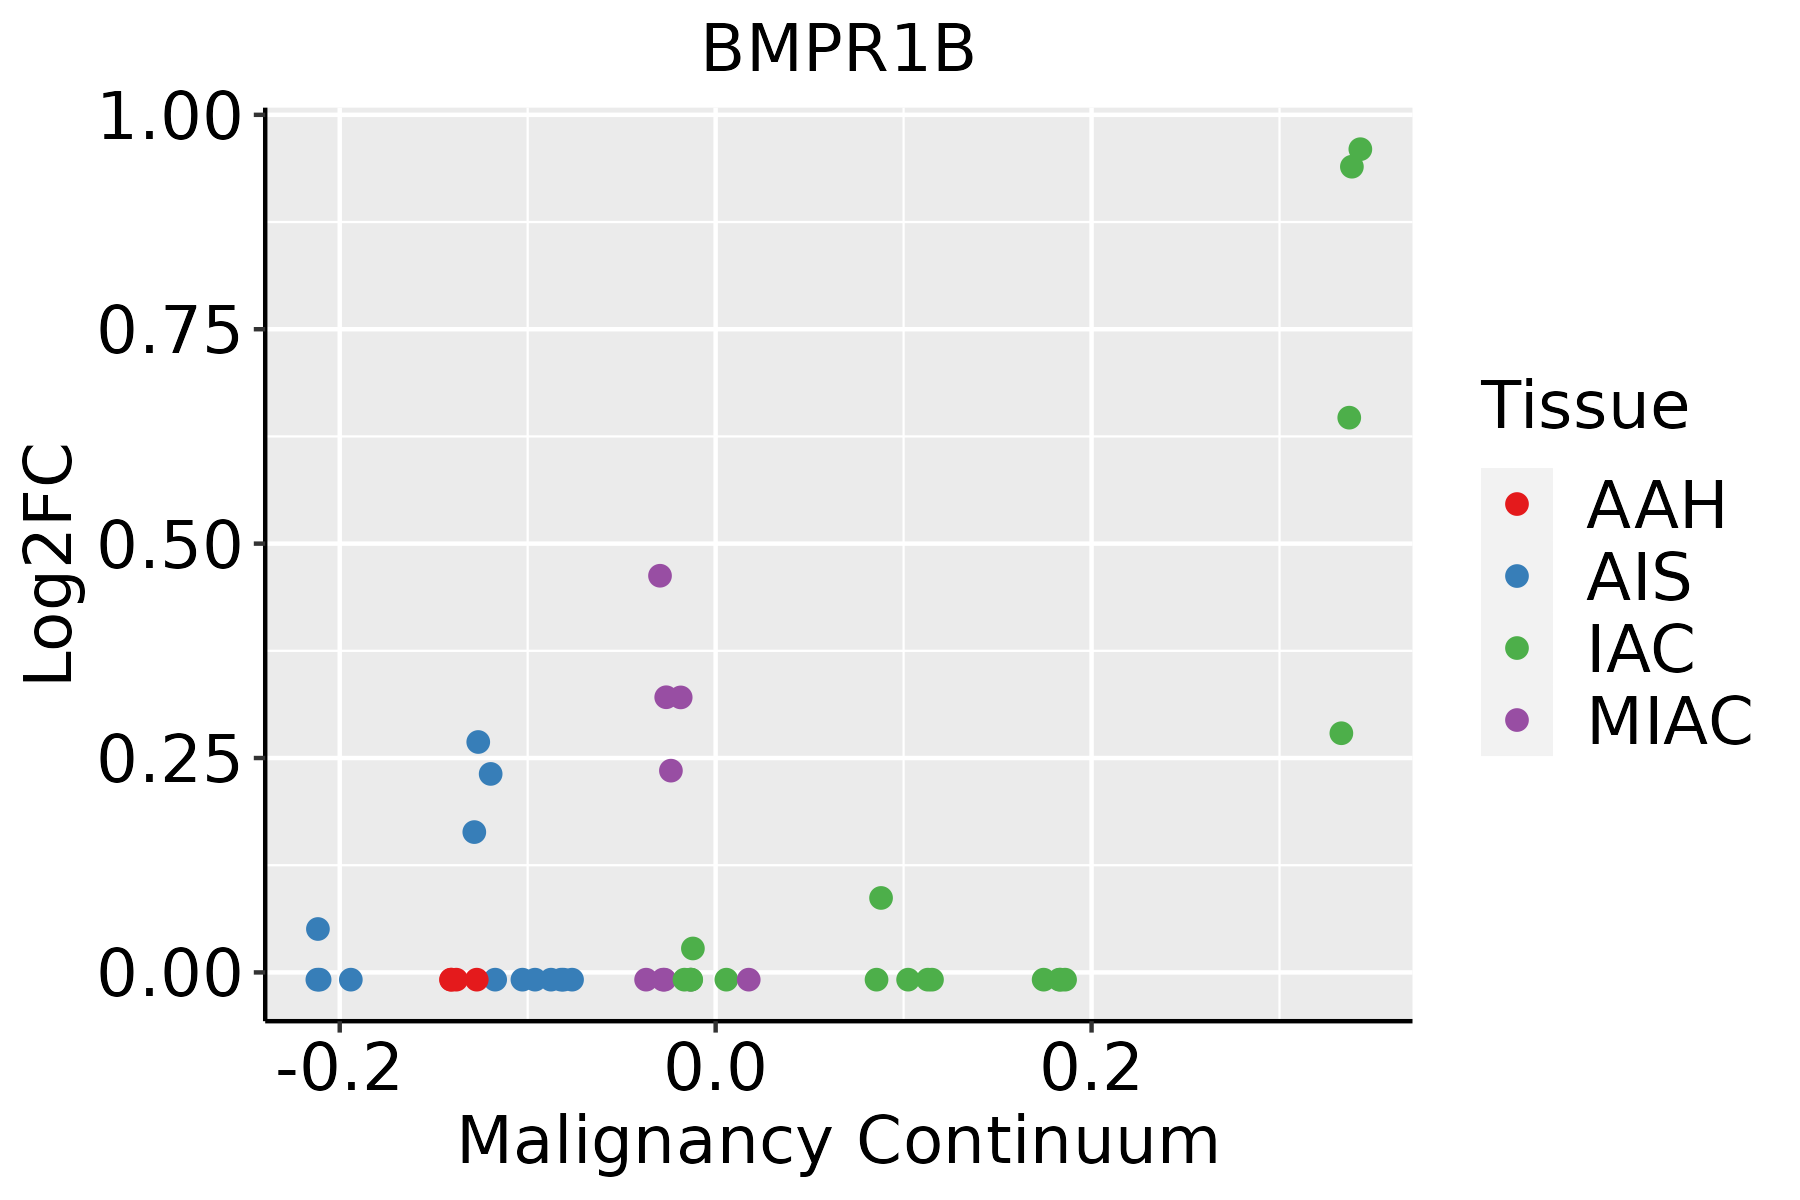 | AAH: Atypical adenomatous hyperplasia |
| AIS: Adenocarcinoma in situ | ||
| IAC: Invasive lung adenocarcinoma | ||
| MIA: Minimally invasive adenocarcinoma | ||
| Prostate |  | BPH: Benign Prostatic Hyperplasia |
| ∗log2FC in expression of this searched gene in stem-like cells from each diseased tissue sample relative to stem-like cells in normal samples in each tissue plotted against the malignancy continuum. Samples are colored based on if they are from different disease stage. |
Top |
Malignant transformation related pathway analysis |
| Find out the enriched GO biological processes and KEGG pathways involved in transition from healthy to precancer to cancer |
| Tissue | Disease Stage | Enriched GO biological Processes |
| Colorectum | AD |  |
| Colorectum | SER |  |
| Colorectum | MSS |  |
| Colorectum | MSI-H |  |
| Colorectum | FAP |  |
| ∗Top 15 enriched GO BP terms are showed in the bar plot of each disease state in each tissue. Each row represents a significant GO biological process which is colored according to the -log10(p.adjust). |
| Page: 1 2 3 4 5 6 7 8 9 |
| GO ID | Tissue | Disease Stage | Description | Gene Ratio | Bg Ratio | pvalue | p.adjust | Count |
| GO:200123314 | Breast | IDC | regulation of apoptotic signaling pathway | 82/1434 | 356/18723 | 6.27e-20 | 5.93e-17 | 82 |
| GO:200123514 | Breast | IDC | positive regulation of apoptotic signaling pathway | 31/1434 | 126/18723 | 4.13e-09 | 3.35e-07 | 31 |
| GO:009719114 | Breast | IDC | extrinsic apoptotic signaling pathway | 42/1434 | 219/18723 | 2.56e-08 | 1.73e-06 | 42 |
| GO:200123614 | Breast | IDC | regulation of extrinsic apoptotic signaling pathway | 32/1434 | 151/18723 | 1.07e-07 | 6.26e-06 | 32 |
| GO:004860812 | Breast | IDC | reproductive structure development | 60/1434 | 424/18723 | 2.71e-06 | 1.03e-04 | 60 |
| GO:006145813 | Breast | IDC | reproductive system development | 60/1434 | 427/18723 | 3.41e-06 | 1.24e-04 | 60 |
| GO:000164912 | Breast | IDC | osteoblast differentiation | 35/1434 | 229/18723 | 6.64e-05 | 1.35e-03 | 35 |
| GO:20012385 | Breast | IDC | positive regulation of extrinsic apoptotic signaling pathway | 12/1434 | 48/18723 | 2.03e-04 | 3.32e-03 | 12 |
| GO:0008406 | Breast | IDC | gonad development | 32/1434 | 221/18723 | 3.64e-04 | 5.23e-03 | 32 |
| GO:0045137 | Breast | IDC | development of primary sexual characteristics | 32/1434 | 227/18723 | 5.85e-04 | 7.44e-03 | 32 |
| GO:000150311 | Breast | IDC | ossification | 50/1434 | 408/18723 | 6.51e-04 | 8.04e-03 | 50 |
| GO:190204112 | Breast | IDC | regulation of extrinsic apoptotic signaling pathway via death domain receptors | 11/1434 | 49/18723 | 9.88e-04 | 1.11e-02 | 11 |
| GO:00485117 | Breast | IDC | rhythmic process | 38/1434 | 298/18723 | 1.34e-03 | 1.39e-02 | 38 |
| GO:19020432 | Breast | IDC | positive regulation of extrinsic apoptotic signaling pathway via death domain receptors | 5/1434 | 13/18723 | 2.00e-03 | 1.90e-02 | 5 |
| GO:0007548 | Breast | IDC | sex differentiation | 35/1434 | 276/18723 | 2.23e-03 | 2.07e-02 | 35 |
| GO:200123324 | Breast | DCIS | regulation of apoptotic signaling pathway | 81/1390 | 356/18723 | 3.51e-20 | 3.31e-17 | 81 |
| GO:200123523 | Breast | DCIS | positive regulation of apoptotic signaling pathway | 31/1390 | 126/18723 | 1.96e-09 | 1.76e-07 | 31 |
| GO:009719123 | Breast | DCIS | extrinsic apoptotic signaling pathway | 40/1390 | 219/18723 | 9.43e-08 | 5.28e-06 | 40 |
| GO:200123623 | Breast | DCIS | regulation of extrinsic apoptotic signaling pathway | 31/1390 | 151/18723 | 1.79e-07 | 9.04e-06 | 31 |
| GO:004860821 | Breast | DCIS | reproductive structure development | 57/1390 | 424/18723 | 9.06e-06 | 2.45e-04 | 57 |
| Page: 1 2 3 4 5 6 7 8 9 10 11 12 13 14 |
| Pathway ID | Tissue | Disease Stage | Description | Gene Ratio | Bg Ratio | pvalue | p.adjust | qvalue | Count |
| hsa0541824 | Breast | IDC | Fluid shear stress and atherosclerosis | 34/867 | 139/8465 | 9.41e-07 | 1.61e-05 | 1.20e-05 | 34 |
| hsa0541834 | Breast | IDC | Fluid shear stress and atherosclerosis | 34/867 | 139/8465 | 9.41e-07 | 1.61e-05 | 1.20e-05 | 34 |
| hsa0541844 | Breast | DCIS | Fluid shear stress and atherosclerosis | 34/846 | 139/8465 | 5.31e-07 | 9.03e-06 | 6.65e-06 | 34 |
| hsa0541854 | Breast | DCIS | Fluid shear stress and atherosclerosis | 34/846 | 139/8465 | 5.31e-07 | 9.03e-06 | 6.65e-06 | 34 |
| hsa0541825 | Cervix | HSIL_HPV | Fluid shear stress and atherosclerosis | 16/459 | 139/8465 | 3.41e-03 | 2.08e-02 | 1.68e-02 | 16 |
| hsa0541835 | Cervix | HSIL_HPV | Fluid shear stress and atherosclerosis | 16/459 | 139/8465 | 3.41e-03 | 2.08e-02 | 1.68e-02 | 16 |
| hsa0541826 | Endometrium | AEH | Fluid shear stress and atherosclerosis | 43/1197 | 139/8465 | 2.47e-07 | 3.49e-06 | 2.55e-06 | 43 |
| hsa043909 | Endometrium | AEH | Hippo signaling pathway | 38/1197 | 157/8465 | 4.79e-04 | 3.38e-03 | 2.47e-03 | 38 |
| hsa043504 | Endometrium | AEH | TGF-beta signaling pathway | 26/1197 | 108/8465 | 3.82e-03 | 2.18e-02 | 1.59e-02 | 26 |
| hsa0436010 | Endometrium | AEH | Axon guidance | 39/1197 | 182/8465 | 4.47e-03 | 2.46e-02 | 1.80e-02 | 39 |
| hsa05418112 | Endometrium | AEH | Fluid shear stress and atherosclerosis | 43/1197 | 139/8465 | 2.47e-07 | 3.49e-06 | 2.55e-06 | 43 |
| hsa0439014 | Endometrium | AEH | Hippo signaling pathway | 38/1197 | 157/8465 | 4.79e-04 | 3.38e-03 | 2.47e-03 | 38 |
| hsa0435011 | Endometrium | AEH | TGF-beta signaling pathway | 26/1197 | 108/8465 | 3.82e-03 | 2.18e-02 | 1.59e-02 | 26 |
| hsa0436013 | Endometrium | AEH | Axon guidance | 39/1197 | 182/8465 | 4.47e-03 | 2.46e-02 | 1.80e-02 | 39 |
| hsa0541827 | Endometrium | EEC | Fluid shear stress and atherosclerosis | 45/1237 | 139/8465 | 7.76e-08 | 1.22e-06 | 9.07e-07 | 45 |
| hsa0439023 | Endometrium | EEC | Hippo signaling pathway | 39/1237 | 157/8465 | 4.54e-04 | 3.47e-03 | 2.59e-03 | 39 |
| hsa043502 | Endometrium | EEC | TGF-beta signaling pathway | 26/1237 | 108/8465 | 5.95e-03 | 3.12e-02 | 2.33e-02 | 26 |
| hsa0436022 | Endometrium | EEC | Axon guidance | 39/1237 | 182/8465 | 7.78e-03 | 3.66e-02 | 2.73e-02 | 39 |
| hsa0541836 | Endometrium | EEC | Fluid shear stress and atherosclerosis | 45/1237 | 139/8465 | 7.76e-08 | 1.22e-06 | 9.07e-07 | 45 |
| hsa0439033 | Endometrium | EEC | Hippo signaling pathway | 39/1237 | 157/8465 | 4.54e-04 | 3.47e-03 | 2.59e-03 | 39 |
| Page: 1 2 3 |
Top |
Cell-cell communication analysis |
| Identification of potential cell-cell interactions between two cell types and their ligand-receptor pairs for different disease states |
| Ligand | Receptor | LRpair | Pathway | Tissue | Disease Stage |
| BMP7 | BMPR1B_ACVR2A | BMP7_BMPR1B_ACVR2A | BMP | Cervix | CC |
| BMP7 | BMPR1B_BMPR2 | BMP7_BMPR1B_BMPR2 | BMP | Cervix | CC |
| GDF7 | BMPR1B_BMPR2 | GDF7_BMPR1B_BMPR2 | BMP | Endometrium | ADJ |
| BMP8A | BMPR1B_BMPR2 | BMP8A_BMPR1B_BMPR2 | BMP | Endometrium | ADJ |
| BMP2 | BMPR1B_BMPR2 | BMP2_BMPR1B_BMPR2 | BMP | Endometrium | AEH |
| BMP7 | BMPR1B_BMPR2 | BMP7_BMPR1B_BMPR2 | BMP | Endometrium | AEH |
| GDF7 | BMPR1B_ACVR2B | GDF7_BMPR1B_ACVR2B | BMP | Endometrium | Healthy |
| BMP5 | BMPR1B_ACVR2A | BMP5_BMPR1B_ACVR2A | BMP | Liver | Healthy |
| BMP5 | BMPR1B_ACVR2B | BMP5_BMPR1B_ACVR2B | BMP | Liver | Healthy |
| BMP5 | BMPR1B_BMPR2 | BMP5_BMPR1B_BMPR2 | BMP | Liver | Healthy |
| BMP6 | BMPR1B_ACVR2A | BMP6_BMPR1B_ACVR2A | BMP | Liver | Healthy |
| BMP6 | BMPR1B_ACVR2B | BMP6_BMPR1B_ACVR2B | BMP | Liver | Healthy |
| BMP6 | BMPR1B_BMPR2 | BMP6_BMPR1B_BMPR2 | BMP | Liver | Healthy |
| BMP4 | BMPR1B_ACVR2A | BMP4_BMPR1B_ACVR2A | BMP | Liver | Precancer |
| BMP4 | BMPR1B_BMPR2 | BMP4_BMPR1B_BMPR2 | BMP | Liver | Precancer |
| BMP5 | BMPR1B_ACVR2A | BMP5_BMPR1B_ACVR2A | BMP | Liver | Precancer |
| BMP5 | BMPR1B_BMPR2 | BMP5_BMPR1B_BMPR2 | BMP | Liver | Precancer |
| BMP6 | BMPR1B_ACVR2A | BMP6_BMPR1B_ACVR2A | BMP | Liver | Precancer |
| BMP6 | BMPR1B_BMPR2 | BMP6_BMPR1B_BMPR2 | BMP | Liver | Precancer |
| BMP2 | BMPR1B_BMPR2 | BMP2_BMPR1B_BMPR2 | BMP | Lung | AAH |
| Page: 1 |
Top |
Single-cell gene regulatory network inference analysis |
| Find out the significant the regulons (TFs) and the target genes of each regulon across cell types for different disease states |
| TF | Cell Type | Tissue | Disease Stage | Target Gene | RSS | Regulon Activity |
| ∗The dot plots of a searched regulon are shown for all cell subpopulations in each disease state of each tissue based on the regulon specific score inferred using pySCENIC and by calculating the average expression. |
| Page: 1 |
Top |
Somatic mutation of malignant transformation related genes |
| Annotation of somatic variants for genes involved in malignant transformation |
| Hugo Symbol | Variant Class | Variant Classification | dbSNP RS | HGVSc | HGVSp | HGVSp Short | SWISSPROT | BIOTYPE | SIFT | PolyPhen | Tumor Sample Barcode | Tissue | Histology | Sex | Age | Stage | Therapy Types | Drugs | Outcome |
| BMPR1B | SNV | Missense_Mutation | c.283N>T | p.Pro95Ser | p.P95S | O00238 | protein_coding | tolerated(0.54) | benign(0.297) | TCGA-A2-A0YG-01 | Breast | breast invasive carcinoma | Female | <65 | III/IV | Chemotherapy | cytoxan | SD | |
| BMPR1B | SNV | Missense_Mutation | c.527G>A | p.Cys176Tyr | p.C176Y | O00238 | protein_coding | tolerated(0.14) | benign(0) | TCGA-A8-A09Z-01 | Breast | breast invasive carcinoma | Female | >=65 | I/II | Unknown | Unknown | SD | |
| BMPR1B | SNV | Missense_Mutation | c.620N>A | p.Arg207Lys | p.R207K | O00238 | protein_coding | tolerated(1) | benign(0) | TCGA-AC-A23H-01 | Breast | breast invasive carcinoma | Female | >=65 | I/II | Unknown | Unknown | PD | |
| BMPR1B | SNV | Missense_Mutation | novel | c.967N>C | p.Ser323Pro | p.S323P | O00238 | protein_coding | tolerated(0.23) | benign(0.313) | TCGA-E9-A1RC-01 | Breast | breast invasive carcinoma | Female | <65 | III/IV | Hormone Therapy | tamoxiphen | SD |
| BMPR1B | SNV | Missense_Mutation | novel | c.1105C>G | p.Leu369Val | p.L369V | O00238 | protein_coding | deleterious(0) | probably_damaging(0.989) | TCGA-OL-A66L-01 | Breast | breast invasive carcinoma | Female | >=65 | I/II | Unknown | Unknown | SD |
| BMPR1B | insertion | Frame_Shift_Ins | novel | c.689_690dupTA | p.Ala231Ter | p.A231* | O00238 | protein_coding | TCGA-E9-A2JS-01 | Breast | breast invasive carcinoma | Female | >=65 | I/II | Chemotherapy | cyclophosphamide | PD | ||
| BMPR1B | SNV | Missense_Mutation | novel | c.1554N>T | p.Lys518Asn | p.K518N | O00238 | protein_coding | deleterious(0) | probably_damaging(0.998) | TCGA-MA-AA3Z-01 | Cervix | cervical & endocervical cancer | Female | <65 | I/II | Unknown | Unknown | SD |
| BMPR1B | SNV | Missense_Mutation | rs758706811 | c.166N>T | p.Arg56Cys | p.R56C | O00238 | protein_coding | tolerated(0.11) | benign(0.007) | TCGA-AA-3664-01 | Colorectum | colon adenocarcinoma | Female | >=65 | I/II | Unknown | Unknown | SD |
| BMPR1B | SNV | Missense_Mutation | c.248G>T | p.Cys83Phe | p.C83F | O00238 | protein_coding | deleterious(0) | probably_damaging(1) | TCGA-AA-3713-01 | Colorectum | colon adenocarcinoma | Male | >=65 | III/IV | Chemotherapy | 5-fluorouracil | PR | |
| BMPR1B | SNV | Missense_Mutation | c.1034N>C | p.Leu345Ser | p.L345S | O00238 | protein_coding | deleterious(0) | probably_damaging(1) | TCGA-AA-3833-01 | Colorectum | colon adenocarcinoma | Female | <65 | I/II | Unknown | Unknown | SD |
| Page: 1 2 3 4 5 6 |
Top |
Related drugs of malignant transformation related genes |
| Identification of chemicals and drugs interact with genes involved in malignant transfromation |
| (DGIdb 4.0) |
| Entrez ID | Symbol | Category | Interaction Types | Drug Claim Name | Drug Name | PMIDs |
| 658 | BMPR1B | DRUGGABLE GENOME, CELL SURFACE, ENZYME, KINASE, SERINE THREONINE KINASE | inhibitor | 249565824 | ||
| 658 | BMPR1B | DRUGGABLE GENOME, CELL SURFACE, ENZYME, KINASE, SERINE THREONINE KINASE | inhibitor | 223366128 | GALUNISERTIB | |
| 658 | BMPR1B | DRUGGABLE GENOME, CELL SURFACE, ENZYME, KINASE, SERINE THREONINE KINASE | inhibitor | 249565800 | ||
| 658 | BMPR1B | DRUGGABLE GENOME, CELL SURFACE, ENZYME, KINASE, SERINE THREONINE KINASE | inhibitor | 249565835 |
| Page: 1 |

Copyright 2023-Present -The University of Texas Health Science Center at Houston |