
|
|||||
|
 | |
| |
| |
| |
| |
| |
|
Gene: BMPR1A |
Gene summary for BMPR1A |
| Gene information | Species | Human | Gene symbol | BMPR1A | Gene ID | 657 |
| Gene name | bone morphogenetic protein receptor type 1A | |
| Gene Alias | 10q23del | |
| Cytomap | 10q23.2 | |
| Gene Type | protein-coding | GO ID | GO:0000003 | UniProtAcc | P36894 |
Top |
Malignant transformation analysis |
| Identification of the aberrant gene expression in precancerous and cancerous lesions by comparing the gene expression of stem-like cells in diseased tissues with normal stem cells |
| Entrez ID | Symbol | Replicates | Species | Organ | Tissue | Adj P-value | Log2FC | Malignancy |
| 657 | BMPR1A | CCI_1 | Human | Cervix | CC | 1.95e-04 | 5.46e-01 | 0.528 |
| 657 | BMPR1A | CCI_2 | Human | Cervix | CC | 6.52e-04 | 7.77e-01 | 0.5249 |
| 657 | BMPR1A | CCI_3 | Human | Cervix | CC | 3.18e-02 | 3.94e-01 | 0.516 |
| 657 | BMPR1A | HTA11_3410_2000001011 | Human | Colorectum | AD | 1.50e-07 | -4.03e-01 | 0.0155 |
| 657 | BMPR1A | HTA11_83_2000001011 | Human | Colorectum | SER | 9.73e-04 | -2.39e-01 | -0.1526 |
| 657 | BMPR1A | HTA11_5212_2000001011 | Human | Colorectum | AD | 1.67e-02 | -5.75e-01 | -0.2061 |
| 657 | BMPR1A | HTA11_7696_3000711011 | Human | Colorectum | AD | 2.08e-04 | -2.85e-01 | 0.0674 |
| 657 | BMPR1A | HTA11_99999974143_84620 | Human | Colorectum | MSS | 6.33e-09 | -4.33e-01 | 0.3005 |
| 657 | BMPR1A | A001-C-207 | Human | Colorectum | FAP | 3.52e-02 | -3.04e-01 | 0.1278 |
| 657 | BMPR1A | A015-C-203 | Human | Colorectum | FAP | 1.52e-31 | -5.15e-01 | -0.1294 |
| 657 | BMPR1A | A015-C-204 | Human | Colorectum | FAP | 1.45e-05 | -2.90e-01 | -0.0228 |
| 657 | BMPR1A | A014-C-040 | Human | Colorectum | FAP | 3.34e-02 | -1.10e-01 | -0.1184 |
| 657 | BMPR1A | A002-C-201 | Human | Colorectum | FAP | 2.11e-13 | -4.52e-01 | 0.0324 |
| 657 | BMPR1A | A002-C-203 | Human | Colorectum | FAP | 1.67e-02 | -1.33e-01 | 0.2786 |
| 657 | BMPR1A | A001-C-119 | Human | Colorectum | FAP | 3.18e-11 | -5.76e-01 | -0.1557 |
| 657 | BMPR1A | A001-C-108 | Human | Colorectum | FAP | 3.66e-21 | -3.77e-01 | -0.0272 |
| 657 | BMPR1A | A002-C-205 | Human | Colorectum | FAP | 1.69e-18 | -4.09e-01 | -0.1236 |
| 657 | BMPR1A | A001-C-104 | Human | Colorectum | FAP | 4.87e-04 | -2.73e-01 | 0.0184 |
| 657 | BMPR1A | A015-C-006 | Human | Colorectum | FAP | 1.47e-13 | -5.33e-01 | -0.0994 |
| 657 | BMPR1A | A015-C-106 | Human | Colorectum | FAP | 3.87e-14 | -3.58e-01 | -0.0511 |
| Page: 1 2 3 4 5 6 |
| Tissue | Expression Dynamics | Abbreviation |
| Cervix | 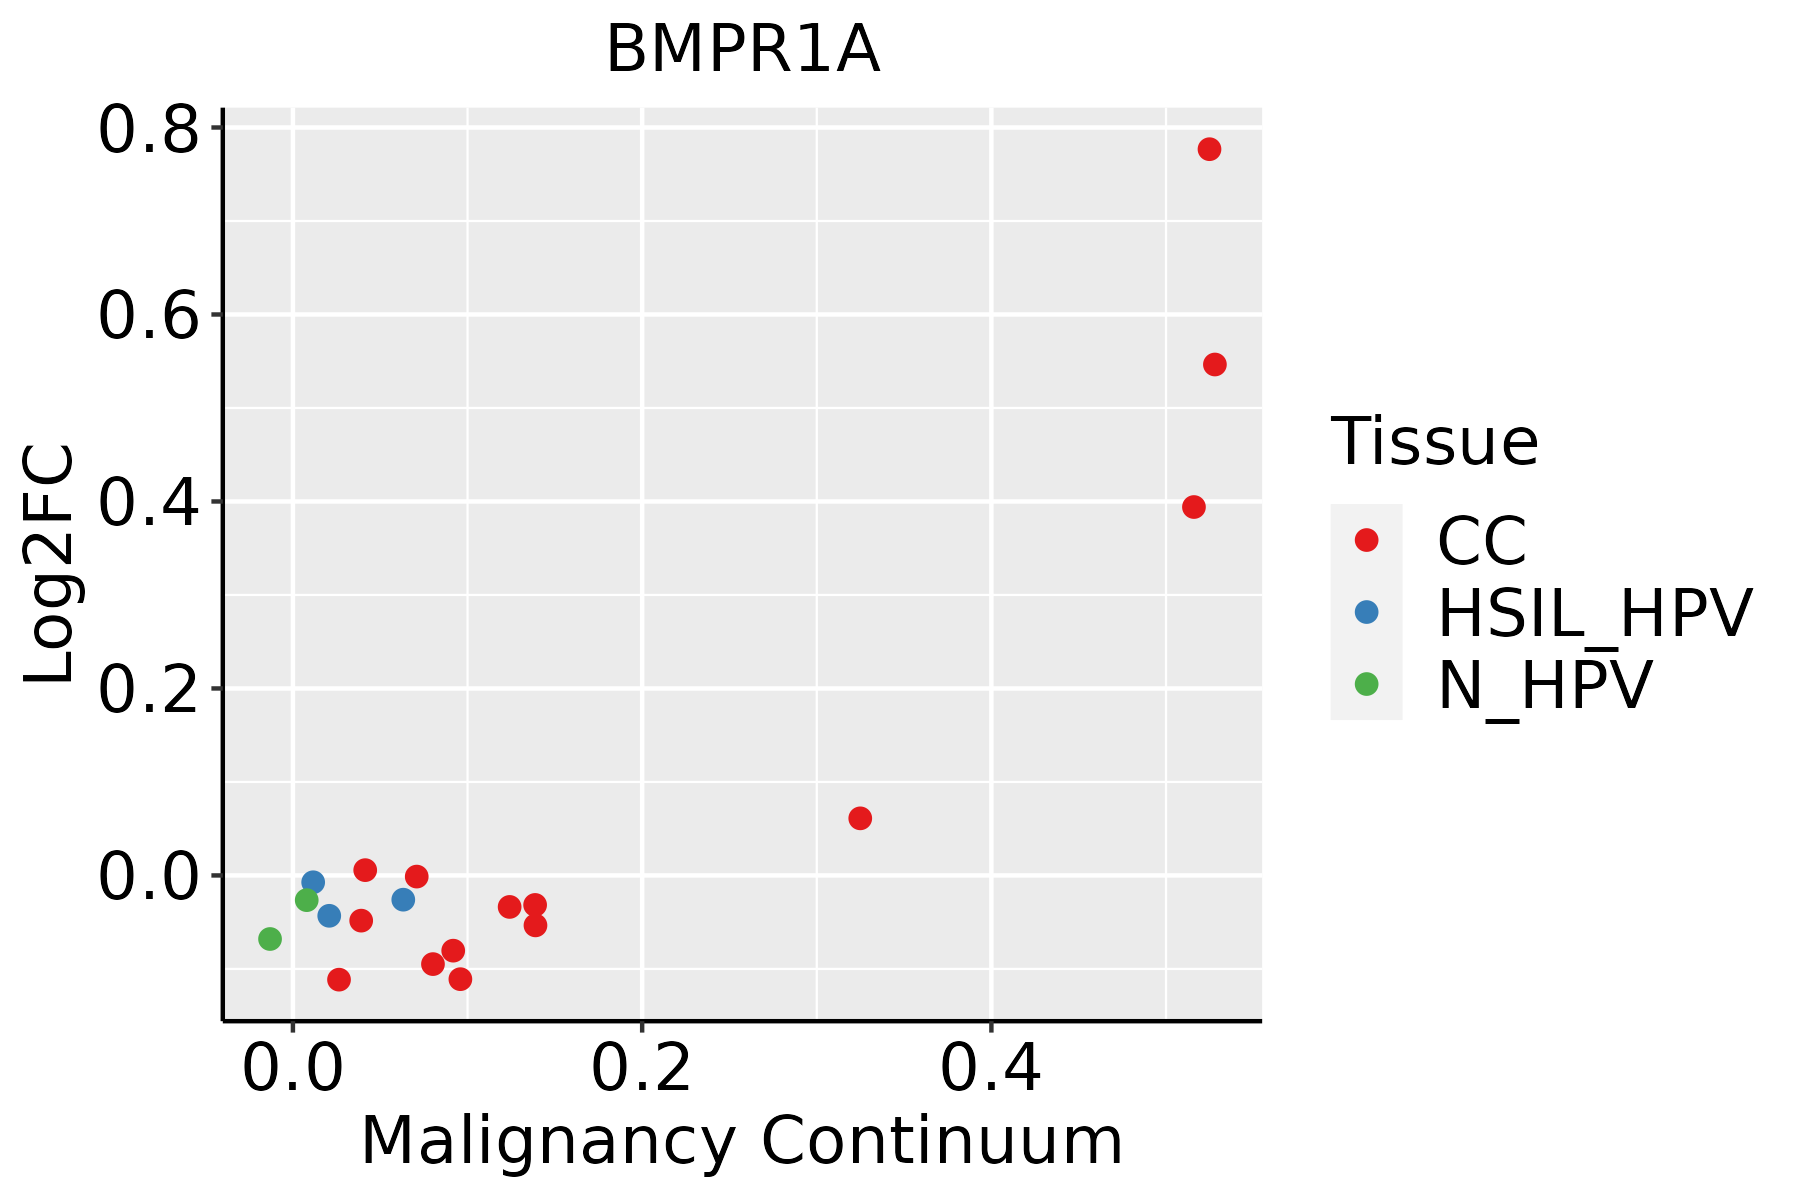 | CC: Cervix cancer |
| HSIL_HPV: HPV-infected high-grade squamous intraepithelial lesions | ||
| N_HPV: HPV-infected normal cervix | ||
| Colorectum (GSE201348) | 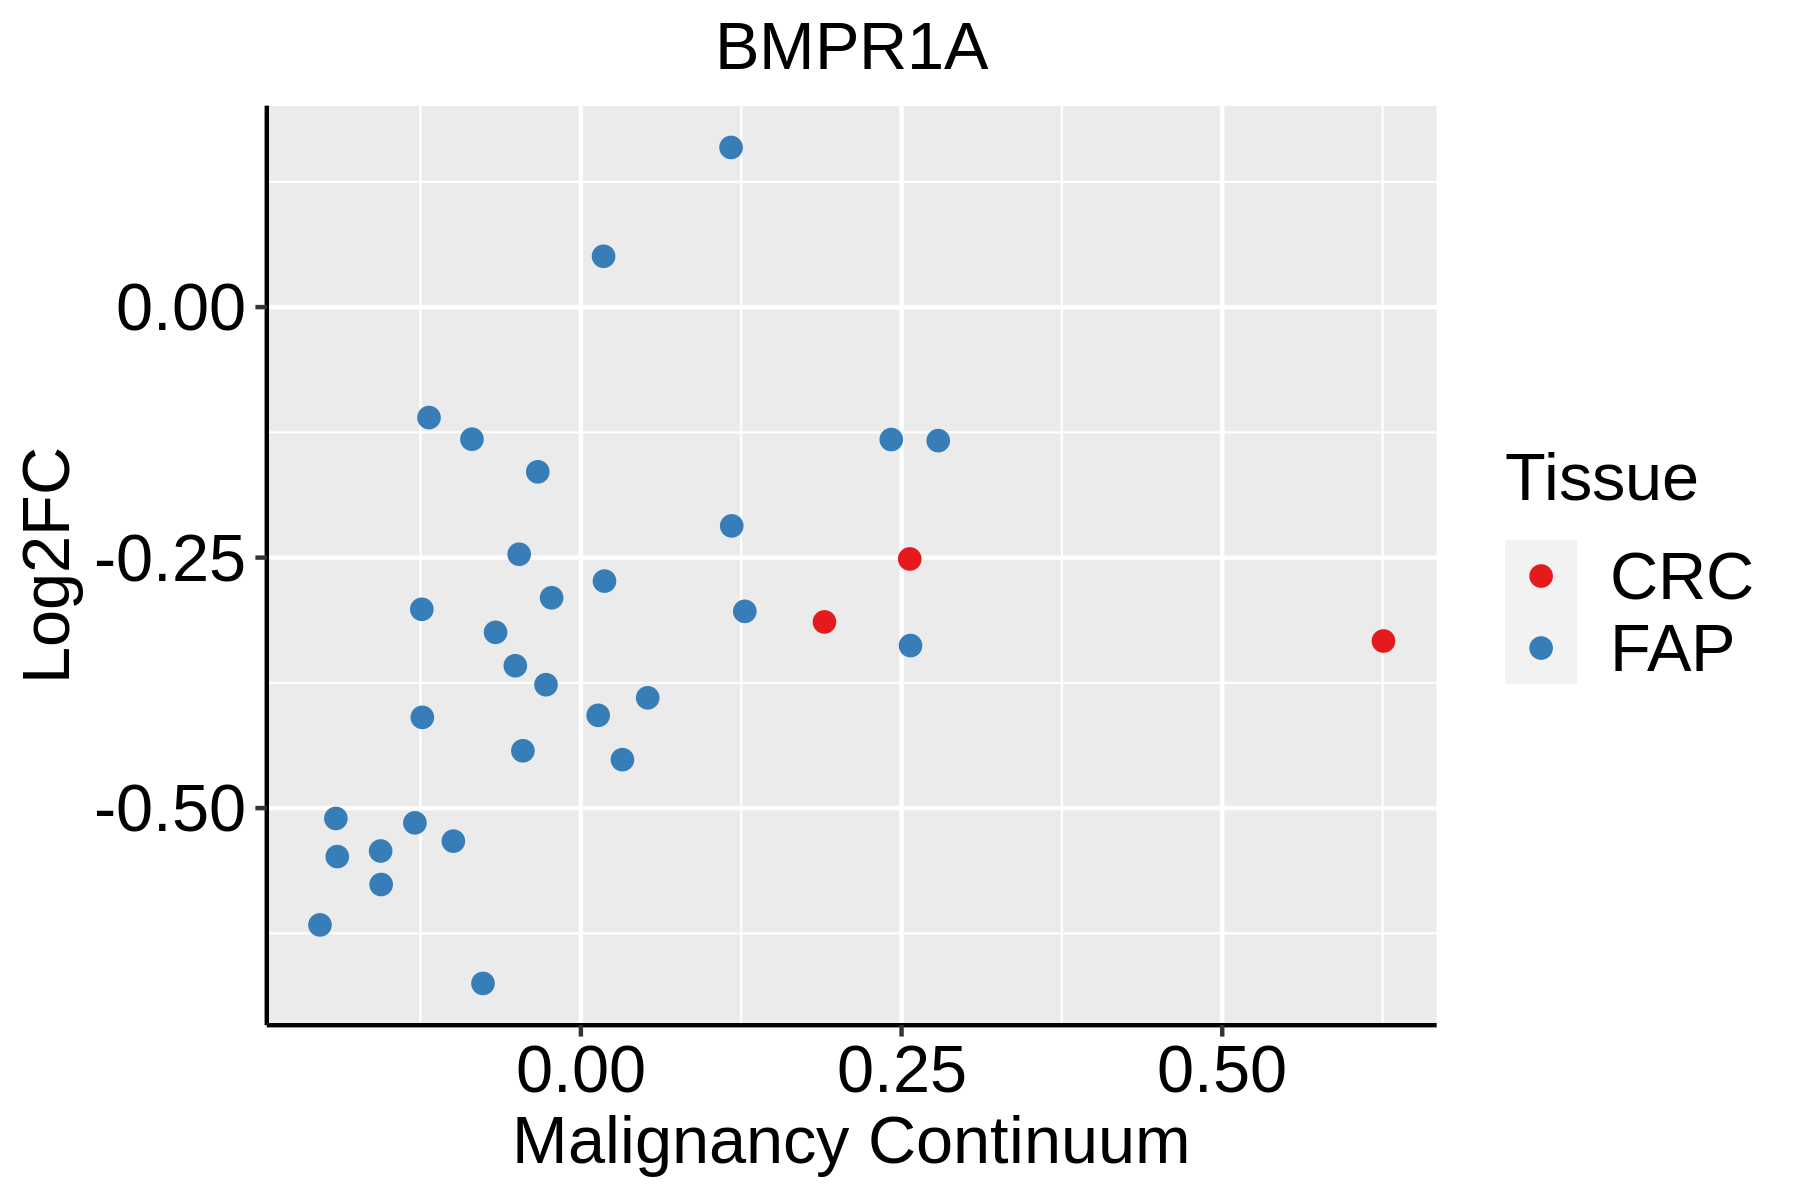 | FAP: Familial adenomatous polyposis |
| CRC: Colorectal cancer | ||
| Colorectum (HTA11) | 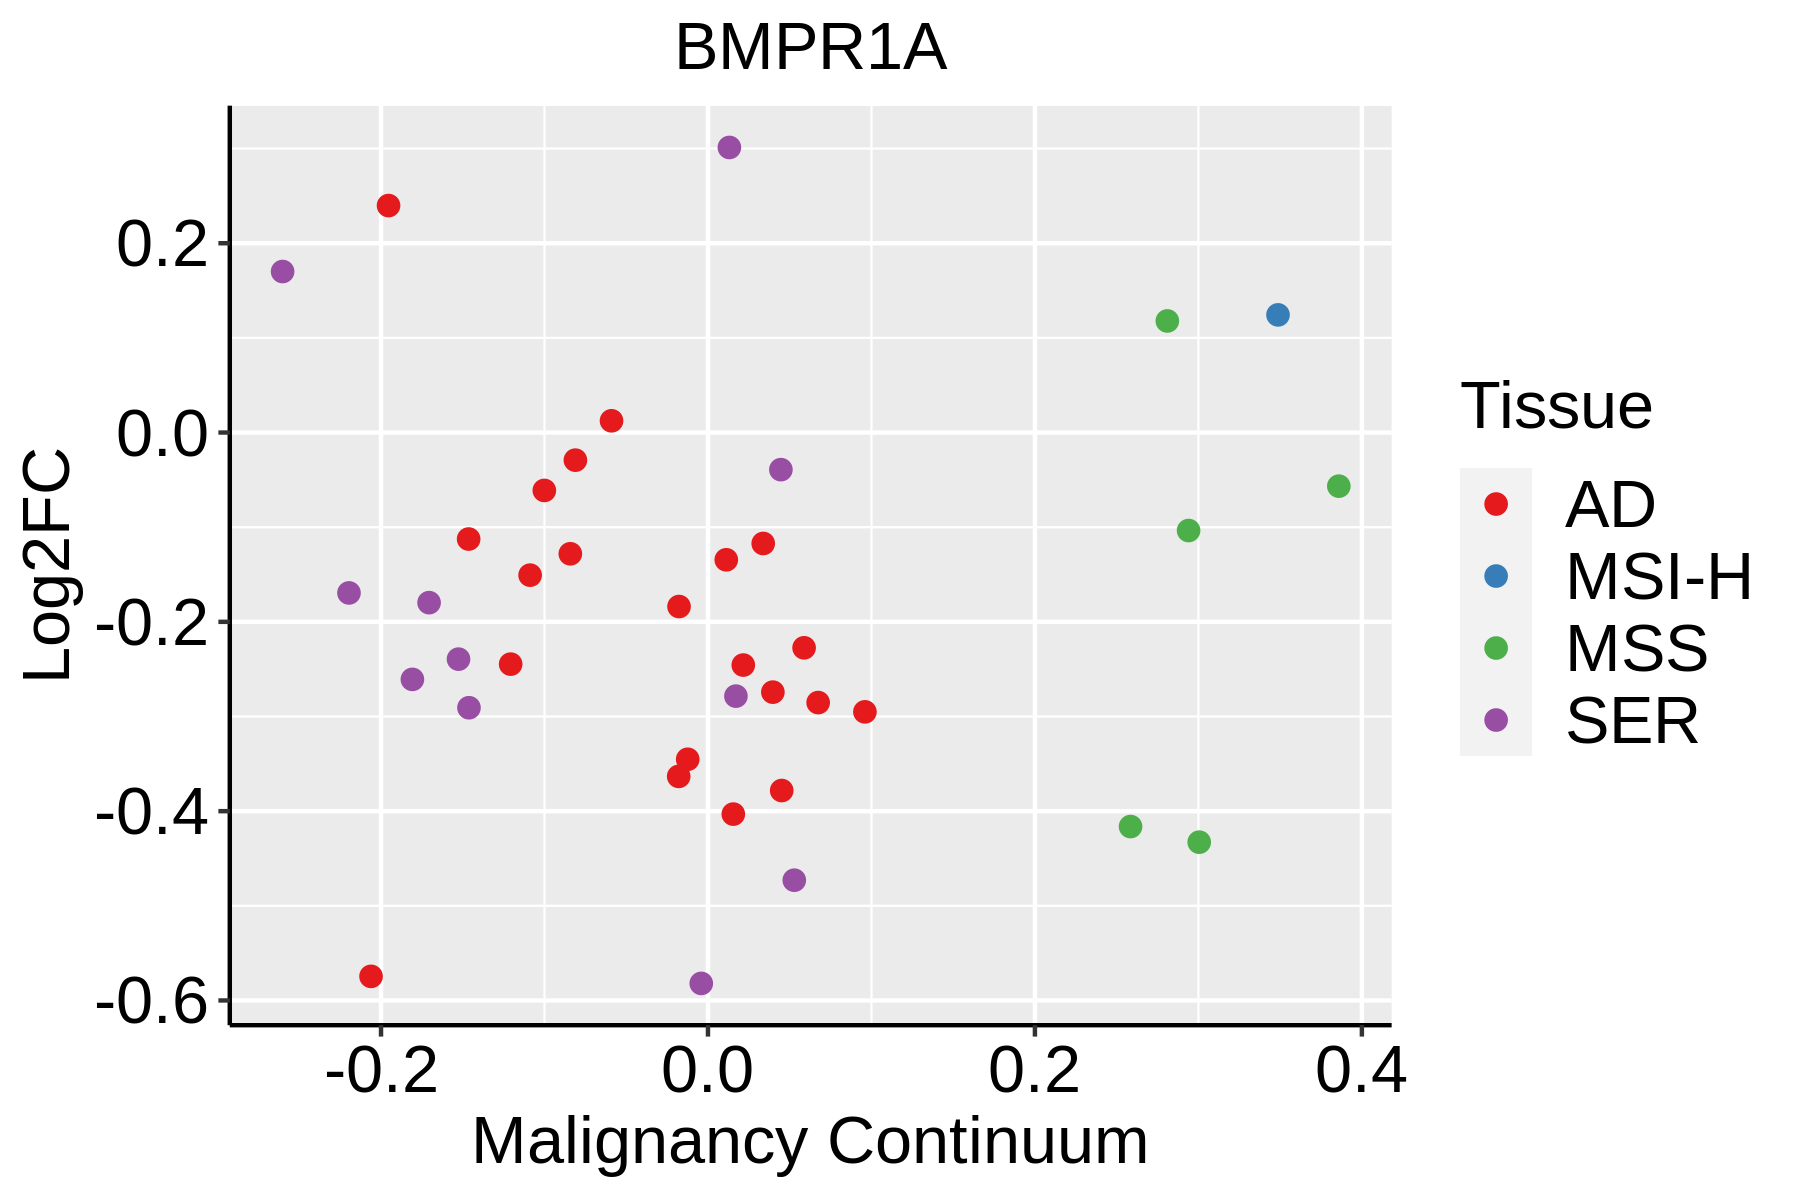 | AD: Adenomas |
| SER: Sessile serrated lesions | ||
| MSI-H: Microsatellite-high colorectal cancer | ||
| MSS: Microsatellite stable colorectal cancer | ||
| Endometrium | 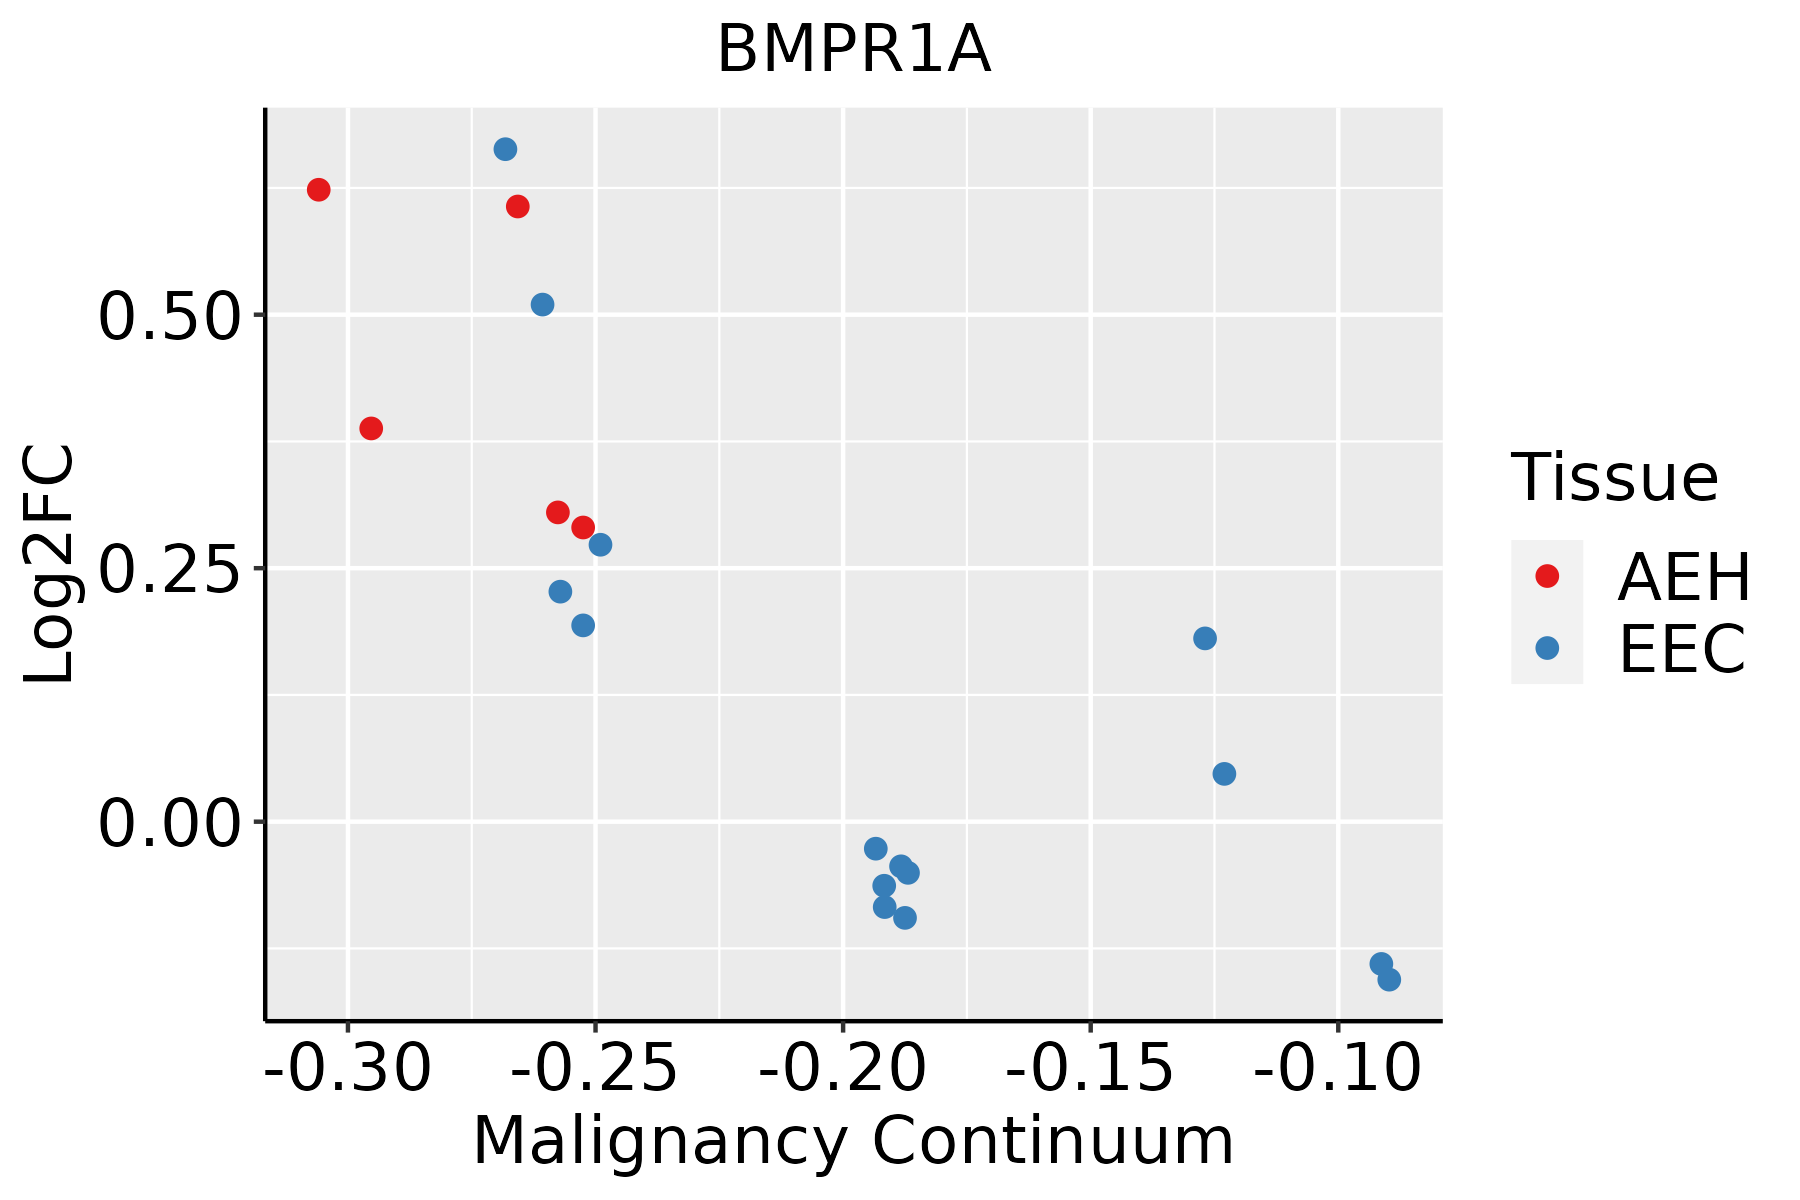 | AEH: Atypical endometrial hyperplasia |
| EEC: Endometrioid Cancer | ||
| Esophagus |  | ESCC: Esophageal squamous cell carcinoma |
| HGIN: High-grade intraepithelial neoplasias | ||
| LGIN: Low-grade intraepithelial neoplasias | ||
| Lung | 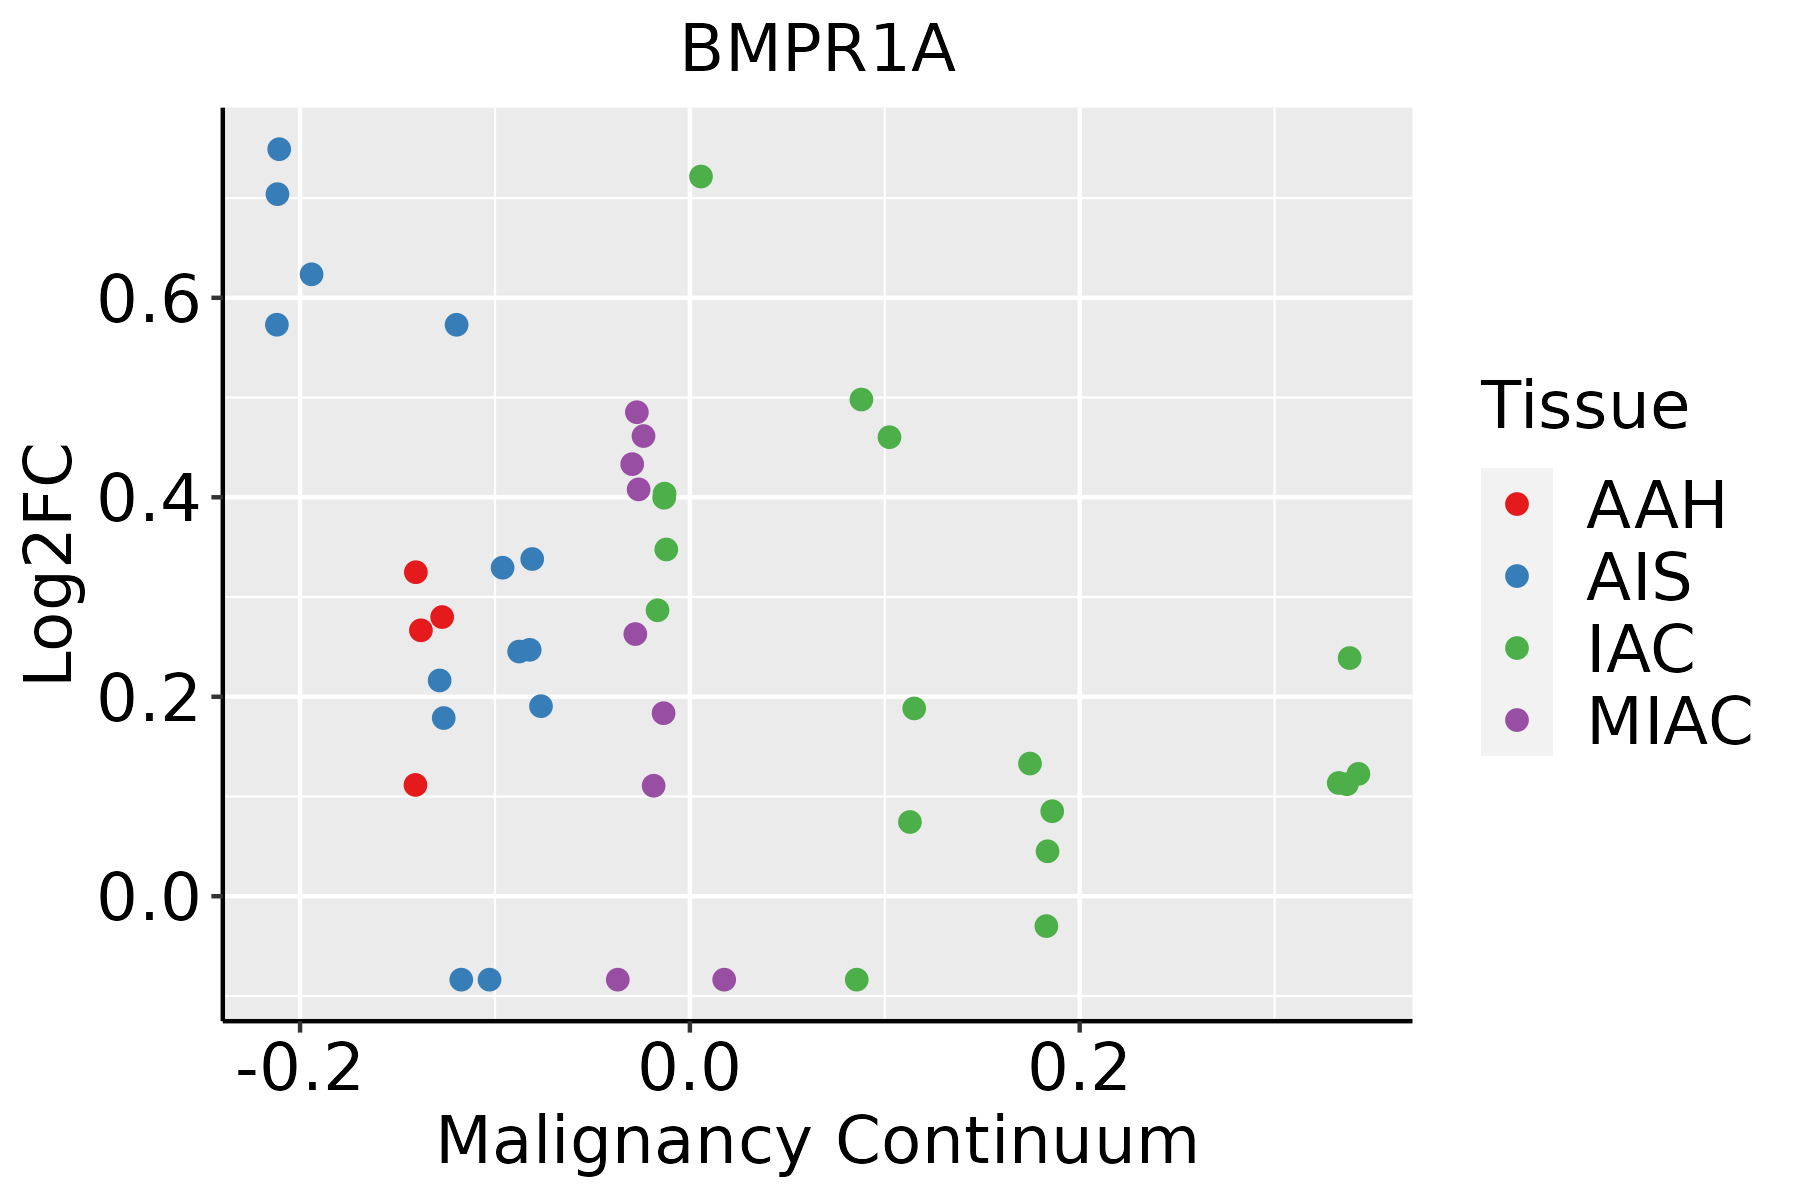 | AAH: Atypical adenomatous hyperplasia |
| AIS: Adenocarcinoma in situ | ||
| IAC: Invasive lung adenocarcinoma | ||
| MIA: Minimally invasive adenocarcinoma |
| ∗log2FC in expression of this searched gene in stem-like cells from each diseased tissue sample relative to stem-like cells in normal samples in each tissue plotted against the malignancy continuum. Samples are colored based on if they are from different disease stage. |
Top |
Malignant transformation related pathway analysis |
| Find out the enriched GO biological processes and KEGG pathways involved in transition from healthy to precancer to cancer |
| Tissue | Disease Stage | Enriched GO biological Processes |
| Colorectum | AD |  |
| Colorectum | SER |  |
| Colorectum | MSS |  |
| Colorectum | MSI-H |  |
| Colorectum | FAP |  |
| ∗Top 15 enriched GO BP terms are showed in the bar plot of each disease state in each tissue. Each row represents a significant GO biological process which is colored according to the -log10(p.adjust). |
| Page: 1 2 3 4 5 6 7 8 9 |
| GO ID | Tissue | Disease Stage | Description | Gene Ratio | Bg Ratio | pvalue | p.adjust | Count |
| GO:00506737 | Cervix | CC | epithelial cell proliferation | 98/2311 | 437/18723 | 2.01e-09 | 2.15e-07 | 98 |
| GO:003367410 | Cervix | CC | positive regulation of kinase activity | 101/2311 | 467/18723 | 8.66e-09 | 7.22e-07 | 101 |
| GO:00458608 | Cervix | CC | positive regulation of protein kinase activity | 85/2311 | 386/18723 | 5.61e-08 | 3.29e-06 | 85 |
| GO:00506787 | Cervix | CC | regulation of epithelial cell proliferation | 83/2311 | 381/18723 | 1.31e-07 | 6.42e-06 | 83 |
| GO:00075689 | Cervix | CC | aging | 75/2311 | 339/18723 | 2.75e-07 | 1.13e-05 | 75 |
| GO:00018197 | Cervix | CC | positive regulation of cytokine production | 95/2311 | 467/18723 | 4.88e-07 | 1.85e-05 | 95 |
| GO:00719007 | Cervix | CC | regulation of protein serine/threonine kinase activity | 75/2311 | 359/18723 | 2.76e-06 | 8.02e-05 | 75 |
| GO:00616148 | Cervix | CC | pri-miRNA transcription by RNA polymerase II | 20/2311 | 55/18723 | 4.22e-06 | 1.09e-04 | 20 |
| GO:19028938 | Cervix | CC | regulation of pri-miRNA transcription by RNA polymerase II | 19/2311 | 54/18723 | 1.27e-05 | 2.60e-04 | 19 |
| GO:00719025 | Cervix | CC | positive regulation of protein serine/threonine kinase activity | 46/2311 | 200/18723 | 1.87e-05 | 3.47e-04 | 46 |
| GO:00075695 | Cervix | CC | cell aging | 34/2311 | 132/18723 | 1.92e-05 | 3.53e-04 | 34 |
| GO:004873210 | Cervix | CC | gland development | 84/2311 | 436/18723 | 1.93e-05 | 3.54e-04 | 84 |
| GO:00506794 | Cervix | CC | positive regulation of epithelial cell proliferation | 47/2311 | 207/18723 | 2.18e-05 | 3.90e-04 | 47 |
| GO:00512713 | Cervix | CC | negative regulation of cellular component movement | 73/2311 | 367/18723 | 2.22e-05 | 3.95e-04 | 73 |
| GO:00400133 | Cervix | CC | negative regulation of locomotion | 76/2311 | 391/18723 | 3.47e-05 | 5.60e-04 | 76 |
| GO:20001463 | Cervix | CC | negative regulation of cell motility | 71/2311 | 359/18723 | 3.47e-05 | 5.60e-04 | 71 |
| GO:00488634 | Cervix | CC | stem cell differentiation | 46/2311 | 206/18723 | 4.11e-05 | 6.36e-04 | 46 |
| GO:00303363 | Cervix | CC | negative regulation of cell migration | 68/2311 | 344/18723 | 5.11e-05 | 7.70e-04 | 68 |
| GO:00073695 | Cervix | CC | gastrulation | 42/2311 | 185/18723 | 5.83e-05 | 8.46e-04 | 42 |
| GO:00017018 | Cervix | CC | in utero embryonic development | 71/2311 | 367/18723 | 7.21e-05 | 1.00e-03 | 71 |
| Page: 1 2 3 4 5 6 7 8 9 10 11 12 13 14 15 16 17 18 19 20 21 22 23 24 25 26 27 28 |
| Pathway ID | Tissue | Disease Stage | Description | Gene Ratio | Bg Ratio | pvalue | p.adjust | qvalue | Count |
| hsa0541820 | Cervix | CC | Fluid shear stress and atherosclerosis | 50/1267 | 139/8465 | 5.71e-10 | 1.32e-08 | 7.81e-09 | 50 |
| hsa043908 | Cervix | CC | Hippo signaling pathway | 40/1267 | 157/8465 | 3.64e-04 | 1.82e-03 | 1.07e-03 | 40 |
| hsa05418110 | Cervix | CC | Fluid shear stress and atherosclerosis | 50/1267 | 139/8465 | 5.71e-10 | 1.32e-08 | 7.81e-09 | 50 |
| hsa0439013 | Cervix | CC | Hippo signaling pathway | 40/1267 | 157/8465 | 3.64e-04 | 1.82e-03 | 1.07e-03 | 40 |
| hsa05418 | Colorectum | AD | Fluid shear stress and atherosclerosis | 54/2092 | 139/8465 | 1.41e-04 | 1.16e-03 | 7.37e-04 | 54 |
| hsa054181 | Colorectum | AD | Fluid shear stress and atherosclerosis | 54/2092 | 139/8465 | 1.41e-04 | 1.16e-03 | 7.37e-04 | 54 |
| hsa054182 | Colorectum | SER | Fluid shear stress and atherosclerosis | 40/1580 | 139/8465 | 2.28e-03 | 1.75e-02 | 1.27e-02 | 40 |
| hsa04350 | Colorectum | SER | TGF-beta signaling pathway | 31/1580 | 108/8465 | 7.00e-03 | 3.77e-02 | 2.74e-02 | 31 |
| hsa054183 | Colorectum | SER | Fluid shear stress and atherosclerosis | 40/1580 | 139/8465 | 2.28e-03 | 1.75e-02 | 1.27e-02 | 40 |
| hsa043501 | Colorectum | SER | TGF-beta signaling pathway | 31/1580 | 108/8465 | 7.00e-03 | 3.77e-02 | 2.74e-02 | 31 |
| hsa054184 | Colorectum | MSS | Fluid shear stress and atherosclerosis | 51/1875 | 139/8465 | 6.06e-05 | 5.80e-04 | 3.55e-04 | 51 |
| hsa04390 | Colorectum | MSS | Hippo signaling pathway | 48/1875 | 157/8465 | 8.32e-03 | 3.10e-02 | 1.90e-02 | 48 |
| hsa054185 | Colorectum | MSS | Fluid shear stress and atherosclerosis | 51/1875 | 139/8465 | 6.06e-05 | 5.80e-04 | 3.55e-04 | 51 |
| hsa043901 | Colorectum | MSS | Hippo signaling pathway | 48/1875 | 157/8465 | 8.32e-03 | 3.10e-02 | 1.90e-02 | 48 |
| hsa054188 | Colorectum | FAP | Fluid shear stress and atherosclerosis | 45/1404 | 139/8465 | 3.05e-06 | 4.63e-05 | 2.81e-05 | 45 |
| hsa043902 | Colorectum | FAP | Hippo signaling pathway | 41/1404 | 157/8465 | 1.49e-03 | 7.91e-03 | 4.81e-03 | 41 |
| hsa054189 | Colorectum | FAP | Fluid shear stress and atherosclerosis | 45/1404 | 139/8465 | 3.05e-06 | 4.63e-05 | 2.81e-05 | 45 |
| hsa043903 | Colorectum | FAP | Hippo signaling pathway | 41/1404 | 157/8465 | 1.49e-03 | 7.91e-03 | 4.81e-03 | 41 |
| hsa0541810 | Colorectum | CRC | Fluid shear stress and atherosclerosis | 32/1091 | 139/8465 | 6.52e-04 | 5.89e-03 | 3.99e-03 | 32 |
| hsa043904 | Colorectum | CRC | Hippo signaling pathway | 32/1091 | 157/8465 | 5.17e-03 | 2.72e-02 | 1.84e-02 | 32 |
| Page: 1 2 3 |
Top |
Cell-cell communication analysis |
| Identification of potential cell-cell interactions between two cell types and their ligand-receptor pairs for different disease states |
| Ligand | Receptor | LRpair | Pathway | Tissue | Disease Stage |
| BMP7 | BMPR1A_ACVR2A | BMP7_BMPR1A_ACVR2A | BMP | Cervix | CC |
| BMP7 | BMPR1A_BMPR2 | BMP7_BMPR1A_BMPR2 | BMP | Cervix | CC |
| BMP2 | BMPR1A_BMPR2 | BMP2_BMPR1A_BMPR2 | BMP | CRC | AD |
| BMP4 | BMPR1A_BMPR2 | BMP4_BMPR1A_BMPR2 | BMP | CRC | AD |
| BMP5 | BMPR1A_BMPR2 | BMP5_BMPR1A_BMPR2 | BMP | CRC | AD |
| BMP6 | BMPR1A_BMPR2 | BMP6_BMPR1A_BMPR2 | BMP | CRC | AD |
| BMP2 | BMPR1A_ACVR2A | BMP2_BMPR1A_ACVR2A | BMP | CRC | ADJ |
| BMP2 | BMPR1A_BMPR2 | BMP2_BMPR1A_BMPR2 | BMP | CRC | ADJ |
| BMP4 | BMPR1A_ACVR2A | BMP4_BMPR1A_ACVR2A | BMP | CRC | ADJ |
| BMP4 | BMPR1A_BMPR2 | BMP4_BMPR1A_BMPR2 | BMP | CRC | ADJ |
| BMP5 | BMPR1A_ACVR2A | BMP5_BMPR1A_ACVR2A | BMP | CRC | ADJ |
| BMP5 | BMPR1A_BMPR2 | BMP5_BMPR1A_BMPR2 | BMP | CRC | ADJ |
| BMP6 | BMPR1A_ACVR2A | BMP6_BMPR1A_ACVR2A | BMP | CRC | ADJ |
| BMP6 | BMPR1A_BMPR2 | BMP6_BMPR1A_BMPR2 | BMP | CRC | ADJ |
| BMP5 | BMPR1A_BMPR2 | BMP5_BMPR1A_BMPR2 | BMP | CRC | CRC |
| BMP2 | BMPR1A_ACVR2A | BMP2_BMPR1A_ACVR2A | BMP | CRC | FAP |
| BMP2 | BMPR1A_BMPR2 | BMP2_BMPR1A_BMPR2 | BMP | CRC | FAP |
| BMP5 | BMPR1A_ACVR2A | BMP5_BMPR1A_ACVR2A | BMP | CRC | FAP |
| BMP5 | BMPR1A_BMPR2 | BMP5_BMPR1A_BMPR2 | BMP | CRC | FAP |
| BMP6 | BMPR1A_ACVR2A | BMP6_BMPR1A_ACVR2A | BMP | CRC | FAP |
| Page: 1 |
Top |
Single-cell gene regulatory network inference analysis |
| Find out the significant the regulons (TFs) and the target genes of each regulon across cell types for different disease states |
| TF | Cell Type | Tissue | Disease Stage | Target Gene | RSS | Regulon Activity |
| ∗The dot plots of a searched regulon are shown for all cell subpopulations in each disease state of each tissue based on the regulon specific score inferred using pySCENIC and by calculating the average expression. |
| Page: 1 |
Top |
Somatic mutation of malignant transformation related genes |
| Annotation of somatic variants for genes involved in malignant transformation |
| Hugo Symbol | Variant Class | Variant Classification | dbSNP RS | HGVSc | HGVSp | HGVSp Short | SWISSPROT | BIOTYPE | SIFT | PolyPhen | Tumor Sample Barcode | Tissue | Histology | Sex | Age | Stage | Therapy Types | Drugs | Outcome |
| BMPR1A | SNV | Missense_Mutation | rs755740570 | c.779N>G | p.Val260Gly | p.V260G | P36894 | protein_coding | deleterious(0) | probably_damaging(0.976) | TCGA-A2-A25F-01 | Breast | breast invasive carcinoma | Female | >=65 | I/II | Chemotherapy | taxotere | SD |
| BMPR1A | SNV | Missense_Mutation | novel | c.11N>A | p.Leu4Gln | p.L4Q | P36894 | protein_coding | deleterious_low_confidence(0.02) | benign(0.135) | TCGA-A7-A426-01 | Breast | breast invasive carcinoma | Female | <65 | III/IV | Chemotherapy | adriamycin | SD |
| BMPR1A | SNV | Missense_Mutation | rs755740570 | c.779T>G | p.Val260Gly | p.V260G | P36894 | protein_coding | deleterious(0) | probably_damaging(0.976) | TCGA-BH-A1FR-01 | Breast | breast invasive carcinoma | Female | >=65 | III/IV | Unknown | Unknown | PD |
| BMPR1A | SNV | Missense_Mutation | rs755740570 | c.779N>G | p.Val260Gly | p.V260G | P36894 | protein_coding | deleterious(0) | probably_damaging(0.976) | TCGA-D8-A1Y1-01 | Breast | breast invasive carcinoma | Female | >=65 | III/IV | Hormone Therapy | tamoxiphen | PD |
| BMPR1A | SNV | Missense_Mutation | rs786202611 | c.1231G>A | p.Glu411Lys | p.E411K | P36894 | protein_coding | deleterious(0) | probably_damaging(1) | TCGA-2W-A8YY-01 | Cervix | cervical & endocervical cancer | Female | <65 | I/II | Chemotherapy | cisplatin | CR |
| BMPR1A | SNV | Missense_Mutation | c.856G>A | p.Glu286Lys | p.E286K | P36894 | protein_coding | tolerated(0.09) | benign(0.246) | TCGA-IR-A3LA-01 | Cervix | cervical & endocervical cancer | Female | <65 | I/II | Chemotherapy | cisplatin | CR | |
| BMPR1A | SNV | Missense_Mutation | c.734N>G | p.Tyr245Cys | p.Y245C | P36894 | protein_coding | deleterious(0) | probably_damaging(0.991) | TCGA-AA-3833-01 | Colorectum | colon adenocarcinoma | Female | <65 | I/II | Unknown | Unknown | SD | |
| BMPR1A | SNV | Missense_Mutation | rs758309022 | c.1379N>C | p.Met460Thr | p.M460T | P36894 | protein_coding | tolerated(0.07) | possibly_damaging(0.491) | TCGA-AA-3966-01 | Colorectum | colon adenocarcinoma | Female | >=65 | I/II | Unknown | Unknown | SD |
| BMPR1A | SNV | Missense_Mutation | c.1561C>T | p.Leu521Phe | p.L521F | P36894 | protein_coding | deleterious(0) | probably_damaging(0.997) | TCGA-AD-6964-01 | Colorectum | colon adenocarcinoma | Male | <65 | III/IV | Chemotherapy | folfox | PD | |
| BMPR1A | SNV | Missense_Mutation | novel | c.55N>G | p.Ser19Ala | p.S19A | P36894 | protein_coding | tolerated_low_confidence(0.5) | benign(0) | TCGA-CA-6717-01 | Colorectum | colon adenocarcinoma | Male | <65 | I/II | Chemotherapy | oxaliplatin | CR |
| Page: 1 2 3 4 5 6 |
Top |
Related drugs of malignant transformation related genes |
| Identification of chemicals and drugs interact with genes involved in malignant transfromation |
| (DGIdb 4.0) |
| Entrez ID | Symbol | Category | Interaction Types | Drug Claim Name | Drug Name | PMIDs |
| 657 | BMPR1A | SERINE THREONINE KINASE, KINASE, DRUGGABLE GENOME, CLINICALLY ACTIONABLE, EXTERNAL SIDE OF PLASMA MEMBRANE | inhibitor | 249565824 | ||
| 657 | BMPR1A | SERINE THREONINE KINASE, KINASE, DRUGGABLE GENOME, CLINICALLY ACTIONABLE, EXTERNAL SIDE OF PLASMA MEMBRANE | inhibitor | 252166689 | ||
| 657 | BMPR1A | SERINE THREONINE KINASE, KINASE, DRUGGABLE GENOME, CLINICALLY ACTIONABLE, EXTERNAL SIDE OF PLASMA MEMBRANE | inhibitor | 249565800 | ||
| 657 | BMPR1A | SERINE THREONINE KINASE, KINASE, DRUGGABLE GENOME, CLINICALLY ACTIONABLE, EXTERNAL SIDE OF PLASMA MEMBRANE | inhibitor | 249565835 | ||
| 657 | BMPR1A | SERINE THREONINE KINASE, KINASE, DRUGGABLE GENOME, CLINICALLY ACTIONABLE, EXTERNAL SIDE OF PLASMA MEMBRANE | inhibitor | 249565801 |
| Page: 1 |

Copyright 2023-Present -The University of Texas Health Science Center at Houston |