
|
|||||
|
 | |
| |
| |
| |
| |
| |
|
Gene: BMP7 |
Gene summary for BMP7 |
| Gene information | Species | Human | Gene symbol | BMP7 | Gene ID | 655 |
| Gene name | bone morphogenetic protein 7 | |
| Gene Alias | OP-1 | |
| Cytomap | 20q13.31 | |
| Gene Type | protein-coding | GO ID | GO:0000003 | UniProtAcc | A8K571 |
Top |
Malignant transformation analysis |
| Identification of the aberrant gene expression in precancerous and cancerous lesions by comparing the gene expression of stem-like cells in diseased tissues with normal stem cells |
| Entrez ID | Symbol | Replicates | Species | Organ | Tissue | Adj P-value | Log2FC | Malignancy |
| 655 | BMP7 | HTA11_8622_2000001021 | Human | Colorectum | SER | 4.45e-03 | 1.99e-01 | 0.0528 |
| 655 | BMP7 | HTA11_99999970781_79442 | Human | Colorectum | MSS | 4.40e-09 | 1.80e-01 | 0.294 |
| 655 | BMP7 | HTA11_99999971662_82457 | Human | Colorectum | MSS | 4.02e-55 | 1.15e+00 | 0.3859 |
| 655 | BMP7 | HTA11_99999974143_84620 | Human | Colorectum | MSS | 2.69e-51 | 7.99e-01 | 0.3005 |
| 655 | BMP7 | A001-C-119 | Human | Colorectum | FAP | 4.39e-03 | 2.33e-01 | -0.1557 |
| 655 | BMP7 | A015-C-005 | Human | Colorectum | FAP | 5.50e-03 | 1.91e-01 | -0.0336 |
| 655 | BMP7 | CRC-1-8810 | Human | Colorectum | CRC | 5.87e-11 | 4.35e-01 | 0.6257 |
| 655 | BMP7 | CRC-3-11773 | Human | Colorectum | CRC | 5.54e-31 | 7.56e-01 | 0.2564 |
| 655 | BMP7 | LZE4T | Human | Esophagus | ESCC | 4.78e-06 | 1.59e-01 | 0.0811 |
| 655 | BMP7 | LZE7T | Human | Esophagus | ESCC | 1.80e-04 | 4.93e-01 | 0.0667 |
| 655 | BMP7 | LZE8T | Human | Esophagus | ESCC | 4.93e-02 | 4.86e-03 | 0.067 |
| 655 | BMP7 | LZE22D1 | Human | Esophagus | HGIN | 4.82e-03 | 1.34e-01 | 0.0595 |
| 655 | BMP7 | LZE22T | Human | Esophagus | ESCC | 7.19e-03 | 2.23e-01 | 0.068 |
| 655 | BMP7 | LZE24T | Human | Esophagus | ESCC | 7.78e-05 | 3.05e-01 | 0.0596 |
| 655 | BMP7 | LZE21T | Human | Esophagus | ESCC | 1.29e-06 | 2.89e-01 | 0.0655 |
| 655 | BMP7 | P2T-E | Human | Esophagus | ESCC | 4.50e-38 | 9.78e-01 | 0.1177 |
| 655 | BMP7 | P4T-E | Human | Esophagus | ESCC | 8.17e-30 | 9.66e-01 | 0.1323 |
| 655 | BMP7 | P5T-E | Human | Esophagus | ESCC | 8.35e-12 | 3.30e-01 | 0.1327 |
| 655 | BMP7 | P8T-E | Human | Esophagus | ESCC | 1.34e-11 | 6.83e-03 | 0.0889 |
| 655 | BMP7 | P9T-E | Human | Esophagus | ESCC | 2.35e-15 | 2.90e-01 | 0.1131 |
| Page: 1 2 3 4 5 |
| Tissue | Expression Dynamics | Abbreviation |
| Colorectum (GSE201348) |  | FAP: Familial adenomatous polyposis |
| CRC: Colorectal cancer | ||
| Colorectum (HTA11) |  | AD: Adenomas |
| SER: Sessile serrated lesions | ||
| MSI-H: Microsatellite-high colorectal cancer | ||
| MSS: Microsatellite stable colorectal cancer | ||
| Esophagus |  | ESCC: Esophageal squamous cell carcinoma |
| HGIN: High-grade intraepithelial neoplasias | ||
| LGIN: Low-grade intraepithelial neoplasias | ||
| Liver |  | HCC: Hepatocellular carcinoma |
| NAFLD: Non-alcoholic fatty liver disease | ||
| Oral Cavity | 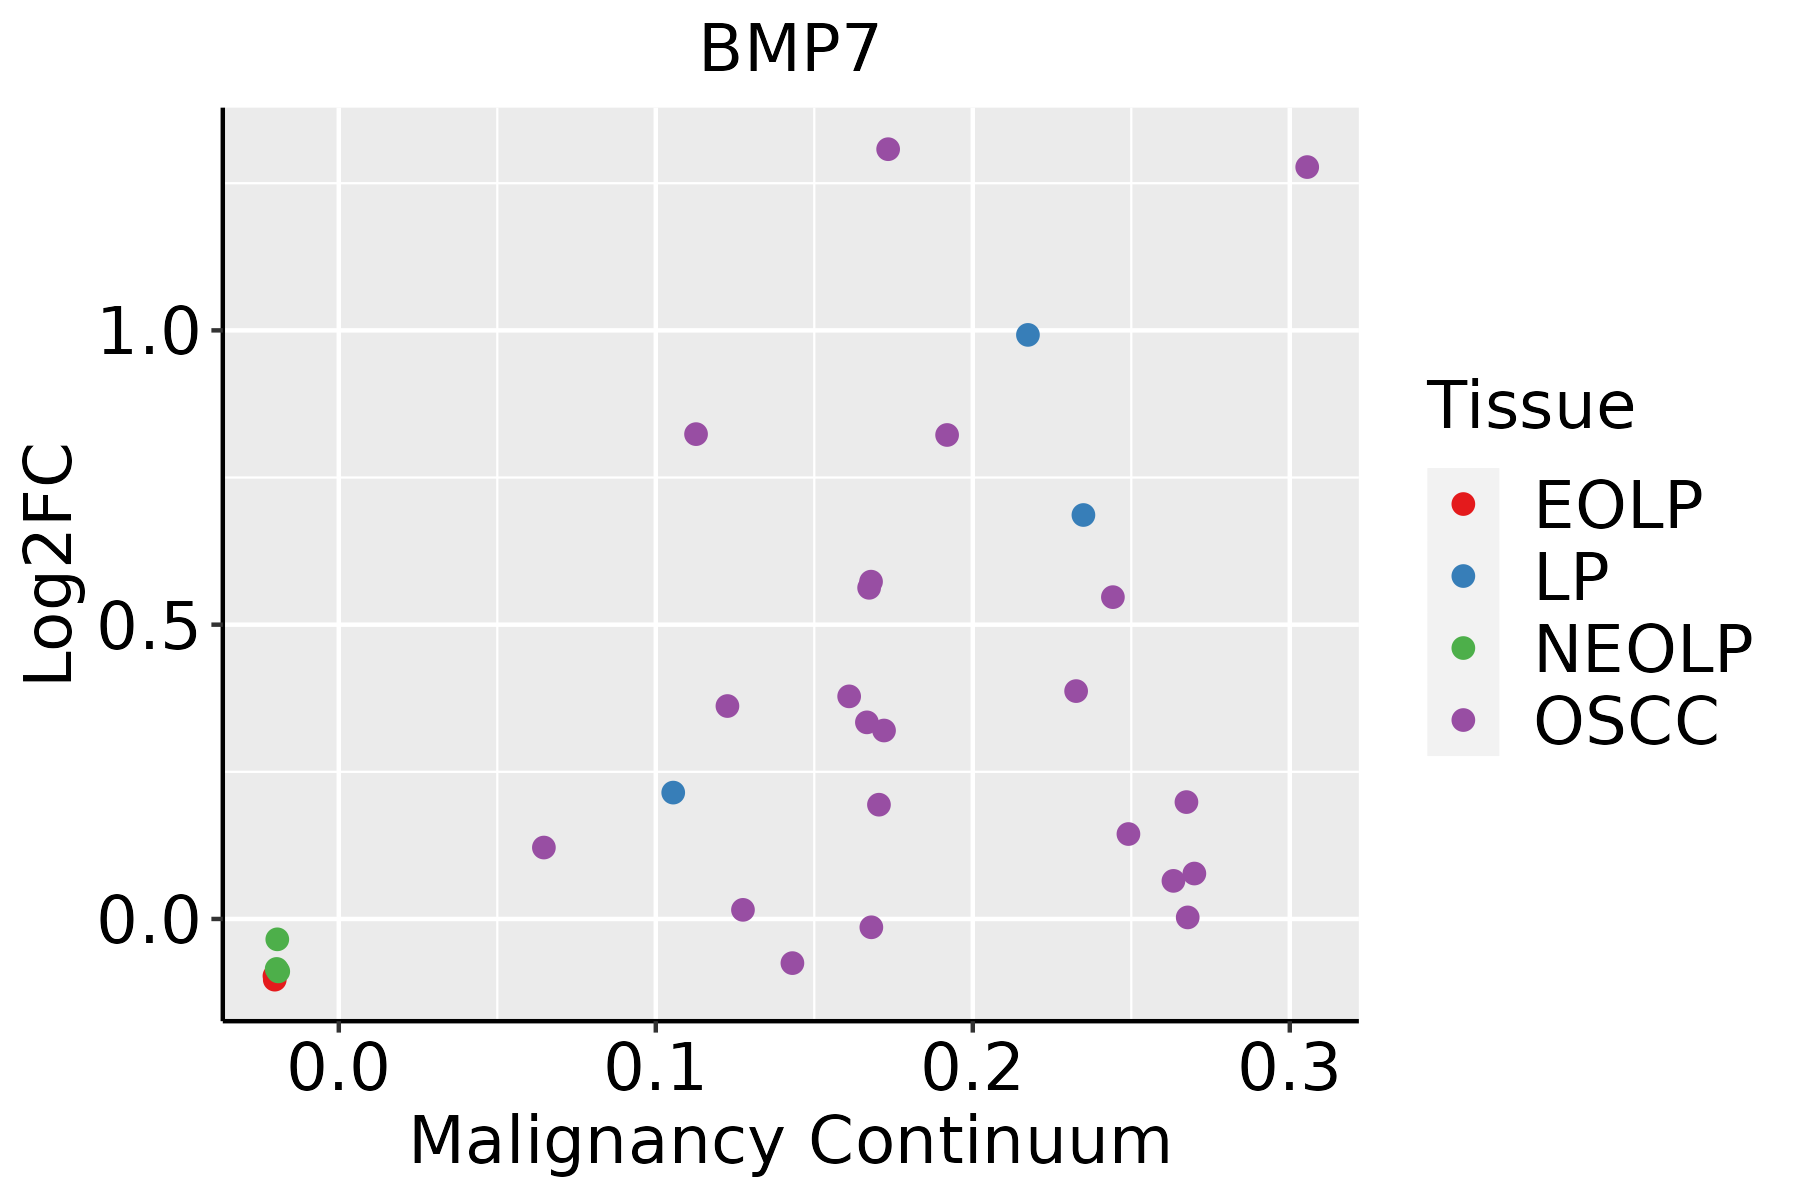 | EOLP: Erosive Oral lichen planus |
| LP: leukoplakia | ||
| NEOLP: Non-erosive oral lichen planus | ||
| OSCC: Oral squamous cell carcinoma | ||
| Thyroid |  | ATC: Anaplastic thyroid cancer |
| HT: Hashimoto's thyroiditis | ||
| PTC: Papillary thyroid cancer |
| ∗log2FC in expression of this searched gene in stem-like cells from each diseased tissue sample relative to stem-like cells in normal samples in each tissue plotted against the malignancy continuum. Samples are colored based on if they are from different disease stage. |
Top |
Malignant transformation related pathway analysis |
| Find out the enriched GO biological processes and KEGG pathways involved in transition from healthy to precancer to cancer |
| Tissue | Disease Stage | Enriched GO biological Processes |
| Colorectum | AD |  |
| Colorectum | SER |  |
| Colorectum | MSS |  |
| Colorectum | MSI-H |  |
| Colorectum | FAP |  |
| ∗Top 15 enriched GO BP terms are showed in the bar plot of each disease state in each tissue. Each row represents a significant GO biological process which is colored according to the -log10(p.adjust). |
| Page: 1 2 3 4 5 6 7 8 9 |
| GO ID | Tissue | Disease Stage | Description | Gene Ratio | Bg Ratio | pvalue | p.adjust | Count |
| GO:00487321 | Colorectum | SER | gland development | 112/2897 | 436/18723 | 1.75e-08 | 1.28e-06 | 112 |
| GO:00069791 | Colorectum | SER | response to oxidative stress | 114/2897 | 446/18723 | 1.75e-08 | 1.28e-06 | 114 |
| GO:00003021 | Colorectum | SER | response to reactive oxygen species | 65/2897 | 222/18723 | 1.21e-07 | 7.29e-06 | 65 |
| GO:00106391 | Colorectum | SER | negative regulation of organelle organization | 90/2897 | 348/18723 | 3.14e-07 | 1.69e-05 | 90 |
| GO:00621971 | Colorectum | SER | cellular response to chemical stress | 87/2897 | 337/18723 | 5.33e-07 | 2.59e-05 | 87 |
| GO:00096361 | Colorectum | SER | response to toxic substance | 71/2897 | 262/18723 | 8.63e-07 | 4.07e-05 | 71 |
| GO:00972371 | Colorectum | SER | cellular response to toxic substance | 40/2897 | 124/18723 | 2.28e-06 | 9.43e-05 | 40 |
| GO:00987541 | Colorectum | SER | detoxification | 46/2897 | 152/18723 | 3.02e-06 | 1.20e-04 | 46 |
| GO:00513481 | Colorectum | SER | negative regulation of transferase activity | 70/2897 | 268/18723 | 4.27e-06 | 1.62e-04 | 70 |
| GO:00345041 | Colorectum | SER | protein localization to nucleus | 74/2897 | 290/18723 | 5.74e-06 | 2.05e-04 | 74 |
| GO:19907481 | Colorectum | SER | cellular detoxification | 37/2897 | 116/18723 | 7.20e-06 | 2.48e-04 | 37 |
| GO:00345991 | Colorectum | SER | cellular response to oxidative stress | 73/2897 | 288/18723 | 8.52e-06 | 2.86e-04 | 73 |
| GO:00018901 | Colorectum | SER | placenta development | 43/2897 | 144/18723 | 9.10e-06 | 3.03e-04 | 43 |
| GO:00713831 | Colorectum | SER | cellular response to steroid hormone stimulus | 55/2897 | 204/18723 | 1.66e-05 | 5.05e-04 | 55 |
| GO:00018921 | Colorectum | SER | embryonic placenta development | 28/2897 | 82/18723 | 2.24e-05 | 6.43e-04 | 28 |
| GO:00105631 | Colorectum | SER | negative regulation of phosphorus metabolic process | 101/2897 | 442/18723 | 2.39e-05 | 6.70e-04 | 101 |
| GO:00459361 | Colorectum | SER | negative regulation of phosphate metabolic process | 100/2897 | 441/18723 | 3.62e-05 | 9.39e-04 | 100 |
| GO:00725931 | Colorectum | SER | reactive oxygen species metabolic process | 61/2897 | 239/18723 | 3.63e-05 | 9.39e-04 | 61 |
| GO:00316671 | Colorectum | SER | response to nutrient levels | 106/2897 | 474/18723 | 3.94e-05 | 1.00e-03 | 106 |
| GO:00485451 | Colorectum | SER | response to steroid hormone | 80/2897 | 339/18723 | 5.15e-05 | 1.25e-03 | 80 |
| Page: 1 2 3 4 5 6 7 8 9 10 11 12 13 14 15 16 17 18 19 20 21 22 23 24 25 26 27 28 29 30 31 32 33 34 35 36 37 38 39 40 41 42 43 44 45 46 47 48 49 50 51 52 53 54 55 |
| Pathway ID | Tissue | Disease Stage | Description | Gene Ratio | Bg Ratio | pvalue | p.adjust | qvalue | Count |
| hsa04350 | Colorectum | SER | TGF-beta signaling pathway | 31/1580 | 108/8465 | 7.00e-03 | 3.77e-02 | 2.74e-02 | 31 |
| hsa043501 | Colorectum | SER | TGF-beta signaling pathway | 31/1580 | 108/8465 | 7.00e-03 | 3.77e-02 | 2.74e-02 | 31 |
| hsa04390 | Colorectum | MSS | Hippo signaling pathway | 48/1875 | 157/8465 | 8.32e-03 | 3.10e-02 | 1.90e-02 | 48 |
| hsa043602 | Colorectum | MSS | Axon guidance | 54/1875 | 182/8465 | 1.03e-02 | 3.69e-02 | 2.26e-02 | 54 |
| hsa043901 | Colorectum | MSS | Hippo signaling pathway | 48/1875 | 157/8465 | 8.32e-03 | 3.10e-02 | 1.90e-02 | 48 |
| hsa043603 | Colorectum | MSS | Axon guidance | 54/1875 | 182/8465 | 1.03e-02 | 3.69e-02 | 2.26e-02 | 54 |
| hsa043604 | Colorectum | FAP | Axon guidance | 47/1404 | 182/8465 | 9.09e-04 | 5.20e-03 | 3.16e-03 | 47 |
| hsa043902 | Colorectum | FAP | Hippo signaling pathway | 41/1404 | 157/8465 | 1.49e-03 | 7.91e-03 | 4.81e-03 | 41 |
| hsa043605 | Colorectum | FAP | Axon guidance | 47/1404 | 182/8465 | 9.09e-04 | 5.20e-03 | 3.16e-03 | 47 |
| hsa043903 | Colorectum | FAP | Hippo signaling pathway | 41/1404 | 157/8465 | 1.49e-03 | 7.91e-03 | 4.81e-03 | 41 |
| hsa043606 | Colorectum | CRC | Axon guidance | 43/1091 | 182/8465 | 4.38e-05 | 8.70e-04 | 5.90e-04 | 43 |
| hsa043904 | Colorectum | CRC | Hippo signaling pathway | 32/1091 | 157/8465 | 5.17e-03 | 2.72e-02 | 1.84e-02 | 32 |
| hsa043607 | Colorectum | CRC | Axon guidance | 43/1091 | 182/8465 | 4.38e-05 | 8.70e-04 | 5.90e-04 | 43 |
| hsa043905 | Colorectum | CRC | Hippo signaling pathway | 32/1091 | 157/8465 | 5.17e-03 | 2.72e-02 | 1.84e-02 | 32 |
| hsa043507 | Esophagus | ESCC | TGF-beta signaling pathway | 69/4205 | 108/8465 | 1.92e-03 | 5.54e-03 | 2.84e-03 | 69 |
| hsa0436016 | Esophagus | ESCC | Axon guidance | 108/4205 | 182/8465 | 5.13e-03 | 1.30e-02 | 6.67e-03 | 108 |
| hsa0439018 | Esophagus | ESCC | Hippo signaling pathway | 92/4205 | 157/8465 | 1.46e-02 | 3.31e-02 | 1.69e-02 | 92 |
| hsa0435014 | Esophagus | ESCC | TGF-beta signaling pathway | 69/4205 | 108/8465 | 1.92e-03 | 5.54e-03 | 2.84e-03 | 69 |
| hsa0436017 | Esophagus | ESCC | Axon guidance | 108/4205 | 182/8465 | 5.13e-03 | 1.30e-02 | 6.67e-03 | 108 |
| hsa0439019 | Esophagus | ESCC | Hippo signaling pathway | 92/4205 | 157/8465 | 1.46e-02 | 3.31e-02 | 1.69e-02 | 92 |
| Page: 1 2 |
Top |
Cell-cell communication analysis |
| Identification of potential cell-cell interactions between two cell types and their ligand-receptor pairs for different disease states |
| Ligand | Receptor | LRpair | Pathway | Tissue | Disease Stage |
| BMP7 | ACVR1_ACVR2A | BMP7_ACVR1_ACVR2A | BMP | Cervix | CC |
| BMP7 | ACVR1_BMPR2 | BMP7_ACVR1_BMPR2 | BMP | Cervix | CC |
| BMP7 | BMPR1A_ACVR2A | BMP7_BMPR1A_ACVR2A | BMP | Cervix | CC |
| BMP7 | BMPR1A_BMPR2 | BMP7_BMPR1A_BMPR2 | BMP | Cervix | CC |
| BMP7 | BMPR1B_ACVR2A | BMP7_BMPR1B_ACVR2A | BMP | Cervix | CC |
| BMP7 | BMPR1B_BMPR2 | BMP7_BMPR1B_BMPR2 | BMP | Cervix | CC |
| BMP7 | ACVR1_BMPR2 | BMP7_ACVR1_BMPR2 | BMP | Endometrium | AEH |
| BMP7 | BMPR1A_BMPR2 | BMP7_BMPR1A_BMPR2 | BMP | Endometrium | AEH |
| BMP7 | BMPR1B_BMPR2 | BMP7_BMPR1B_BMPR2 | BMP | Endometrium | AEH |
| BMP7 | ACVR1_BMPR2 | BMP7_ACVR1_BMPR2 | BMP | Esophagus | ESCC |
| BMP7 | BMPR1A_ACVR2B | BMP7_BMPR1A_ACVR2B | BMP | Esophagus | ESCC |
| BMP7 | ACVR1_BMPR2 | BMP7_ACVR1_BMPR2 | BMP | HNSCC | OSCC |
| BMP7 | ACVR1_BMPR2 | BMP7_ACVR1_BMPR2 | BMP | HNSCC | Precancer |
| BMP7 | BMPR1A_BMPR2 | BMP7_BMPR1A_BMPR2 | BMP | HNSCC | Precancer |
| BMP7 | ACVR1_BMPR2 | BMP7_ACVR1_BMPR2 | BMP | THCA | ADJ |
| BMP7 | BMPR1A_ACVR2A | BMP7_BMPR1A_ACVR2A | BMP | THCA | ADJ |
| BMP7 | BMPR1A_BMPR2 | BMP7_BMPR1A_BMPR2 | BMP | THCA | ADJ |
| BMP7 | ACVR1_BMPR2 | BMP7_ACVR1_BMPR2 | BMP | THCA | PTC |
| Page: 1 |
Top |
Single-cell gene regulatory network inference analysis |
| Find out the significant the regulons (TFs) and the target genes of each regulon across cell types for different disease states |
| TF | Cell Type | Tissue | Disease Stage | Target Gene | RSS | Regulon Activity |
| ∗The dot plots of a searched regulon are shown for all cell subpopulations in each disease state of each tissue based on the regulon specific score inferred using pySCENIC and by calculating the average expression. |
| Page: 1 |
Top |
Somatic mutation of malignant transformation related genes |
| Annotation of somatic variants for genes involved in malignant transformation |
| Hugo Symbol | Variant Class | Variant Classification | dbSNP RS | HGVSc | HGVSp | HGVSp Short | SWISSPROT | BIOTYPE | SIFT | PolyPhen | Tumor Sample Barcode | Tissue | Histology | Sex | Age | Stage | Therapy Types | Drugs | Outcome |
| BMP7 | insertion | In_Frame_Ins | novel | c.868_869insAACCAAAGCTTCAAATAATGAACCTCACAACAAACCATT | p.Ser290delinsLysProLysLeuGlnIleMetAsnLeuThrThrAsnHisCys | p.S290delinsKPKLQIMNLTTNHC | P18075 | protein_coding | TCGA-A8-A08H-01 | Breast | breast invasive carcinoma | Female | >=65 | I/II | Unknown | Unknown | SD | ||
| BMP7 | insertion | Frame_Shift_Ins | novel | c.1044_1045insT | p.Ile349TyrfsTer4 | p.I349Yfs*4 | P18075 | protein_coding | TCGA-BH-A0GY-01 | Breast | breast invasive carcinoma | Female | >=65 | I/II | Chemotherapy | cyotxan | SD | ||
| BMP7 | deletion | Frame_Shift_Del | novel | c.237delN | p.Met81CysfsTer54 | p.M81Cfs*54 | P18075 | protein_coding | TCGA-D8-A27V-01 | Breast | breast invasive carcinoma | Female | <65 | I/II | Hormone Therapy | tamoxiphen | SD | ||
| BMP7 | SNV | Missense_Mutation | rs201575559 | c.449N>A | p.Arg150His | p.R150H | P18075 | protein_coding | deleterious(0.04) | benign(0.013) | TCGA-A6-5661-01 | Colorectum | colon adenocarcinoma | Female | >=65 | I/II | Unknown | Unknown | SD |
| BMP7 | SNV | Missense_Mutation | c.517N>A | p.Glu173Lys | p.E173K | P18075 | protein_coding | deleterious(0) | possibly_damaging(0.893) | TCGA-AA-3492-01 | Colorectum | colon adenocarcinoma | Female | >=65 | I/II | Unknown | Unknown | SD | |
| BMP7 | SNV | Missense_Mutation | novel | c.1290N>G | p.Cys430Trp | p.C430W | P18075 | protein_coding | deleterious(0) | probably_damaging(1) | TCGA-AA-3850-01 | Colorectum | colon adenocarcinoma | Male | >=65 | I/II | Unknown | Unknown | PD |
| BMP7 | SNV | Missense_Mutation | c.517N>A | p.Glu173Lys | p.E173K | P18075 | protein_coding | deleterious(0) | possibly_damaging(0.893) | TCGA-AA-3977-01 | Colorectum | colon adenocarcinoma | Male | >=65 | I/II | Unknown | Unknown | SD | |
| BMP7 | SNV | Missense_Mutation | c.391N>A | p.Asp131Asn | p.D131N | P18075 | protein_coding | deleterious(0) | possibly_damaging(0.895) | TCGA-AA-3977-01 | Colorectum | colon adenocarcinoma | Male | >=65 | I/II | Unknown | Unknown | SD | |
| BMP7 | SNV | Missense_Mutation | rs149261355 | c.556G>A | p.Asp186Asn | p.D186N | P18075 | protein_coding | tolerated(0.43) | benign(0.015) | TCGA-AA-3984-01 | Colorectum | colon adenocarcinoma | Female | <65 | I/II | Unknown | Unknown | SD |
| BMP7 | SNV | Missense_Mutation | rs772689429 | c.1000G>A | p.Glu334Lys | p.E334K | P18075 | protein_coding | deleterious(0) | benign(0.325) | TCGA-AA-A00N-01 | Colorectum | colon adenocarcinoma | Male | >=65 | I/II | Unknown | Unknown | PD |
| Page: 1 2 3 4 5 6 7 8 |
Top |
Related drugs of malignant transformation related genes |
| Identification of chemicals and drugs interact with genes involved in malignant transfromation |
| (DGIdb 4.0) |
| Entrez ID | Symbol | Category | Interaction Types | Drug Claim Name | Drug Name | PMIDs |
| 655 | BMP7 | TRANSCRIPTION FACTOR, DRUGGABLE GENOME, GROWTH FACTOR | pegaspargase | PEGASPARGASE | 26590194 | |
| 655 | BMP7 | TRANSCRIPTION FACTOR, DRUGGABLE GENOME, GROWTH FACTOR | methotrexate | METHOTREXATE | 26590194 | |
| 655 | BMP7 | TRANSCRIPTION FACTOR, DRUGGABLE GENOME, GROWTH FACTOR | cyclophosphamide | CYCLOPHOSPHAMIDE | 26590194 | |
| 655 | BMP7 | TRANSCRIPTION FACTOR, DRUGGABLE GENOME, GROWTH FACTOR | thioguanine | THIOGUANINE | 26590194 | |
| 655 | BMP7 | TRANSCRIPTION FACTOR, DRUGGABLE GENOME, GROWTH FACTOR | prednisone | PREDNISONE | 26590194 | |
| 655 | BMP7 | TRANSCRIPTION FACTOR, DRUGGABLE GENOME, GROWTH FACTOR | dexamethasone | DEXAMETHASONE | 26590194 | |
| 655 | BMP7 | TRANSCRIPTION FACTOR, DRUGGABLE GENOME, GROWTH FACTOR | cytarabine | CYTARABINE | 26590194 | |
| 655 | BMP7 | TRANSCRIPTION FACTOR, DRUGGABLE GENOME, GROWTH FACTOR | vincristine | VINCRISTINE | 26590194 | |
| 655 | BMP7 | TRANSCRIPTION FACTOR, DRUGGABLE GENOME, GROWTH FACTOR | daunorubicin | DAUNORUBICIN | 26590194 | |
| 655 | BMP7 | TRANSCRIPTION FACTOR, DRUGGABLE GENOME, GROWTH FACTOR | doxorubicin | DOXORUBICIN | 26590194 |
| Page: 1 |

Copyright 2023-Present -The University of Texas Health Science Center at Houston |