
|
|||||
|
 | |
| |
| |
| |
| |
| |
|
Gene: BMP6 |
Gene summary for BMP6 |
| Gene information | Species | Human | Gene symbol | BMP6 | Gene ID | 654 |
| Gene name | bone morphogenetic protein 6 | |
| Gene Alias | VGR | |
| Cytomap | 6p24.3 | |
| Gene Type | protein-coding | GO ID | GO:0000003 | UniProtAcc | B4DUF7 |
Top |
Malignant transformation analysis |
| Identification of the aberrant gene expression in precancerous and cancerous lesions by comparing the gene expression of stem-like cells in diseased tissues with normal stem cells |
| Entrez ID | Symbol | Replicates | Species | Organ | Tissue | Adj P-value | Log2FC | Malignancy |
| 654 | BMP6 | GSM5353218_PA_PB1B_Pool_1_2_S74_L003 | Human | Prostate | Tumor | 3.54e-05 | 6.25e-01 | 0.1479 |
| 654 | BMP6 | GSM5353220_PA_PB1B_Pool_3_S51_L002 | Human | Prostate | Tumor | 2.22e-03 | 5.50e-01 | 0.1531 |
| Page: 1 |
| Tissue | Expression Dynamics | Abbreviation |
| Prostate | 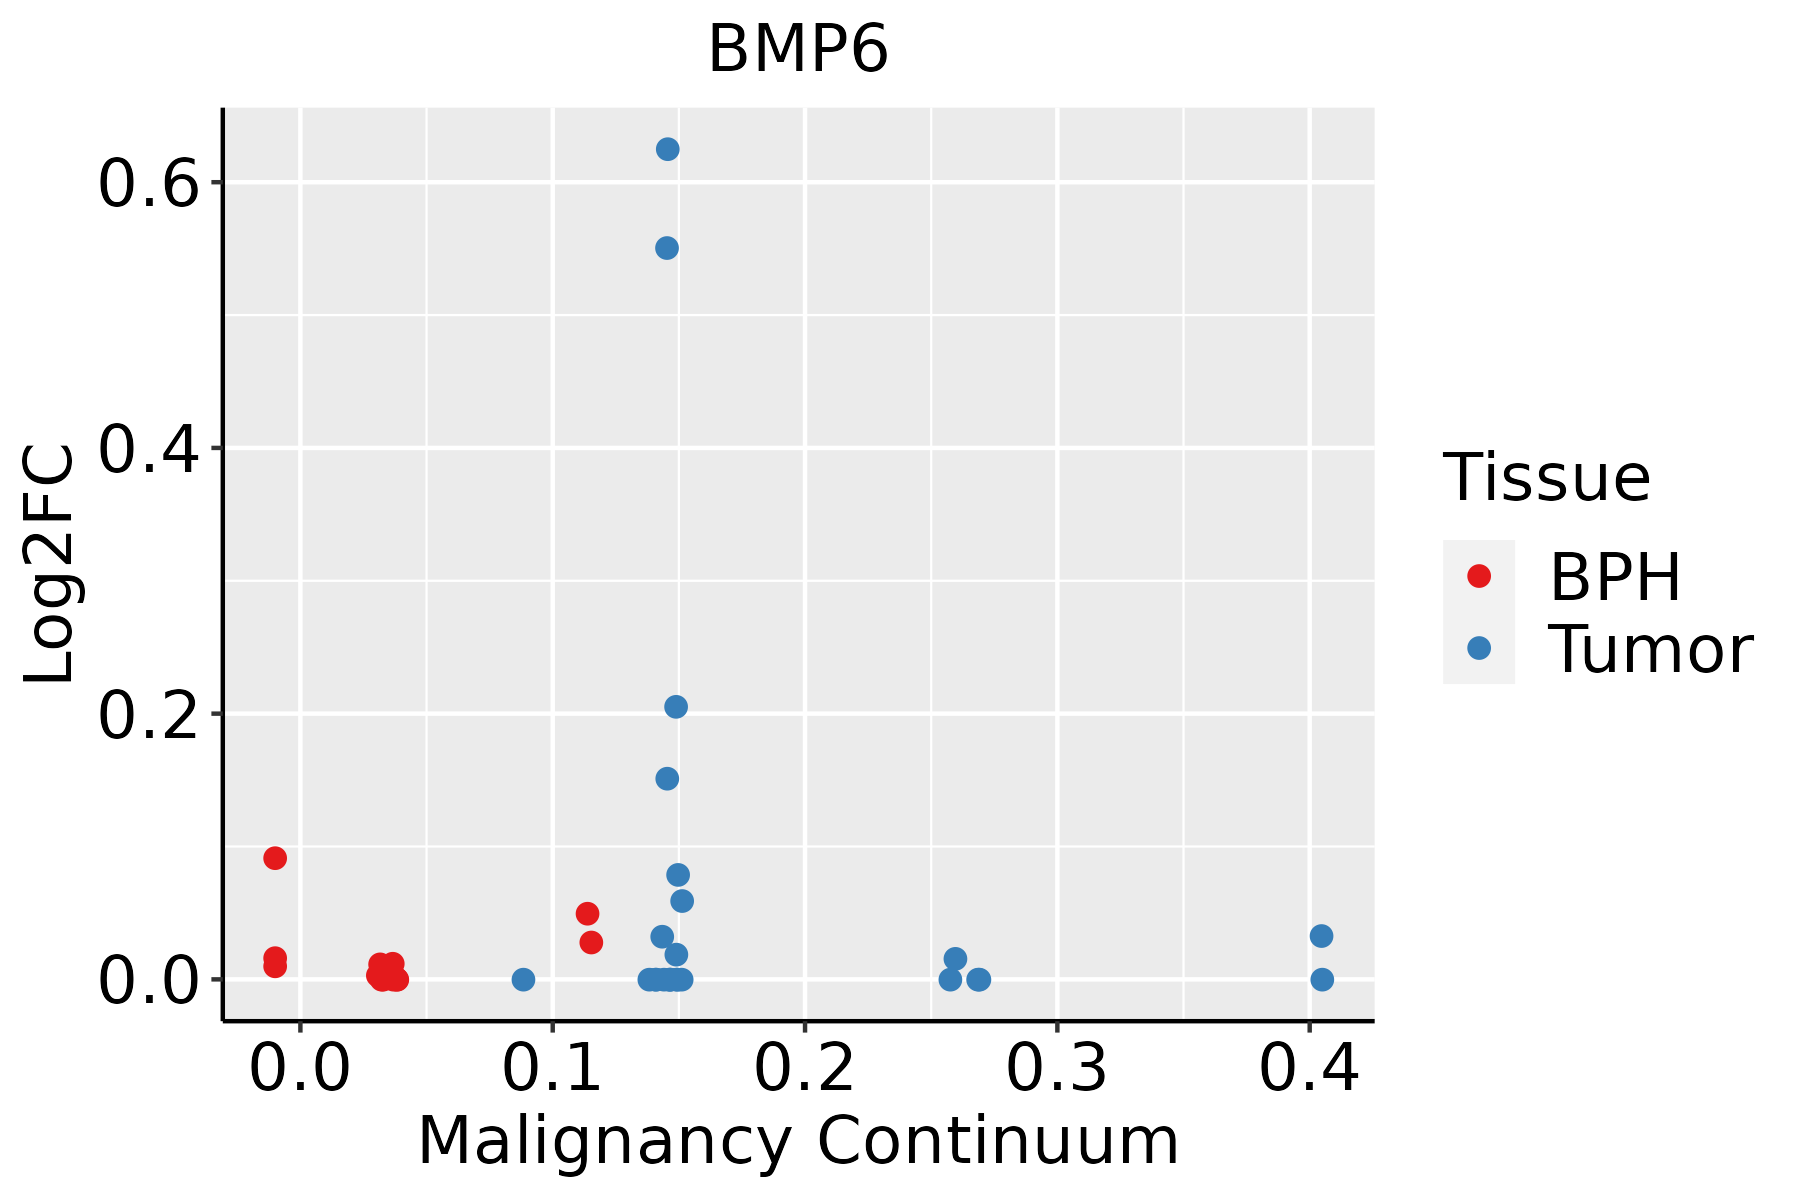 | BPH: Benign Prostatic Hyperplasia |
| ∗log2FC in expression of this searched gene in stem-like cells from each diseased tissue sample relative to stem-like cells in normal samples in each tissue plotted against the malignancy continuum. Samples are colored based on if they are from different disease stage. |
Top |
Malignant transformation related pathway analysis |
| Find out the enriched GO biological processes and KEGG pathways involved in transition from healthy to precancer to cancer |
| Tissue | Disease Stage | Enriched GO biological Processes |
| Colorectum | AD |  |
| Colorectum | SER |  |
| Colorectum | MSS |  |
| Colorectum | MSI-H |  |
| Colorectum | FAP |  |
| ∗Top 15 enriched GO BP terms are showed in the bar plot of each disease state in each tissue. Each row represents a significant GO biological process which is colored according to the -log10(p.adjust). |
| Page: 1 2 3 4 5 6 7 8 9 |
| GO ID | Tissue | Disease Stage | Description | Gene Ratio | Bg Ratio | pvalue | p.adjust | Count |
| GO:000206418 | Prostate | Tumor | epithelial cell development | 88/3246 | 220/18723 | 1.30e-15 | 2.38e-13 | 88 |
| GO:004854519 | Prostate | Tumor | response to steroid hormone | 118/3246 | 339/18723 | 4.46e-15 | 6.94e-13 | 118 |
| GO:006145816 | Prostate | Tumor | reproductive system development | 133/3246 | 427/18723 | 1.24e-12 | 1.15e-10 | 133 |
| GO:190495118 | Prostate | Tumor | positive regulation of establishment of protein localization | 106/3246 | 319/18723 | 3.13e-12 | 2.70e-10 | 106 |
| GO:004860815 | Prostate | Tumor | reproductive structure development | 131/3246 | 424/18723 | 3.48e-12 | 2.89e-10 | 131 |
| GO:007149619 | Prostate | Tumor | cellular response to external stimulus | 103/3246 | 320/18723 | 5.29e-11 | 3.41e-09 | 103 |
| GO:005122218 | Prostate | Tumor | positive regulation of protein transport | 97/3246 | 303/18723 | 2.67e-10 | 1.48e-08 | 97 |
| GO:000164915 | Prostate | Tumor | osteoblast differentiation | 77/3246 | 229/18723 | 1.55e-09 | 7.26e-08 | 77 |
| GO:005067316 | Prostate | Tumor | epithelial cell proliferation | 125/3246 | 437/18723 | 2.56e-09 | 1.08e-07 | 125 |
| GO:005067815 | Prostate | Tumor | regulation of epithelial cell proliferation | 110/3246 | 381/18723 | 1.32e-08 | 4.82e-07 | 110 |
| GO:001003819 | Prostate | Tumor | response to metal ion | 107/3246 | 373/18723 | 3.02e-08 | 9.77e-07 | 107 |
| GO:000315815 | Prostate | Tumor | endothelium development | 50/3246 | 136/18723 | 4.60e-08 | 1.42e-06 | 50 |
| GO:004544614 | Prostate | Tumor | endothelial cell differentiation | 45/3246 | 118/18723 | 6.08e-08 | 1.80e-06 | 45 |
| GO:003196017 | Prostate | Tumor | response to corticosteroid | 57/3246 | 167/18723 | 1.11e-07 | 2.94e-06 | 57 |
| GO:005138417 | Prostate | Tumor | response to glucocorticoid | 52/3246 | 148/18723 | 1.38e-07 | 3.50e-06 | 52 |
| GO:003085614 | Prostate | Tumor | regulation of epithelial cell differentiation | 52/3246 | 154/18723 | 5.76e-07 | 1.22e-05 | 52 |
| GO:000150314 | Prostate | Tumor | ossification | 109/3246 | 408/18723 | 1.13e-06 | 2.14e-05 | 109 |
| GO:007121415 | Prostate | Tumor | cellular response to abiotic stimulus | 92/3246 | 331/18723 | 1.25e-06 | 2.32e-05 | 92 |
| GO:010400415 | Prostate | Tumor | cellular response to environmental stimulus | 92/3246 | 331/18723 | 1.25e-06 | 2.32e-05 | 92 |
| GO:007124114 | Prostate | Tumor | cellular response to inorganic substance | 66/3246 | 226/18723 | 6.63e-06 | 1.00e-04 | 66 |
| Page: 1 2 3 4 |
| Pathway ID | Tissue | Disease Stage | Description | Gene Ratio | Bg Ratio | pvalue | p.adjust | qvalue | Count |
| hsa0439024 | Prostate | Tumor | Hippo signaling pathway | 54/1791 | 157/8465 | 7.52e-05 | 5.30e-04 | 3.28e-04 | 54 |
| hsa0435021 | Prostate | Tumor | TGF-beta signaling pathway | 39/1791 | 108/8465 | 2.33e-04 | 1.35e-03 | 8.39e-04 | 39 |
| hsa0439034 | Prostate | Tumor | Hippo signaling pathway | 54/1791 | 157/8465 | 7.52e-05 | 5.30e-04 | 3.28e-04 | 54 |
| hsa0435031 | Prostate | Tumor | TGF-beta signaling pathway | 39/1791 | 108/8465 | 2.33e-04 | 1.35e-03 | 8.39e-04 | 39 |
| Page: 1 |
Top |
Cell-cell communication analysis |
| Identification of potential cell-cell interactions between two cell types and their ligand-receptor pairs for different disease states |
| Ligand | Receptor | LRpair | Pathway | Tissue | Disease Stage |
| BMP6 | BMPR1A_BMPR2 | BMP6_BMPR1A_BMPR2 | BMP | CRC | AD |
| BMP6 | BMPR1A_ACVR2A | BMP6_BMPR1A_ACVR2A | BMP | CRC | ADJ |
| BMP6 | BMPR1A_BMPR2 | BMP6_BMPR1A_BMPR2 | BMP | CRC | ADJ |
| BMP6 | BMPR1A_ACVR2A | BMP6_BMPR1A_ACVR2A | BMP | CRC | FAP |
| BMP6 | BMPR1A_BMPR2 | BMP6_BMPR1A_BMPR2 | BMP | CRC | FAP |
| BMP6 | ACVR1_ACVR2A | BMP6_ACVR1_ACVR2A | BMP | CRC | MSI-H |
| BMP6 | ACVR1_ACVR2B | BMP6_ACVR1_ACVR2B | BMP | CRC | MSI-H |
| BMP6 | ACVR1_BMPR2 | BMP6_ACVR1_BMPR2 | BMP | CRC | MSI-H |
| BMP6 | BMPR1A_ACVR2A | BMP6_BMPR1A_ACVR2A | BMP | CRC | MSI-H |
| BMP6 | BMPR1A_ACVR2B | BMP6_BMPR1A_ACVR2B | BMP | CRC | MSI-H |
| BMP6 | BMPR1A_BMPR2 | BMP6_BMPR1A_BMPR2 | BMP | CRC | MSI-H |
| BMP6 | BMPR1A_BMPR2 | BMP6_BMPR1A_BMPR2 | BMP | CRC | SER |
| BMP6 | ACVR1_BMPR2 | BMP6_ACVR1_BMPR2 | BMP | HNSCC | Precancer |
| BMP6 | BMPR1A_BMPR2 | BMP6_BMPR1A_BMPR2 | BMP | HNSCC | Precancer |
| BMP6 | ACVR1_ACVR2A | BMP6_ACVR1_ACVR2A | BMP | Liver | Healthy |
| BMP6 | ACVR1_ACVR2B | BMP6_ACVR1_ACVR2B | BMP | Liver | Healthy |
| BMP6 | ACVR1_BMPR2 | BMP6_ACVR1_BMPR2 | BMP | Liver | Healthy |
| BMP6 | BMPR1A_ACVR2A | BMP6_BMPR1A_ACVR2A | BMP | Liver | Healthy |
| BMP6 | BMPR1A_ACVR2B | BMP6_BMPR1A_ACVR2B | BMP | Liver | Healthy |
| BMP6 | BMPR1A_BMPR2 | BMP6_BMPR1A_BMPR2 | BMP | Liver | Healthy |
| Page: 1 2 |
Top |
Single-cell gene regulatory network inference analysis |
| Find out the significant the regulons (TFs) and the target genes of each regulon across cell types for different disease states |
| TF | Cell Type | Tissue | Disease Stage | Target Gene | RSS | Regulon Activity |
| ∗The dot plots of a searched regulon are shown for all cell subpopulations in each disease state of each tissue based on the regulon specific score inferred using pySCENIC and by calculating the average expression. |
| Page: 1 |
Top |
Somatic mutation of malignant transformation related genes |
| Annotation of somatic variants for genes involved in malignant transformation |
| Hugo Symbol | Variant Class | Variant Classification | dbSNP RS | HGVSc | HGVSp | HGVSp Short | SWISSPROT | BIOTYPE | SIFT | PolyPhen | Tumor Sample Barcode | Tissue | Histology | Sex | Age | Stage | Therapy Types | Drugs | Outcome |
| BMP6 | SNV | Missense_Mutation | rs566660170 | c.692G>A | p.Arg231His | p.R231H | P22004 | protein_coding | tolerated(0.42) | benign(0.009) | TCGA-A8-A092-01 | Breast | breast invasive carcinoma | Female | <65 | III/IV | Chemotherapy | paclitaxel | CR |
| BMP6 | SNV | Missense_Mutation | novel | c.1509N>T | p.Arg503Ser | p.R503S | P22004 | protein_coding | deleterious(0) | probably_damaging(0.982) | TCGA-BH-A1FU-01 | Breast | breast invasive carcinoma | Female | <65 | I/II | Unknown | Unknown | PD |
| BMP6 | SNV | Missense_Mutation | c.832N>G | p.Gln278Glu | p.Q278E | P22004 | protein_coding | tolerated(0.55) | probably_damaging(0.991) | TCGA-E2-A15S-01 | Breast | breast invasive carcinoma | Female | <65 | I/II | Chemotherapy | doxorubicin | SD | |
| BMP6 | insertion | Nonsense_Mutation | novel | c.1421_1422insATAGGACATACATTTATTTGGGCATTTAAACAAATTTTAATTGAGA | p.Lys475Ter | p.K475* | P22004 | protein_coding | TCGA-A7-A0CJ-01 | Breast | breast invasive carcinoma | Female | <65 | I/II | Chemotherapy | cytoxan | SD | ||
| BMP6 | insertion | Nonsense_Mutation | novel | c.1472_1473insGCAGCCATTACCAAACACCCAGAGCTTGATTGAAGGCTGAGC | p.Phe491delinsLeuGlnProLeuProAsnThrGlnSerLeuIleGluGlyTerAla | p.F491delinsLQPLPNTQSLIEG*A | P22004 | protein_coding | TCGA-A8-A0A2-01 | Breast | breast invasive carcinoma | Female | >=65 | I/II | Hormone Therapy | tamoxiphen | SD | ||
| BMP6 | SNV | Missense_Mutation | rs771664465 | c.934N>A | p.Ala312Thr | p.A312T | P22004 | protein_coding | deleterious(0.05) | possibly_damaging(0.53) | TCGA-EA-A3HU-01 | Cervix | cervical & endocervical cancer | Female | <65 | I/II | Unknown | Unknown | SD |
| BMP6 | SNV | Missense_Mutation | rs781335360 | c.991N>A | p.Val331Met | p.V331M | P22004 | protein_coding | deleterious(0) | probably_damaging(0.973) | TCGA-VS-A9V4-01 | Cervix | cervical & endocervical cancer | Female | <65 | I/II | Chemotherapy | cisplatin | PD |
| BMP6 | SNV | Missense_Mutation | rs577694907 | c.1139G>A | p.Arg380His | p.R380H | P22004 | protein_coding | deleterious(0.05) | benign(0.072) | TCGA-A6-5665-01 | Colorectum | colon adenocarcinoma | Female | >=65 | I/II | Unknown | Unknown | PD |
| BMP6 | SNV | Missense_Mutation | c.1394N>C | p.Val465Ala | p.V465A | P22004 | protein_coding | deleterious(0) | probably_damaging(1) | TCGA-AA-3672-01 | Colorectum | colon adenocarcinoma | Female | >=65 | III/IV | Unknown | Unknown | SD | |
| BMP6 | SNV | Missense_Mutation | c.1227A>C | p.Lys409Asn | p.K409N | P22004 | protein_coding | deleterious(0.02) | probably_damaging(0.975) | TCGA-AA-A00N-01 | Colorectum | colon adenocarcinoma | Male | >=65 | I/II | Unknown | Unknown | PD |
| Page: 1 2 3 4 5 6 |
Top |
Related drugs of malignant transformation related genes |
| Identification of chemicals and drugs interact with genes involved in malignant transfromation |
| (DGIdb 4.0) |
| Entrez ID | Symbol | Category | Interaction Types | Drug Claim Name | Drug Name | PMIDs |
| Page: 1 |

Copyright 2023-Present -The University of Texas Health Science Center at Houston |