| Tissue | Expression Dynamics | Abbreviation |
| Colorectum (GSE201348) |  | FAP: Familial adenomatous polyposis |
| CRC: Colorectal cancer |
| Colorectum (HTA11) |  | AD: Adenomas |
| SER: Sessile serrated lesions |
| MSI-H: Microsatellite-high colorectal cancer |
| MSS: Microsatellite stable colorectal cancer |
| Esophagus |  | ESCC: Esophageal squamous cell carcinoma |
| HGIN: High-grade intraepithelial neoplasias |
| LGIN: Low-grade intraepithelial neoplasias |
| Liver | 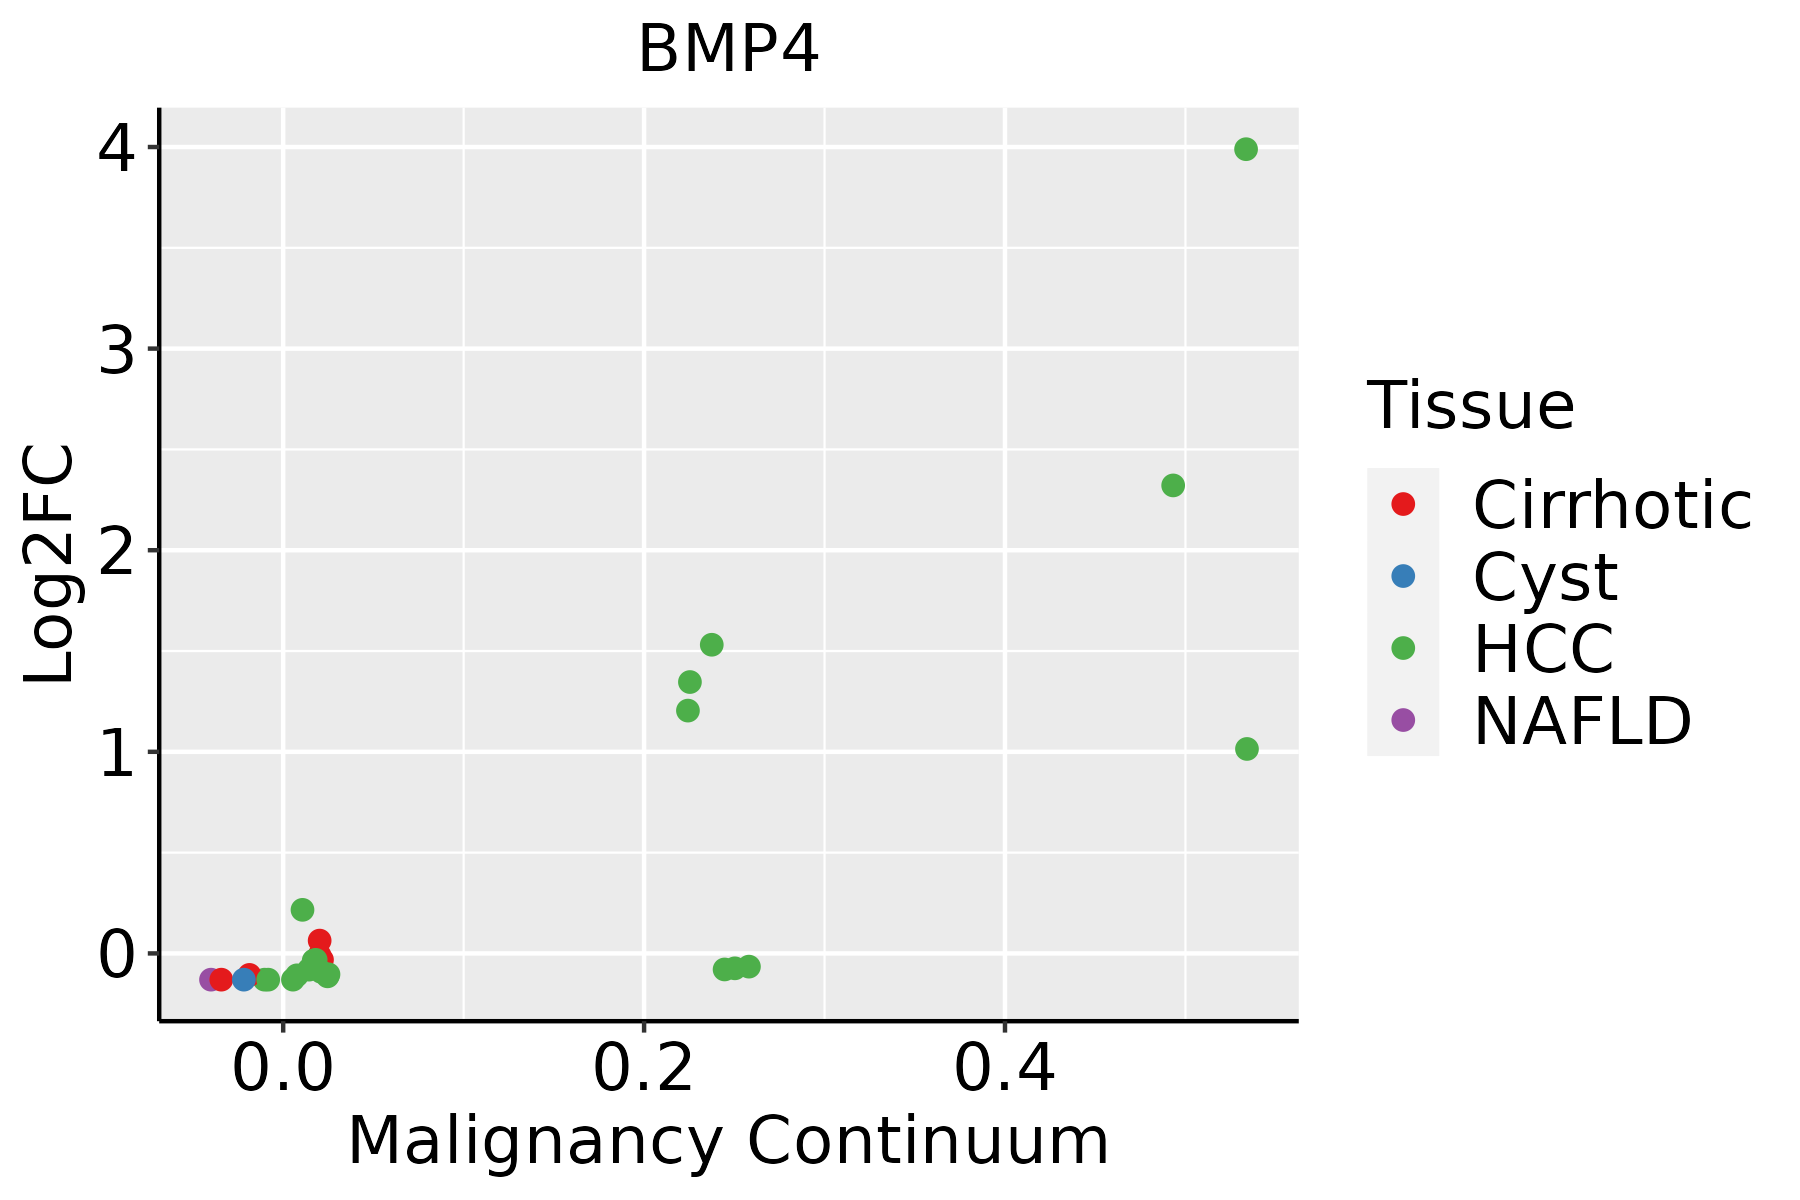 | HCC: Hepatocellular carcinoma |
| NAFLD: Non-alcoholic fatty liver disease |
| Oral Cavity |  | EOLP: Erosive Oral lichen planus |
| LP: leukoplakia |
| NEOLP: Non-erosive oral lichen planus |
| OSCC: Oral squamous cell carcinoma |
| GO ID | Tissue | Disease Stage | Description | Gene Ratio | Bg Ratio | pvalue | p.adjust | Count |
| GO:0072594 | Colorectum | AD | establishment of protein localization to organelle | 148/3918 | 422/18723 | 7.95e-12 | 1.04e-09 | 148 |
| GO:0002064 | Colorectum | AD | epithelial cell development | 89/3918 | 220/18723 | 2.98e-11 | 3.52e-09 | 89 |
| GO:0048732 | Colorectum | AD | gland development | 149/3918 | 436/18723 | 6.07e-11 | 6.33e-09 | 149 |
| GO:0051098 | Colorectum | AD | regulation of binding | 126/3918 | 363/18723 | 6.01e-10 | 4.88e-08 | 126 |
| GO:2001233 | Colorectum | AD | regulation of apoptotic signaling pathway | 119/3918 | 356/18723 | 2.14e-08 | 1.21e-06 | 119 |
| GO:0006913 | Colorectum | AD | nucleocytoplasmic transport | 102/3918 | 301/18723 | 1.00e-07 | 4.85e-06 | 102 |
| GO:0051169 | Colorectum | AD | nuclear transport | 102/3918 | 301/18723 | 1.00e-07 | 4.85e-06 | 102 |
| GO:0010639 | Colorectum | AD | negative regulation of organelle organization | 114/3918 | 348/18723 | 1.41e-07 | 6.49e-06 | 114 |
| GO:0051099 | Colorectum | AD | positive regulation of binding | 66/3918 | 173/18723 | 1.47e-07 | 6.64e-06 | 66 |
| GO:1900180 | Colorectum | AD | regulation of protein localization to nucleus | 55/3918 | 136/18723 | 1.70e-07 | 7.34e-06 | 55 |
| GO:0032386 | Colorectum | AD | regulation of intracellular transport | 109/3918 | 337/18723 | 5.33e-07 | 1.95e-05 | 109 |
| GO:0033157 | Colorectum | AD | regulation of intracellular protein transport | 80/3918 | 229/18723 | 5.81e-07 | 2.09e-05 | 80 |
| GO:0071383 | Colorectum | AD | cellular response to steroid hormone stimulus | 73/3918 | 204/18723 | 6.31e-07 | 2.24e-05 | 73 |
| GO:0034101 | Colorectum | AD | erythrocyte homeostasis | 51/3918 | 129/18723 | 1.07e-06 | 3.59e-05 | 51 |
| GO:0030099 | Colorectum | AD | myeloid cell differentiation | 119/3918 | 381/18723 | 1.24e-06 | 4.01e-05 | 119 |
| GO:0030879 | Colorectum | AD | mammary gland development | 53/3918 | 137/18723 | 1.46e-06 | 4.58e-05 | 53 |
| GO:0034504 | Colorectum | AD | protein localization to nucleus | 94/3918 | 290/18723 | 2.83e-06 | 8.09e-05 | 94 |
| GO:0043393 | Colorectum | AD | regulation of protein binding | 68/3918 | 196/18723 | 5.17e-06 | 1.34e-04 | 68 |
| GO:0002262 | Colorectum | AD | myeloid cell homeostasis | 57/3918 | 157/18723 | 6.17e-06 | 1.56e-04 | 57 |
| GO:0043401 | Colorectum | AD | steroid hormone mediated signaling pathway | 51/3918 | 136/18723 | 6.52e-06 | 1.63e-04 | 51 |
| Pathway ID | Tissue | Disease Stage | Description | Gene Ratio | Bg Ratio | pvalue | p.adjust | qvalue | Count |
| hsa04919 | Colorectum | AD | Thyroid hormone signaling pathway | 51/2092 | 121/8465 | 1.71e-05 | 1.73e-04 | 1.10e-04 | 51 |
| hsa05418 | Colorectum | AD | Fluid shear stress and atherosclerosis | 54/2092 | 139/8465 | 1.41e-04 | 1.16e-03 | 7.37e-04 | 54 |
| hsa049191 | Colorectum | AD | Thyroid hormone signaling pathway | 51/2092 | 121/8465 | 1.71e-05 | 1.73e-04 | 1.10e-04 | 51 |
| hsa054181 | Colorectum | AD | Fluid shear stress and atherosclerosis | 54/2092 | 139/8465 | 1.41e-04 | 1.16e-03 | 7.37e-04 | 54 |
| hsa049192 | Colorectum | SER | Thyroid hormone signaling pathway | 40/1580 | 121/8465 | 1.02e-04 | 1.06e-03 | 7.67e-04 | 40 |
| hsa054182 | Colorectum | SER | Fluid shear stress and atherosclerosis | 40/1580 | 139/8465 | 2.28e-03 | 1.75e-02 | 1.27e-02 | 40 |
| hsa049193 | Colorectum | SER | Thyroid hormone signaling pathway | 40/1580 | 121/8465 | 1.02e-04 | 1.06e-03 | 7.67e-04 | 40 |
| hsa054183 | Colorectum | SER | Fluid shear stress and atherosclerosis | 40/1580 | 139/8465 | 2.28e-03 | 1.75e-02 | 1.27e-02 | 40 |
| hsa049194 | Colorectum | MSS | Thyroid hormone signaling pathway | 46/1875 | 121/8465 | 5.04e-05 | 4.97e-04 | 3.05e-04 | 46 |
| hsa054184 | Colorectum | MSS | Fluid shear stress and atherosclerosis | 51/1875 | 139/8465 | 6.06e-05 | 5.80e-04 | 3.55e-04 | 51 |
| hsa04390 | Colorectum | MSS | Hippo signaling pathway | 48/1875 | 157/8465 | 8.32e-03 | 3.10e-02 | 1.90e-02 | 48 |
| hsa049195 | Colorectum | MSS | Thyroid hormone signaling pathway | 46/1875 | 121/8465 | 5.04e-05 | 4.97e-04 | 3.05e-04 | 46 |
| hsa054185 | Colorectum | MSS | Fluid shear stress and atherosclerosis | 51/1875 | 139/8465 | 6.06e-05 | 5.80e-04 | 3.55e-04 | 51 |
| hsa043901 | Colorectum | MSS | Hippo signaling pathway | 48/1875 | 157/8465 | 8.32e-03 | 3.10e-02 | 1.90e-02 | 48 |
| hsa054186 | Colorectum | MSI-H | Fluid shear stress and atherosclerosis | 25/797 | 139/8465 | 1.11e-03 | 1.20e-02 | 1.01e-02 | 25 |
| hsa049196 | Colorectum | MSI-H | Thyroid hormone signaling pathway | 21/797 | 121/8465 | 4.18e-03 | 4.10e-02 | 3.44e-02 | 21 |
| hsa054187 | Colorectum | MSI-H | Fluid shear stress and atherosclerosis | 25/797 | 139/8465 | 1.11e-03 | 1.20e-02 | 1.01e-02 | 25 |
| hsa049197 | Colorectum | MSI-H | Thyroid hormone signaling pathway | 21/797 | 121/8465 | 4.18e-03 | 4.10e-02 | 3.44e-02 | 21 |
| hsa049198 | Colorectum | FAP | Thyroid hormone signaling pathway | 41/1404 | 121/8465 | 2.28e-06 | 4.28e-05 | 2.60e-05 | 41 |
| hsa054188 | Colorectum | FAP | Fluid shear stress and atherosclerosis | 45/1404 | 139/8465 | 3.05e-06 | 4.63e-05 | 2.81e-05 | 45 |
| Hugo Symbol | Variant Class | Variant Classification | dbSNP RS | HGVSc | HGVSp | HGVSp Short | SWISSPROT | BIOTYPE | SIFT | PolyPhen | Tumor Sample Barcode | Tissue | Histology | Sex | Age | Stage | Therapy Types | Drugs | Outcome |
| BMP4 | SNV | Missense_Mutation | | c.404A>T | p.Asn135Ile | p.N135I | P12644 | protein_coding | tolerated(0.12) | benign(0.1) | TCGA-AN-A0AR-01 | Breast | breast invasive carcinoma | Female | <65 | I/II | Unknown | Unknown | SD |
| BMP4 | SNV | Missense_Mutation | rs747238009 | c.340N>T | p.Ala114Ser | p.A114S | P12644 | protein_coding | deleterious(0.04) | probably_damaging(0.999) | TCGA-E9-A295-01 | Breast | breast invasive carcinoma | Female | >=65 | I/II | Hormone Therapy | tamoxiphen | SD |
| BMP4 | deletion | Frame_Shift_Del | novel | c.179delN | p.Thr60AsnfsTer58 | p.T60Nfs*58 | P12644 | protein_coding | | | TCGA-D8-A27V-01 | Breast | breast invasive carcinoma | Female | <65 | I/II | Hormone Therapy | tamoxiphen | SD |
| BMP4 | SNV | Missense_Mutation | rs750868626 | c.1223N>A | p.Arg408His | p.R408H | P12644 | protein_coding | deleterious(0) | probably_damaging(0.999) | TCGA-2W-A8YY-01 | Cervix | cervical & endocervical cancer | Female | <65 | I/II | Chemotherapy | cisplatin | CR |
| BMP4 | SNV | Missense_Mutation | rs773416502 | c.484N>T | p.Arg162Trp | p.R162W | P12644 | protein_coding | deleterious(0) | probably_damaging(1) | TCGA-2W-A8YY-01 | Cervix | cervical & endocervical cancer | Female | <65 | I/II | Chemotherapy | cisplatin | CR |
| BMP4 | SNV | Missense_Mutation | novel | c.646N>C | p.Asp216His | p.D216H | P12644 | protein_coding | deleterious(0) | probably_damaging(0.946) | TCGA-C5-A2LZ-01 | Cervix | cervical & endocervical cancer | Female | >=65 | III/IV | Unknown | Unknown | PD |
| BMP4 | SNV | Missense_Mutation | | c.464N>G | p.Ser155Cys | p.S155C | P12644 | protein_coding | deleterious(0.01) | probably_damaging(0.976) | TCGA-IR-A3LL-01 | Cervix | cervical & endocervical cancer | Female | <65 | I/II | Chemotherapy | cisplatin | CR |
| BMP4 | SNV | Missense_Mutation | | c.313N>C | p.Glu105Gln | p.E105Q | P12644 | protein_coding | tolerated(0.7) | benign(0.015) | TCGA-UC-A7PF-01 | Cervix | cervical & endocervical cancer | Female | <65 | I/II | Unknown | Unknown | SD |
| BMP4 | SNV | Missense_Mutation | novel | c.239N>T | p.Pro80Leu | p.P80L | P12644 | protein_coding | deleterious(0) | probably_damaging(0.995) | TCGA-VS-A959-01 | Cervix | cervical & endocervical cancer | Female | >=65 | I/II | Unknown | Unknown | SD |
| BMP4 | SNV | Missense_Mutation | novel | c.1154A>G | p.Tyr385Cys | p.Y385C | P12644 | protein_coding | deleterious(0) | probably_damaging(1) | TCGA-AA-3811-01 | Colorectum | colon adenocarcinoma | Female | >=65 | III/IV | Unknown | Unknown | PD |


