
|
|||||
|
 | |
| |
| |
| |
| |
| |
|
Gene: BMP2 |
Gene summary for BMP2 |
| Gene information | Species | Human | Gene symbol | BMP2 | Gene ID | 650 |
| Gene name | bone morphogenetic protein 2 | |
| Gene Alias | BDA2 | |
| Cytomap | 20p12.3 | |
| Gene Type | protein-coding | GO ID | GO:0000122 | UniProtAcc | C8C060 |
Top |
Malignant transformation analysis |
| Identification of the aberrant gene expression in precancerous and cancerous lesions by comparing the gene expression of stem-like cells in diseased tissues with normal stem cells |
| Entrez ID | Symbol | Replicates | Species | Organ | Tissue | Adj P-value | Log2FC | Malignancy |
| 650 | BMP2 | AEH-subject3 | Human | Endometrium | AEH | 3.87e-05 | -1.08e-01 | -0.2576 |
| 650 | BMP2 | AEH-subject4 | Human | Endometrium | AEH | 1.17e-02 | -1.08e-01 | -0.2657 |
| 650 | BMP2 | AEH-subject5 | Human | Endometrium | AEH | 3.87e-05 | -1.04e-01 | -0.2953 |
| 650 | BMP2 | EEC-subject3 | Human | Endometrium | EEC | 2.79e-05 | -4.58e-02 | -0.2525 |
| 650 | BMP2 | EEC-subject5 | Human | Endometrium | EEC | 3.71e-04 | -1.08e-01 | -0.249 |
| 650 | BMP2 | GSM5276934 | Human | Endometrium | EEC | 1.36e-22 | 7.64e-01 | -0.0913 |
| 650 | BMP2 | GSM5276937 | Human | Endometrium | EEC | 5.33e-25 | 7.57e-01 | -0.0897 |
| 650 | BMP2 | GSM6177620_NYU_UCEC1_lib2_lib2 | Human | Endometrium | EEC | 4.67e-04 | -5.12e-02 | -0.1875 |
| 650 | BMP2 | GSM6177621_NYU_UCEC2_lib1_lib1 | Human | Endometrium | EEC | 3.51e-03 | -1.08e-01 | -0.1934 |
| 650 | BMP2 | GSM6177622_NYU_UCEC3_lib1_lib1 | Human | Endometrium | EEC | 8.23e-05 | -1.08e-01 | -0.1917 |
| 650 | BMP2 | GSM6177622_NYU_UCEC3_lib2_lib2 | Human | Endometrium | EEC | 5.97e-05 | -1.08e-01 | -0.1916 |
| 650 | BMP2 | LZE4T | Human | Esophagus | ESCC | 1.56e-02 | -4.23e-01 | 0.0811 |
| 650 | BMP2 | LZE8T | Human | Esophagus | ESCC | 4.52e-06 | -3.25e-01 | 0.067 |
| 650 | BMP2 | LZE24T | Human | Esophagus | ESCC | 1.37e-04 | -3.50e-01 | 0.0596 |
| 650 | BMP2 | P2T-E | Human | Esophagus | ESCC | 1.85e-13 | -2.72e-01 | 0.1177 |
| 650 | BMP2 | P5T-E | Human | Esophagus | ESCC | 1.23e-02 | -1.52e-02 | 0.1327 |
| 650 | BMP2 | P8T-E | Human | Esophagus | ESCC | 1.55e-03 | -8.66e-02 | 0.0889 |
| 650 | BMP2 | P11T-E | Human | Esophagus | ESCC | 4.01e-06 | 1.32e+00 | 0.1426 |
| 650 | BMP2 | P12T-E | Human | Esophagus | ESCC | 4.07e-09 | -3.44e-01 | 0.1122 |
| 650 | BMP2 | P15T-E | Human | Esophagus | ESCC | 3.32e-02 | -3.30e-01 | 0.1149 |
| Page: 1 2 3 4 5 |
| Tissue | Expression Dynamics | Abbreviation |
| Endometrium | 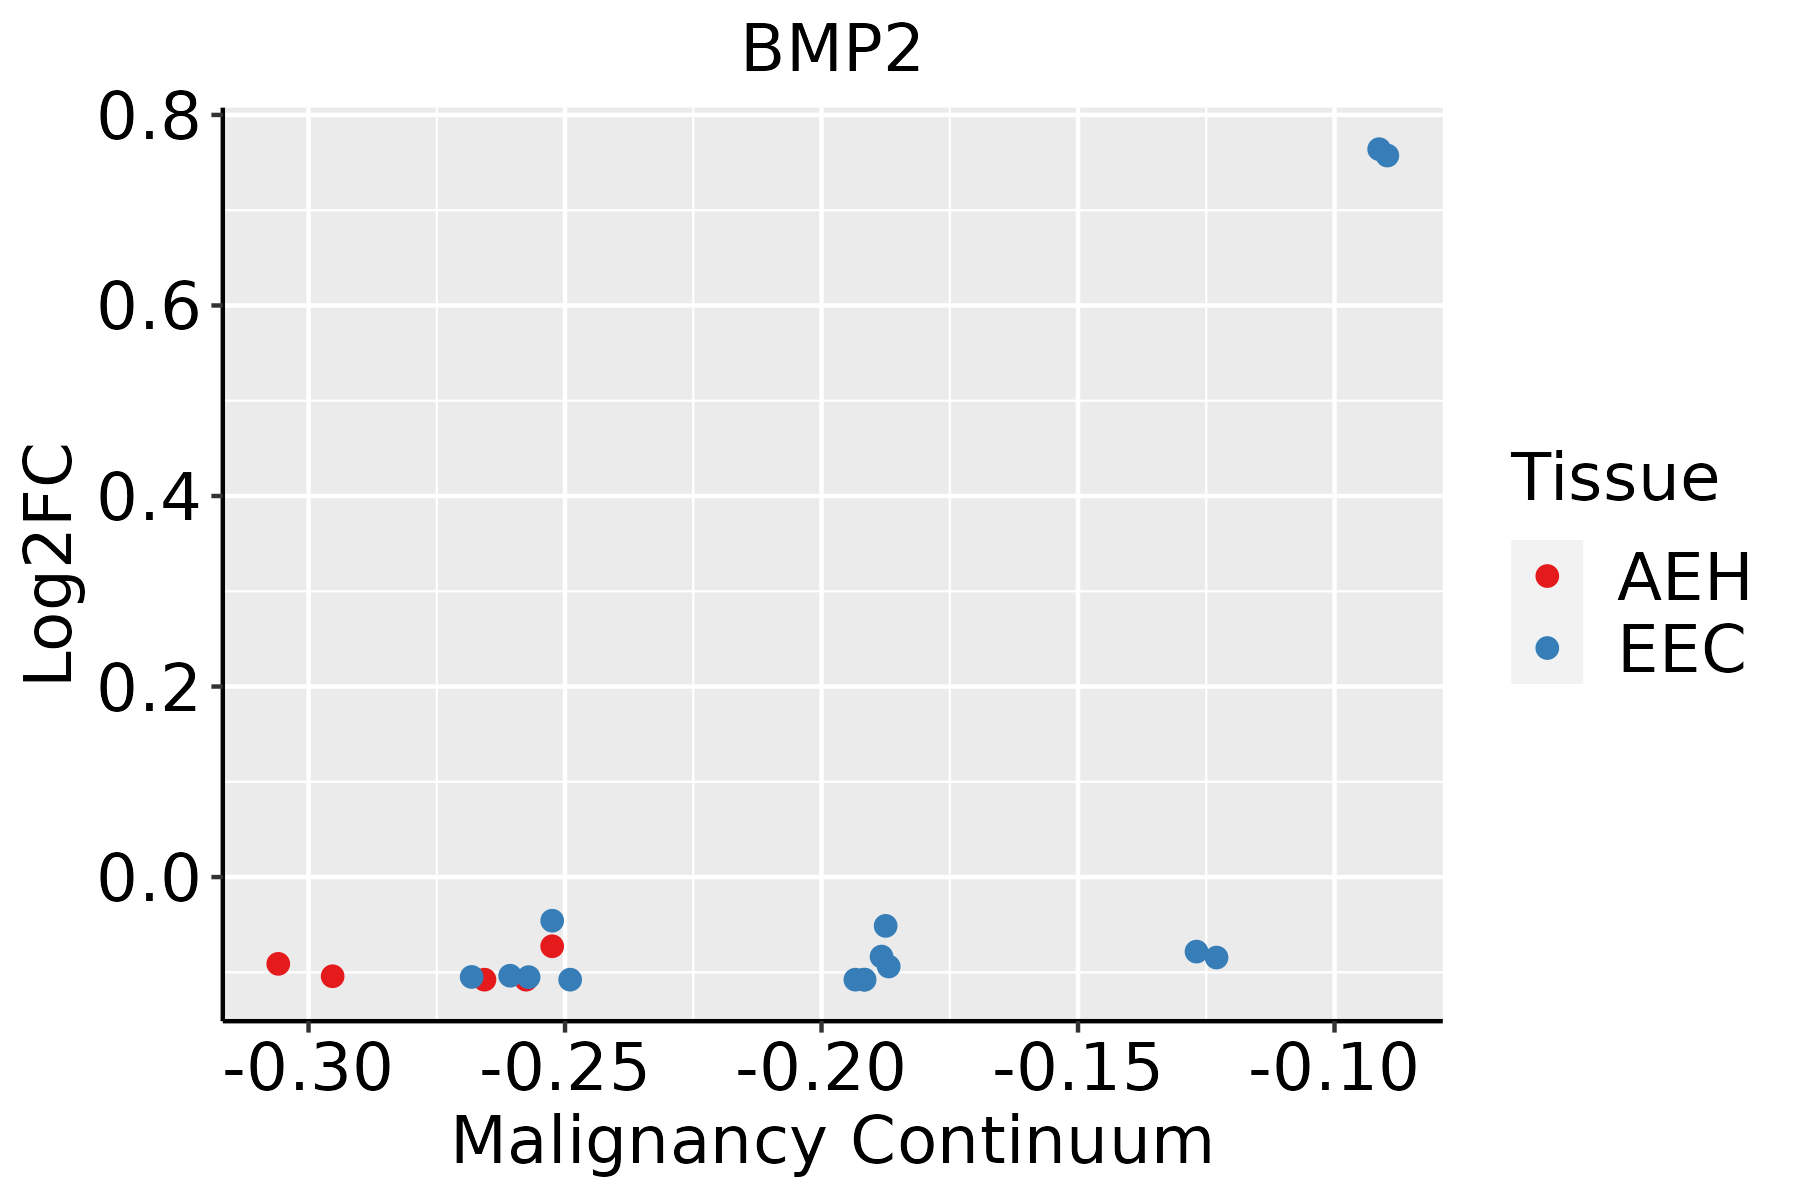 | AEH: Atypical endometrial hyperplasia |
| EEC: Endometrioid Cancer | ||
| Esophagus | 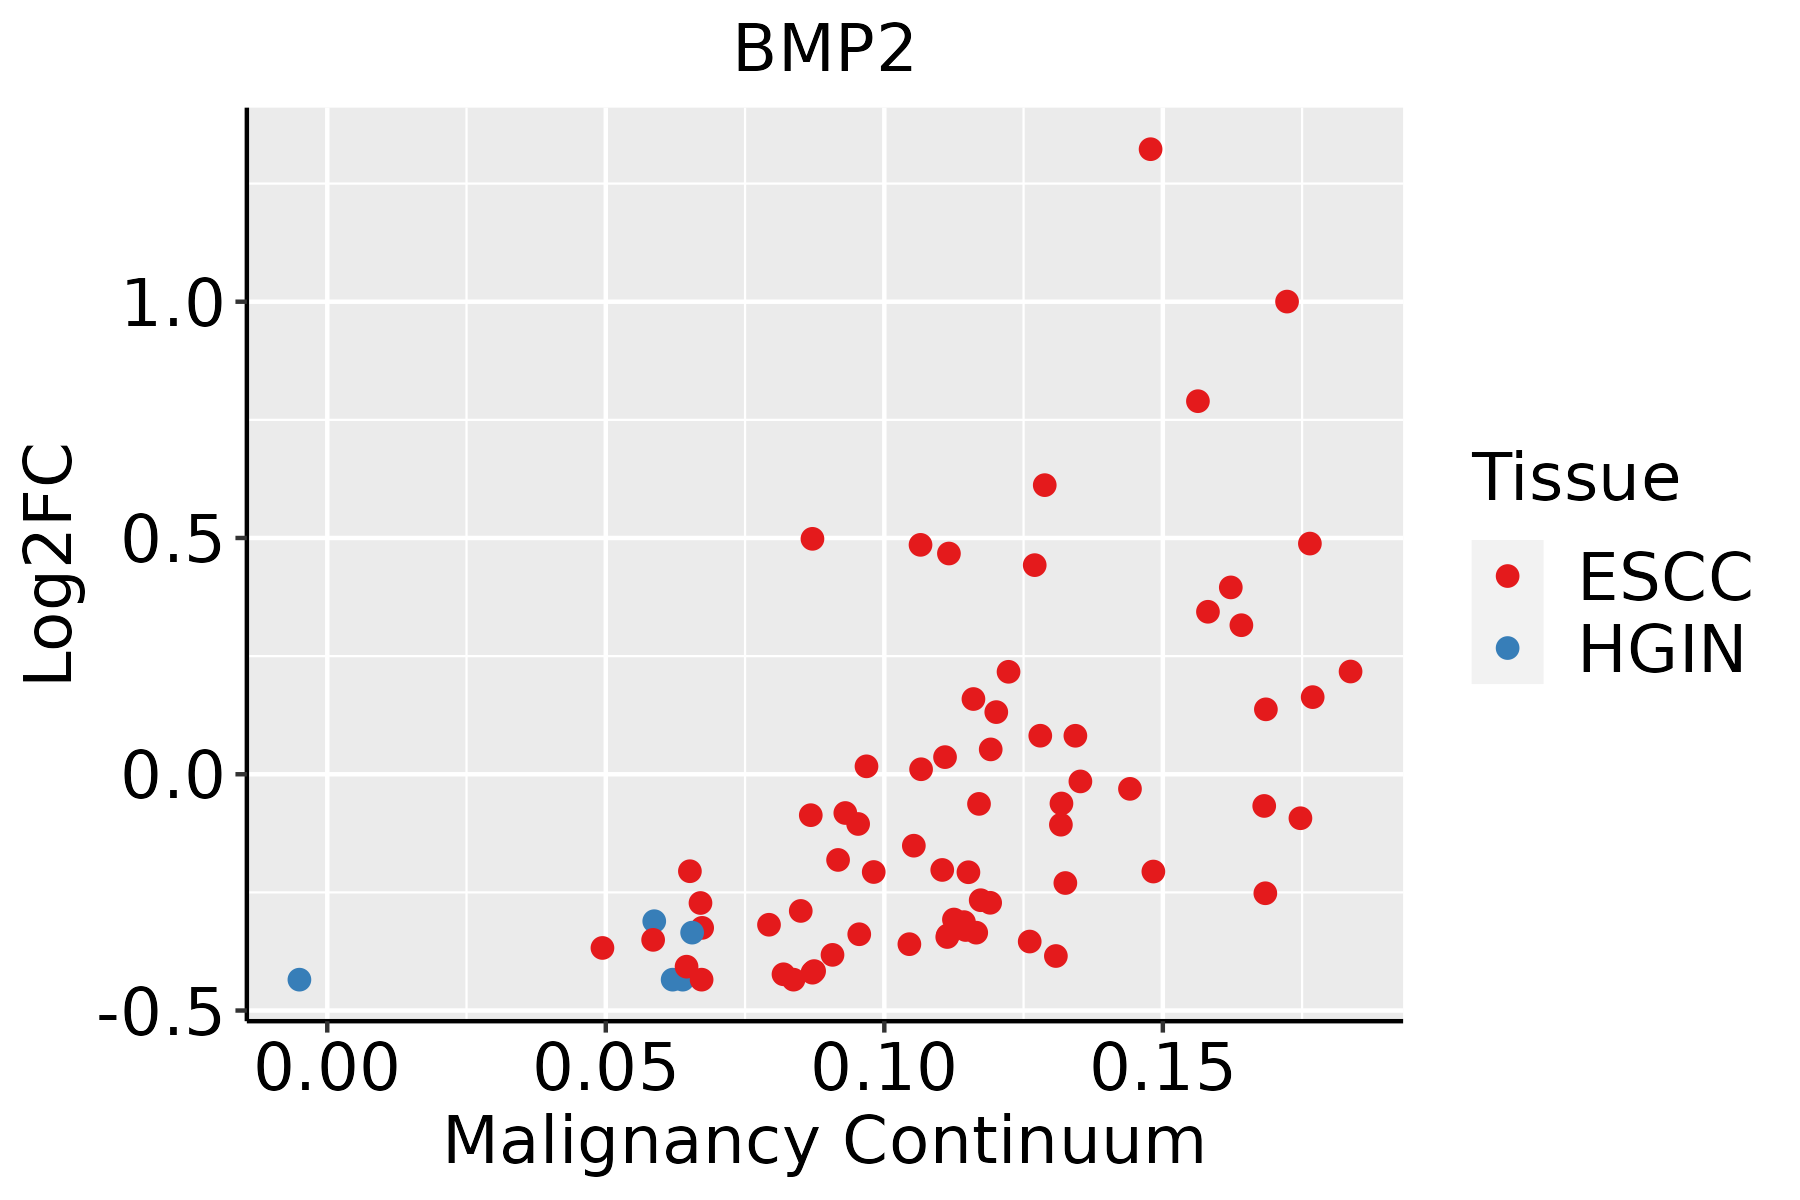 | ESCC: Esophageal squamous cell carcinoma |
| HGIN: High-grade intraepithelial neoplasias | ||
| LGIN: Low-grade intraepithelial neoplasias | ||
| GC |  | CAG: Chronic atrophic gastritis |
| CAG with IM: Chronic atrophic gastritis with intestinal metaplasia | ||
| CSG: Chronic superficial gastritis | ||
| GC: Gastric cancer | ||
| SIM: Severe intestinal metaplasia | ||
| WIM: Wild intestinal metaplasia | ||
| Oral Cavity |  | EOLP: Erosive Oral lichen planus |
| LP: leukoplakia | ||
| NEOLP: Non-erosive oral lichen planus | ||
| OSCC: Oral squamous cell carcinoma | ||
| Thyroid | 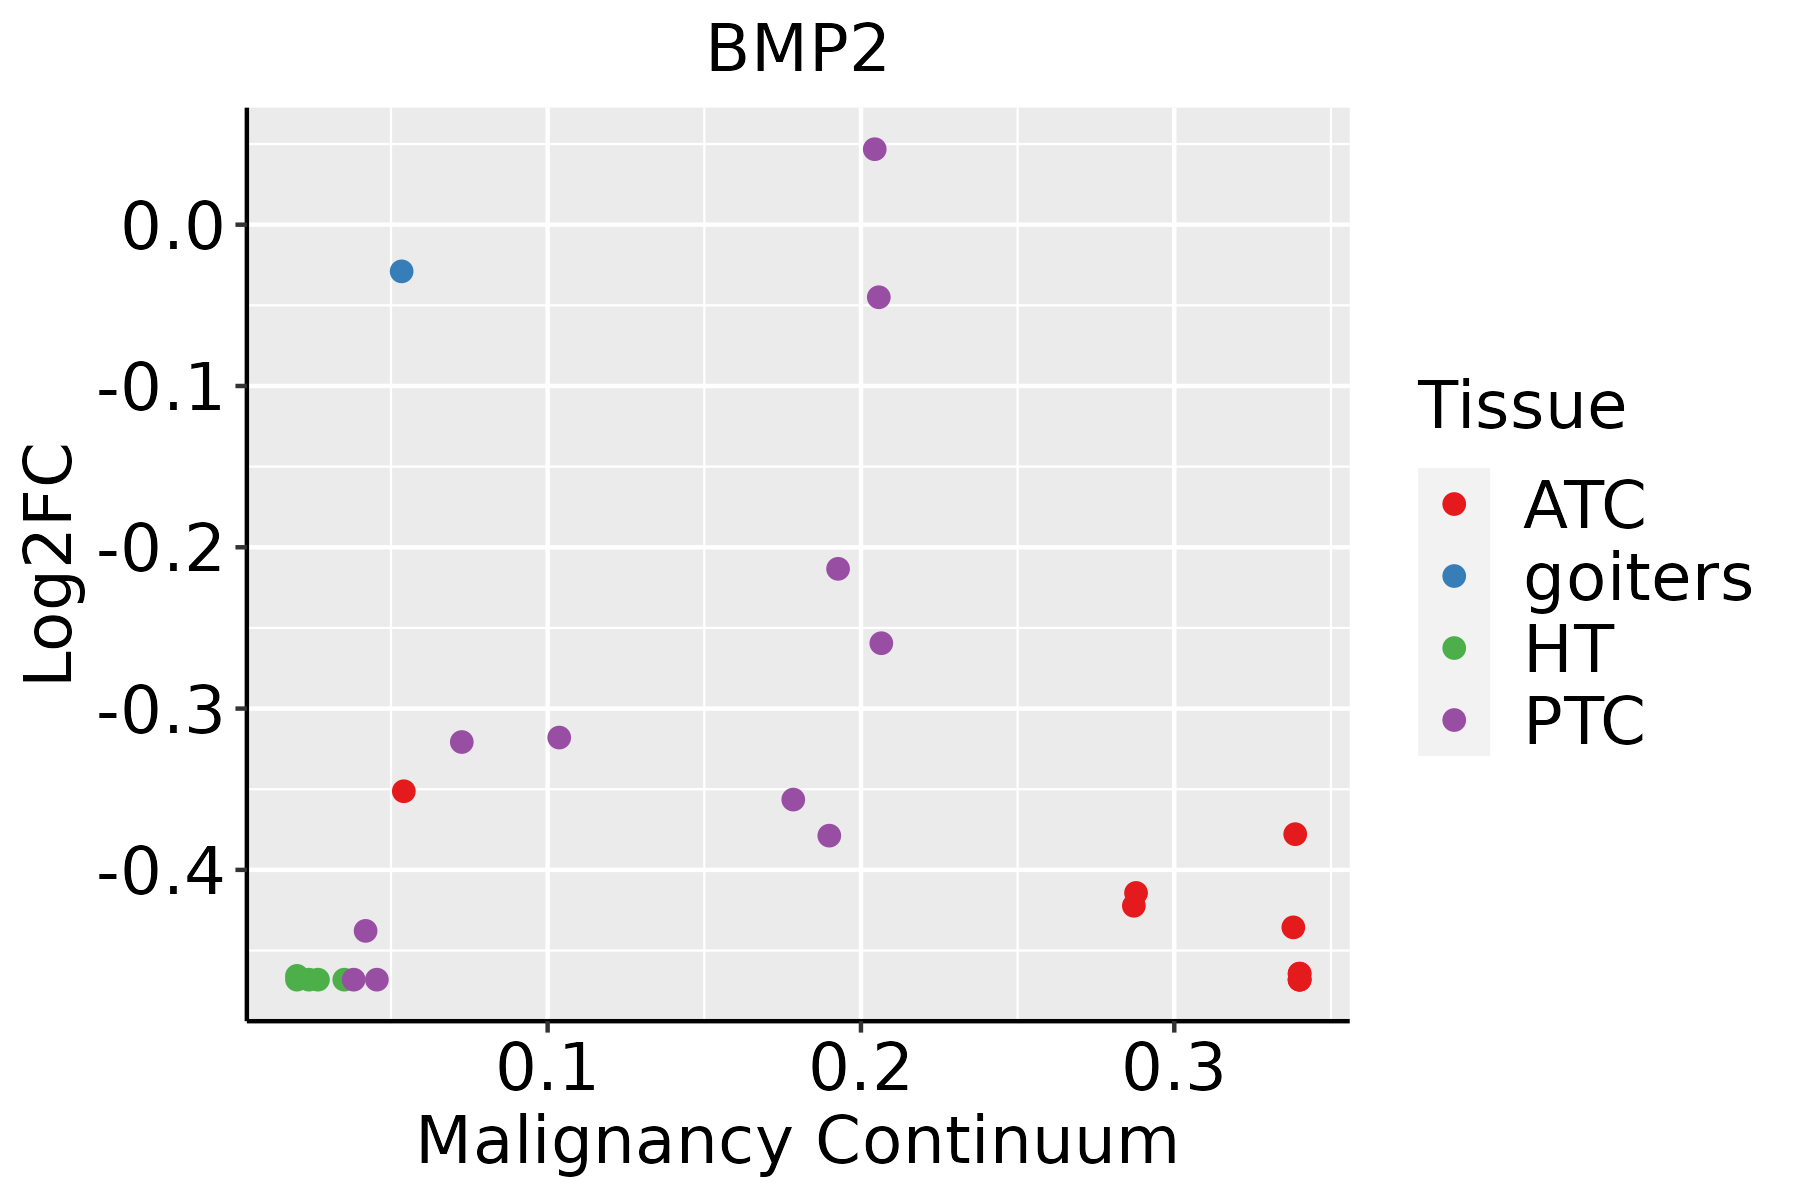 | ATC: Anaplastic thyroid cancer |
| HT: Hashimoto's thyroiditis | ||
| PTC: Papillary thyroid cancer |
| ∗log2FC in expression of this searched gene in stem-like cells from each diseased tissue sample relative to stem-like cells in normal samples in each tissue plotted against the malignancy continuum. Samples are colored based on if they are from different disease stage. |
Top |
Malignant transformation related pathway analysis |
| Find out the enriched GO biological processes and KEGG pathways involved in transition from healthy to precancer to cancer |
| Tissue | Disease Stage | Enriched GO biological Processes |
| Colorectum | AD |  |
| Colorectum | SER |  |
| Colorectum | MSS |  |
| Colorectum | MSI-H |  |
| Colorectum | FAP |  |
| ∗Top 15 enriched GO BP terms are showed in the bar plot of each disease state in each tissue. Each row represents a significant GO biological process which is colored according to the -log10(p.adjust). |
| Page: 1 2 3 4 5 6 7 8 9 |
| GO ID | Tissue | Disease Stage | Description | Gene Ratio | Bg Ratio | pvalue | p.adjust | Count |
| GO:00068987 | Cervix | CC | receptor-mediated endocytosis | 53/2311 | 244/18723 | 2.52e-05 | 4.29e-04 | 53 |
| GO:00301008 | Cervix | CC | regulation of endocytosis | 47/2311 | 211/18723 | 3.65e-05 | 5.82e-04 | 47 |
| GO:00725836 | Cervix | CC | clathrin-dependent endocytosis | 16/2311 | 47/18723 | 9.56e-05 | 1.25e-03 | 16 |
| GO:00072194 | Cervix | CC | Notch signaling pathway | 39/2311 | 172/18723 | 1.08e-04 | 1.38e-03 | 39 |
| GO:00085933 | Cervix | CC | regulation of Notch signaling pathway | 25/2311 | 95/18723 | 1.61e-04 | 1.93e-03 | 25 |
| GO:00015037 | Cervix | CC | ossification | 71/2311 | 408/18723 | 1.67e-03 | 1.28e-02 | 71 |
| GO:00482597 | Cervix | CC | regulation of receptor-mediated endocytosis | 24/2311 | 110/18723 | 3.62e-03 | 2.31e-02 | 24 |
| GO:0045747 | Cervix | CC | positive regulation of Notch signaling pathway | 13/2311 | 47/18723 | 3.62e-03 | 2.31e-02 | 13 |
| GO:00302781 | Cervix | CC | regulation of ossification | 24/2311 | 115/18723 | 6.51e-03 | 3.61e-02 | 24 |
| GO:0031214 | Cervix | CC | biomineral tissue development | 32/2311 | 169/18723 | 8.73e-03 | 4.48e-02 | 32 |
| GO:0030282 | Cervix | CC | bone mineralization | 24/2311 | 119/18723 | 1.00e-02 | 4.89e-02 | 24 |
| GO:0110148 | Cervix | CC | biomineralization | 32/2311 | 171/18723 | 1.04e-02 | 4.97e-02 | 32 |
| GO:000689814 | Cervix | HSIL_HPV | receptor-mediated endocytosis | 20/737 | 244/18723 | 1.64e-03 | 1.78e-02 | 20 |
| GO:000689824 | Cervix | N_HPV | receptor-mediated endocytosis | 17/534 | 244/18723 | 6.68e-04 | 8.57e-03 | 17 |
| GO:000721911 | Cervix | N_HPV | Notch signaling pathway | 12/534 | 172/18723 | 3.92e-03 | 3.08e-02 | 12 |
| GO:000150312 | Cervix | N_HPV | ossification | 21/534 | 408/18723 | 6.98e-03 | 4.61e-02 | 21 |
| GO:003010013 | Cervix | N_HPV | regulation of endocytosis | 13/534 | 211/18723 | 7.72e-03 | 4.97e-02 | 13 |
| GO:0072583 | Colorectum | AD | clathrin-dependent endocytosis | 24/3918 | 47/18723 | 4.60e-06 | 1.22e-04 | 24 |
| GO:0006898 | Colorectum | AD | receptor-mediated endocytosis | 76/3918 | 244/18723 | 1.07e-04 | 1.59e-03 | 76 |
| GO:0030100 | Colorectum | AD | regulation of endocytosis | 67/3918 | 211/18723 | 1.42e-04 | 2.01e-03 | 67 |
| Page: 1 2 3 4 5 6 7 8 9 10 11 12 13 14 15 16 17 18 19 20 21 22 23 24 25 26 27 28 29 30 31 32 33 34 35 36 37 38 39 40 41 42 43 44 45 46 47 48 49 50 51 52 53 54 55 56 |
| Pathway ID | Tissue | Disease Stage | Description | Gene Ratio | Bg Ratio | pvalue | p.adjust | qvalue | Count |
| hsa043909 | Endometrium | AEH | Hippo signaling pathway | 38/1197 | 157/8465 | 4.79e-04 | 3.38e-03 | 2.47e-03 | 38 |
| hsa043504 | Endometrium | AEH | TGF-beta signaling pathway | 26/1197 | 108/8465 | 3.82e-03 | 2.18e-02 | 1.59e-02 | 26 |
| hsa0439014 | Endometrium | AEH | Hippo signaling pathway | 38/1197 | 157/8465 | 4.79e-04 | 3.38e-03 | 2.47e-03 | 38 |
| hsa0435011 | Endometrium | AEH | TGF-beta signaling pathway | 26/1197 | 108/8465 | 3.82e-03 | 2.18e-02 | 1.59e-02 | 26 |
| hsa0439023 | Endometrium | EEC | Hippo signaling pathway | 39/1237 | 157/8465 | 4.54e-04 | 3.47e-03 | 2.59e-03 | 39 |
| hsa043502 | Endometrium | EEC | TGF-beta signaling pathway | 26/1237 | 108/8465 | 5.95e-03 | 3.12e-02 | 2.33e-02 | 26 |
| hsa0439033 | Endometrium | EEC | Hippo signaling pathway | 39/1237 | 157/8465 | 4.54e-04 | 3.47e-03 | 2.59e-03 | 39 |
| hsa043503 | Endometrium | EEC | TGF-beta signaling pathway | 26/1237 | 108/8465 | 5.95e-03 | 3.12e-02 | 2.33e-02 | 26 |
| hsa043507 | Esophagus | ESCC | TGF-beta signaling pathway | 69/4205 | 108/8465 | 1.92e-03 | 5.54e-03 | 2.84e-03 | 69 |
| hsa0439018 | Esophagus | ESCC | Hippo signaling pathway | 92/4205 | 157/8465 | 1.46e-02 | 3.31e-02 | 1.69e-02 | 92 |
| hsa0435014 | Esophagus | ESCC | TGF-beta signaling pathway | 69/4205 | 108/8465 | 1.92e-03 | 5.54e-03 | 2.84e-03 | 69 |
| hsa0439019 | Esophagus | ESCC | Hippo signaling pathway | 92/4205 | 157/8465 | 1.46e-02 | 3.31e-02 | 1.69e-02 | 92 |
| hsa0439016 | Oral cavity | OSCC | Hippo signaling pathway | 86/3704 | 157/8465 | 3.30e-03 | 8.24e-03 | 4.20e-03 | 86 |
| hsa0439017 | Oral cavity | OSCC | Hippo signaling pathway | 86/3704 | 157/8465 | 3.30e-03 | 8.24e-03 | 4.20e-03 | 86 |
| hsa043906 | Stomach | CAG with IM | Hippo signaling pathway | 21/640 | 157/8465 | 7.26e-03 | 4.05e-02 | 2.84e-02 | 21 |
| hsa0439011 | Stomach | CAG with IM | Hippo signaling pathway | 21/640 | 157/8465 | 7.26e-03 | 4.05e-02 | 2.84e-02 | 21 |
| hsa0439021 | Stomach | CSG | Hippo signaling pathway | 21/633 | 157/8465 | 6.42e-03 | 3.62e-02 | 2.61e-02 | 21 |
| hsa0439031 | Stomach | CSG | Hippo signaling pathway | 21/633 | 157/8465 | 6.42e-03 | 3.62e-02 | 2.61e-02 | 21 |
| Page: 1 |
Top |
Cell-cell communication analysis |
| Identification of potential cell-cell interactions between two cell types and their ligand-receptor pairs for different disease states |
| Ligand | Receptor | LRpair | Pathway | Tissue | Disease Stage |
| BMP2 | BMPR1A_BMPR2 | BMP2_BMPR1A_BMPR2 | BMP | CRC | AD |
| BMP2 | BMPR1A_ACVR2A | BMP2_BMPR1A_ACVR2A | BMP | CRC | ADJ |
| BMP2 | BMPR1A_BMPR2 | BMP2_BMPR1A_BMPR2 | BMP | CRC | ADJ |
| BMP2 | BMPR1A_ACVR2A | BMP2_BMPR1A_ACVR2A | BMP | CRC | FAP |
| BMP2 | BMPR1A_BMPR2 | BMP2_BMPR1A_BMPR2 | BMP | CRC | FAP |
| BMP2 | BMPR1A_ACVR2A | BMP2_BMPR1A_ACVR2A | BMP | CRC | Healthy |
| BMP2 | BMPR1A_BMPR2 | BMP2_BMPR1A_BMPR2 | BMP | CRC | Healthy |
| BMP2 | BMPR1A_BMPR2 | BMP2_BMPR1A_BMPR2 | BMP | Endometrium | AEH |
| BMP2 | BMPR1B_BMPR2 | BMP2_BMPR1B_BMPR2 | BMP | Endometrium | AEH |
| BMP2 | BMPR1A_BMPR2 | BMP2_BMPR1A_BMPR2 | BMP | Endometrium | EEC |
| BMP2 | BMPR1A_ACVR2B | BMP2_BMPR1A_ACVR2B | BMP | Esophagus | ESCC |
| BMP2 | BMPR1A_BMPR2 | BMP2_BMPR1A_BMPR2 | BMP | HNSCC | Precancer |
| BMP2 | BMPR1A_BMPR2 | BMP2_BMPR1A_BMPR2 | BMP | Lung | AAH |
| BMP2 | BMPR1B_BMPR2 | BMP2_BMPR1B_BMPR2 | BMP | Lung | AAH |
| BMP2 | BMPR1A_ACVR2A | BMP2_BMPR1A_ACVR2A | BMP | THCA | ADJ |
| BMP2 | BMPR1A_BMPR2 | BMP2_BMPR1A_BMPR2 | BMP | THCA | ADJ |
| Page: 1 |
Top |
Single-cell gene regulatory network inference analysis |
| Find out the significant the regulons (TFs) and the target genes of each regulon across cell types for different disease states |
| TF | Cell Type | Tissue | Disease Stage | Target Gene | RSS | Regulon Activity |
| ∗The dot plots of a searched regulon are shown for all cell subpopulations in each disease state of each tissue based on the regulon specific score inferred using pySCENIC and by calculating the average expression. |
| Page: 1 |
Top |
Somatic mutation of malignant transformation related genes |
| Annotation of somatic variants for genes involved in malignant transformation |
| Hugo Symbol | Variant Class | Variant Classification | dbSNP RS | HGVSc | HGVSp | HGVSp Short | SWISSPROT | BIOTYPE | SIFT | PolyPhen | Tumor Sample Barcode | Tissue | Histology | Sex | Age | Stage | Therapy Types | Drugs | Outcome |
| BMP2 | SNV | Missense_Mutation | rs759121274 | c.871N>T | p.Arg291Cys | p.R291C | P12643 | protein_coding | deleterious(0) | possibly_damaging(0.523) | TCGA-AN-A03X-01 | Breast | breast invasive carcinoma | Female | >=65 | I/II | Unknown | Unknown | SD |
| BMP2 | SNV | Missense_Mutation | novel | c.1099N>T | p.Ser367Cys | p.S367C | P12643 | protein_coding | deleterious(0) | probably_damaging(0.987) | TCGA-B6-A0I8-01 | Breast | breast invasive carcinoma | Female | <65 | I/II | Unknown | Unknown | PD |
| BMP2 | insertion | Frame_Shift_Ins | novel | c.1174_1175insAACTTACAGAACAGAGAGAAGGGAGGCTCCATGTTTATTTAAA | p.Gly392GlufsTer25 | p.G392Efs*25 | P12643 | protein_coding | TCGA-A8-A06O-01 | Breast | breast invasive carcinoma | Female | <65 | I/II | Hormone Therapy | letrozole | SD | ||
| BMP2 | insertion | In_Frame_Ins | novel | c.1101_1102insGTCCACTTAGCTTGCATGATGACTGTTGCTTTGATGATGAAG | p.Ser367_Ala368insValHisLeuAlaCysMetMetThrValAlaLeuMetMetLys | p.S367_A368insVHLACMMTVALMMK | P12643 | protein_coding | TCGA-B6-A0I8-01 | Breast | breast invasive carcinoma | Female | <65 | I/II | Unknown | Unknown | PD | ||
| BMP2 | insertion | Frame_Shift_Ins | novel | c.874_875insACGATGAGGT | p.Leu292HisfsTer5 | p.L292Hfs*5 | P12643 | protein_coding | TCGA-BH-A0HK-01 | Breast | breast invasive carcinoma | Female | >=65 | I/II | Hormone Therapy | arimidex | SD | ||
| BMP2 | SNV | Missense_Mutation | rs763897233 | c.73N>A | p.Val25Ile | p.V25I | P12643 | protein_coding | tolerated(1) | benign(0) | TCGA-VS-A957-01 | Cervix | cervical & endocervical cancer | Female | <65 | I/II | Chemotherapy | cisplatin | CR |
| BMP2 | SNV | Missense_Mutation | novel | c.113N>G | p.Ser38Trp | p.S38W | P12643 | protein_coding | deleterious(0.01) | benign(0.084) | TCGA-VS-A958-01 | Cervix | cervical & endocervical cancer | Female | <65 | I/II | Chemotherapy | cisplatin | CR |
| BMP2 | SNV | Missense_Mutation | novel | c.142G>A | p.Glu48Lys | p.E48K | P12643 | protein_coding | tolerated(0.21) | benign(0.009) | TCGA-VS-A959-01 | Cervix | cervical & endocervical cancer | Female | >=65 | I/II | Unknown | Unknown | SD |
| BMP2 | SNV | Missense_Mutation | rs756645581 | c.292C>T | p.Arg98Trp | p.R98W | P12643 | protein_coding | tolerated(0.17) | possibly_damaging(0.571) | TCGA-AA-3713-01 | Colorectum | colon adenocarcinoma | Male | >=65 | III/IV | Chemotherapy | 5-fluorouracil | PR |
| BMP2 | SNV | Missense_Mutation | rs190569855 | c.979N>A | p.Gly327Arg | p.G327R | P12643 | protein_coding | deleterious(0) | probably_damaging(1) | TCGA-AA-3811-01 | Colorectum | colon adenocarcinoma | Female | >=65 | III/IV | Unknown | Unknown | PD |
| Page: 1 2 3 4 5 6 |
Top |
Related drugs of malignant transformation related genes |
| Identification of chemicals and drugs interact with genes involved in malignant transfromation |
| (DGIdb 4.0) |
| Entrez ID | Symbol | Category | Interaction Types | Drug Claim Name | Drug Name | PMIDs |
| 650 | BMP2 | CELL SURFACE, GROWTH FACTOR, DRUGGABLE GENOME, TRANSCRIPTION FACTOR | BUTAMBEN | BUTAMBEN | 22041064 | |
| 650 | BMP2 | CELL SURFACE, GROWTH FACTOR, DRUGGABLE GENOME, TRANSCRIPTION FACTOR | METHYL 4-AMINOBENZOATE | CHEMBL1927048 | 22041064 | |
| 650 | BMP2 | CELL SURFACE, GROWTH FACTOR, DRUGGABLE GENOME, TRANSCRIPTION FACTOR | DWP-431 | |||
| 650 | BMP2 | CELL SURFACE, GROWTH FACTOR, DRUGGABLE GENOME, TRANSCRIPTION FACTOR | BUTYL 4-ACETAMIDOBENZOATE | CHEMBL1321401 | 22041064 | |
| 650 | BMP2 | CELL SURFACE, GROWTH FACTOR, DRUGGABLE GENOME, TRANSCRIPTION FACTOR | ISOPROPYL 4-AMINOBENZOATE | CHEMBL1467165 | 22041064 |
| Page: 1 |

Copyright 2023-Present -The University of Texas Health Science Center at Houston |