
|
|||||
|
 | |
| |
| |
| |
| |
| |
|
Gene: BMI1 |
Gene summary for BMI1 |
| Gene information | Species | Human | Gene symbol | BMI1 | Gene ID | 648 |
| Gene name | BMI1 proto-oncogene, polycomb ring finger | |
| Gene Alias | FLVI2/BMI1 | |
| Cytomap | 10p12.2 | |
| Gene Type | protein-coding | GO ID | GO:0000122 | UniProtAcc | P35226 |
Top |
Malignant transformation analysis |
| Identification of the aberrant gene expression in precancerous and cancerous lesions by comparing the gene expression of stem-like cells in diseased tissues with normal stem cells |
| Entrez ID | Symbol | Replicates | Species | Organ | Tissue | Adj P-value | Log2FC | Malignancy |
| 648 | BMI1 | LZE4T | Human | Esophagus | ESCC | 8.45e-07 | 9.32e-02 | 0.0811 |
| 648 | BMI1 | LZE8T | Human | Esophagus | ESCC | 2.56e-07 | 8.89e-02 | 0.067 |
| 648 | BMI1 | LZE22T | Human | Esophagus | ESCC | 2.37e-05 | 1.91e-01 | 0.068 |
| 648 | BMI1 | LZE24T | Human | Esophagus | ESCC | 2.83e-14 | 4.93e-01 | 0.0596 |
| 648 | BMI1 | P1T-E | Human | Esophagus | ESCC | 2.93e-03 | 2.59e-01 | 0.0875 |
| 648 | BMI1 | P2T-E | Human | Esophagus | ESCC | 1.17e-17 | 3.98e-01 | 0.1177 |
| 648 | BMI1 | P4T-E | Human | Esophagus | ESCC | 3.80e-16 | 2.39e-01 | 0.1323 |
| 648 | BMI1 | P5T-E | Human | Esophagus | ESCC | 3.96e-10 | 1.42e-01 | 0.1327 |
| 648 | BMI1 | P8T-E | Human | Esophagus | ESCC | 4.12e-22 | 3.41e-01 | 0.0889 |
| 648 | BMI1 | P9T-E | Human | Esophagus | ESCC | 4.34e-07 | 7.97e-02 | 0.1131 |
| 648 | BMI1 | P10T-E | Human | Esophagus | ESCC | 9.97e-13 | 1.59e-01 | 0.116 |
| 648 | BMI1 | P11T-E | Human | Esophagus | ESCC | 3.35e-06 | 2.46e-01 | 0.1426 |
| 648 | BMI1 | P12T-E | Human | Esophagus | ESCC | 3.40e-20 | 2.80e-01 | 0.1122 |
| 648 | BMI1 | P15T-E | Human | Esophagus | ESCC | 3.29e-11 | 1.41e-01 | 0.1149 |
| 648 | BMI1 | P16T-E | Human | Esophagus | ESCC | 6.55e-09 | 1.35e-01 | 0.1153 |
| 648 | BMI1 | P17T-E | Human | Esophagus | ESCC | 1.67e-04 | 1.17e-01 | 0.1278 |
| 648 | BMI1 | P20T-E | Human | Esophagus | ESCC | 4.07e-13 | 2.07e-01 | 0.1124 |
| 648 | BMI1 | P21T-E | Human | Esophagus | ESCC | 1.59e-11 | 3.09e-01 | 0.1617 |
| 648 | BMI1 | P22T-E | Human | Esophagus | ESCC | 1.15e-12 | 1.44e-01 | 0.1236 |
| 648 | BMI1 | P23T-E | Human | Esophagus | ESCC | 1.38e-13 | 3.36e-01 | 0.108 |
| Page: 1 2 3 4 5 |
| Tissue | Expression Dynamics | Abbreviation |
| Esophagus | 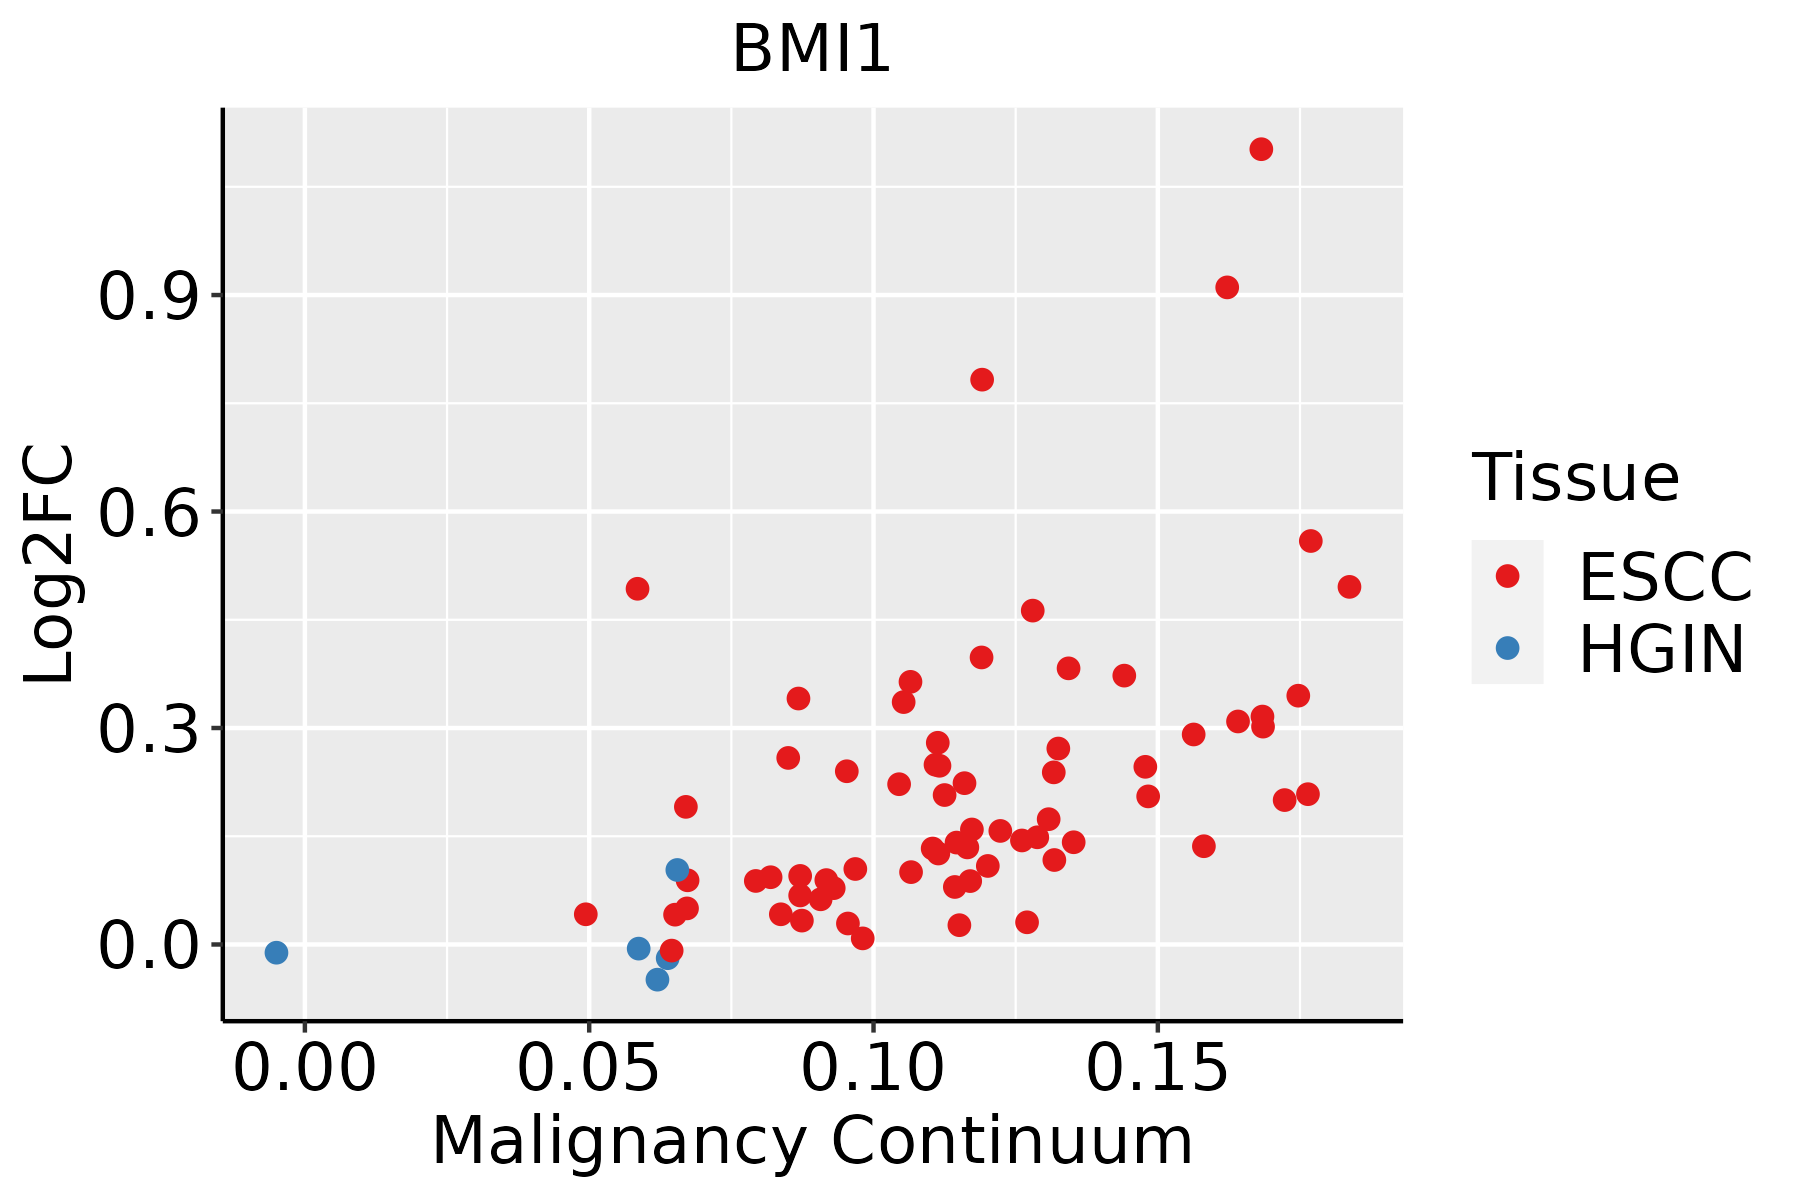 | ESCC: Esophageal squamous cell carcinoma |
| HGIN: High-grade intraepithelial neoplasias | ||
| LGIN: Low-grade intraepithelial neoplasias | ||
| Liver |  | HCC: Hepatocellular carcinoma |
| NAFLD: Non-alcoholic fatty liver disease | ||
| Prostate |  | BPH: Benign Prostatic Hyperplasia |
| Thyroid |  | ATC: Anaplastic thyroid cancer |
| HT: Hashimoto's thyroiditis | ||
| PTC: Papillary thyroid cancer |
| ∗log2FC in expression of this searched gene in stem-like cells from each diseased tissue sample relative to stem-like cells in normal samples in each tissue plotted against the malignancy continuum. Samples are colored based on if they are from different disease stage. |
Top |
Malignant transformation related pathway analysis |
| Find out the enriched GO biological processes and KEGG pathways involved in transition from healthy to precancer to cancer |
| Tissue | Disease Stage | Enriched GO biological Processes |
| Colorectum | AD |  |
| Colorectum | SER |  |
| Colorectum | MSS |  |
| Colorectum | MSI-H |  |
| Colorectum | FAP |  |
| ∗Top 15 enriched GO BP terms are showed in the bar plot of each disease state in each tissue. Each row represents a significant GO biological process which is colored according to the -log10(p.adjust). |
| Page: 1 2 3 4 5 6 7 8 9 |
| GO ID | Tissue | Disease Stage | Description | Gene Ratio | Bg Ratio | pvalue | p.adjust | Count |
| GO:001657015 | Esophagus | ESCC | histone modification | 323/8552 | 463/18723 | 2.61e-26 | 7.88e-24 | 323 |
| GO:2001233111 | Esophagus | ESCC | regulation of apoptotic signaling pathway | 256/8552 | 356/18723 | 4.11e-24 | 1.04e-21 | 256 |
| GO:1903320111 | Esophagus | ESCC | regulation of protein modification by small protein conjugation or removal | 181/8552 | 242/18723 | 1.80e-20 | 2.60e-18 | 181 |
| GO:001820514 | Esophagus | ESCC | peptidyl-lysine modification | 259/8552 | 376/18723 | 3.90e-20 | 5.26e-18 | 259 |
| GO:0031396111 | Esophagus | ESCC | regulation of protein ubiquitination | 154/8552 | 210/18723 | 2.70e-16 | 2.04e-14 | 154 |
| GO:000170119 | Esophagus | ESCC | in utero embryonic development | 243/8552 | 367/18723 | 1.00e-15 | 6.86e-14 | 243 |
| GO:2001234111 | Esophagus | ESCC | negative regulation of apoptotic signaling pathway | 161/8552 | 224/18723 | 1.24e-15 | 8.09e-14 | 161 |
| GO:001839413 | Esophagus | ESCC | peptidyl-lysine acetylation | 123/8552 | 169/18723 | 6.58e-13 | 2.94e-11 | 123 |
| GO:004354313 | Esophagus | ESCC | protein acylation | 165/8552 | 243/18723 | 1.69e-12 | 7.14e-11 | 165 |
| GO:000647313 | Esophagus | ESCC | protein acetylation | 140/8552 | 201/18723 | 4.37e-12 | 1.69e-10 | 140 |
| GO:001839313 | Esophagus | ESCC | internal peptidyl-lysine acetylation | 114/8552 | 158/18723 | 1.16e-11 | 4.24e-10 | 114 |
| GO:000647513 | Esophagus | ESCC | internal protein amino acid acetylation | 115/8552 | 160/18723 | 1.43e-11 | 5.08e-10 | 115 |
| GO:00165735 | Esophagus | ESCC | histone acetylation | 110/8552 | 152/18723 | 1.95e-11 | 6.81e-10 | 110 |
| GO:00434143 | Esophagus | ESCC | macromolecule methylation | 199/8552 | 316/18723 | 3.44e-10 | 9.57e-09 | 199 |
| GO:190332216 | Esophagus | ESCC | positive regulation of protein modification by small protein conjugation or removal | 99/8552 | 138/18723 | 4.39e-10 | 1.16e-08 | 99 |
| GO:00322592 | Esophagus | ESCC | methylation | 222/8552 | 364/18723 | 2.26e-09 | 5.09e-08 | 222 |
| GO:00065136 | Esophagus | ESCC | protein monoubiquitination | 53/8552 | 67/18723 | 2.11e-08 | 4.03e-07 | 53 |
| GO:001657414 | Esophagus | ESCC | histone ubiquitination | 40/8552 | 47/18723 | 2.40e-08 | 4.55e-07 | 40 |
| GO:0048545111 | Esophagus | ESCC | response to steroid hormone | 204/8552 | 339/18723 | 4.47e-08 | 8.11e-07 | 204 |
| GO:004578527 | Esophagus | ESCC | positive regulation of cell adhesion | 255/8552 | 437/18723 | 5.07e-08 | 9.11e-07 | 255 |
| Page: 1 2 3 4 5 6 7 8 9 10 11 12 13 |
| Pathway ID | Tissue | Disease Stage | Description | Gene Ratio | Bg Ratio | pvalue | p.adjust | qvalue | Count |
| hsa052028 | Esophagus | ESCC | Transcriptional misregulation in cancer | 116/4205 | 193/8465 | 2.08e-03 | 5.95e-03 | 3.05e-03 | 116 |
| hsa0520213 | Esophagus | ESCC | Transcriptional misregulation in cancer | 116/4205 | 193/8465 | 2.08e-03 | 5.95e-03 | 3.05e-03 | 116 |
| hsa0520221 | Prostate | Tumor | Transcriptional misregulation in cancer | 59/1791 | 193/8465 | 1.22e-03 | 5.26e-03 | 3.26e-03 | 59 |
| hsa0520231 | Prostate | Tumor | Transcriptional misregulation in cancer | 59/1791 | 193/8465 | 1.22e-03 | 5.26e-03 | 3.26e-03 | 59 |
| Page: 1 |
Top |
Cell-cell communication analysis |
| Identification of potential cell-cell interactions between two cell types and their ligand-receptor pairs for different disease states |
| Ligand | Receptor | LRpair | Pathway | Tissue | Disease Stage |
| Page: 1 |
Top |
Single-cell gene regulatory network inference analysis |
| Find out the significant the regulons (TFs) and the target genes of each regulon across cell types for different disease states |
| TF | Cell Type | Tissue | Disease Stage | Target Gene | RSS | Regulon Activity |
| ∗The dot plots of a searched regulon are shown for all cell subpopulations in each disease state of each tissue based on the regulon specific score inferred using pySCENIC and by calculating the average expression. |
| Page: 1 |
Top |
Somatic mutation of malignant transformation related genes |
| Annotation of somatic variants for genes involved in malignant transformation |
| Hugo Symbol | Variant Class | Variant Classification | dbSNP RS | HGVSc | HGVSp | HGVSp Short | SWISSPROT | BIOTYPE | SIFT | PolyPhen | Tumor Sample Barcode | Tissue | Histology | Sex | Age | Stage | Therapy Types | Drugs | Outcome |
| BMI1 | SNV | Missense_Mutation | c.229G>C | p.Asp77His | p.D77H | P35226 | protein_coding | deleterious(0) | probably_damaging(0.984) | TCGA-A2-A0YK-01 | Breast | breast invasive carcinoma | Female | <65 | I/II | Chemotherapy | cytoxan | SD | |
| BMI1 | SNV | Missense_Mutation | c.133N>T | p.Arg45Cys | p.R45C | P35226 | protein_coding | deleterious(0.02) | probably_damaging(0.967) | TCGA-AN-A046-01 | Breast | breast invasive carcinoma | Female | >=65 | I/II | Unknown | Unknown | SD | |
| BMI1 | SNV | Missense_Mutation | c.742G>A | p.Glu248Lys | p.E248K | P35226 | protein_coding | tolerated(0.4) | benign(0.021) | TCGA-DR-A0ZM-01 | Cervix | cervical & endocervical cancer | Female | <65 | III/IV | Unspecific | Cisplatin | SD | |
| BMI1 | SNV | Missense_Mutation | c.337N>C | p.Asp113His | p.D113H | P35226 | protein_coding | deleterious(0) | benign(0.184) | TCGA-FU-A3HY-01 | Cervix | cervical & endocervical cancer | Female | <65 | I/II | Chemotherapy | cisplatin | CR | |
| BMI1 | SNV | Missense_Mutation | c.847N>T | p.His283Tyr | p.H283Y | P35226 | protein_coding | deleterious_low_confidence(0.03) | benign(0.139) | TCGA-IR-A3LI-01 | Cervix | cervical & endocervical cancer | Female | <65 | I/II | Chemotherapy | cisplatin | CR | |
| BMI1 | SNV | Missense_Mutation | novel | c.371N>G | p.Ile124Ser | p.I124S | P35226 | protein_coding | tolerated(0.07) | benign(0.186) | TCGA-VS-A8QF-01 | Cervix | cervical & endocervical cancer | Female | <65 | I/II | Chemotherapy | cisplatin | CR |
| BMI1 | SNV | Missense_Mutation | c.98N>T | p.Glu33Val | p.E33V | P35226 | protein_coding | deleterious(0) | probably_damaging(0.996) | TCGA-AA-3715-01 | Colorectum | colon adenocarcinoma | Male | >=65 | I/II | Unknown | Unknown | PD | |
| BMI1 | SNV | Missense_Mutation | c.14N>T | p.Thr5Met | p.T5M | P35226 | protein_coding | tolerated(0.07) | benign(0.406) | TCGA-AA-3864-01 | Colorectum | colon adenocarcinoma | Male | >=65 | I/II | Unknown | Unknown | SD | |
| BMI1 | SNV | Missense_Mutation | c.221N>G | p.Thr74Ser | p.T74S | P35226 | protein_coding | deleterious(0) | probably_damaging(0.98) | TCGA-AA-3866-01 | Colorectum | colon adenocarcinoma | Female | >=65 | I/II | Unknown | Unknown | SD | |
| BMI1 | SNV | Missense_Mutation | rs530837837 | c.433C>T | p.Arg145Trp | p.R145W | P35226 | protein_coding | deleterious(0.01) | possibly_damaging(0.776) | TCGA-F5-6814-01 | Colorectum | rectum adenocarcinoma | Male | <65 | I/II | Unknown | Unknown | SD |
| Page: 1 2 3 4 |
Top |
Related drugs of malignant transformation related genes |
| Identification of chemicals and drugs interact with genes involved in malignant transfromation |
| (DGIdb 4.0) |
| Entrez ID | Symbol | Category | Interaction Types | Drug Claim Name | Drug Name | PMIDs |
| Page: 1 |

Copyright 2023-Present -The University of Texas Health Science Center at Houston |