
|
|||||
|
 | |
| |
| |
| |
| |
| |
|
Gene: BLZF1 |
Gene summary for BLZF1 |
| Gene information | Species | Human | Gene symbol | BLZF1 | Gene ID | 8548 |
| Gene name | basic leucine zipper nuclear factor 1 | |
| Gene Alias | GOLGIN-45 | |
| Cytomap | 1q24.2 | |
| Gene Type | protein-coding | GO ID | GO:0006810 | UniProtAcc | Q9H2G9 |
Top |
Malignant transformation analysis |
| Identification of the aberrant gene expression in precancerous and cancerous lesions by comparing the gene expression of stem-like cells in diseased tissues with normal stem cells |
| Entrez ID | Symbol | Replicates | Species | Organ | Tissue | Adj P-value | Log2FC | Malignancy |
| 8548 | BLZF1 | LZE4T | Human | Esophagus | ESCC | 5.29e-04 | 2.30e-01 | 0.0811 |
| 8548 | BLZF1 | LZE7T | Human | Esophagus | ESCC | 6.49e-08 | 3.18e-01 | 0.0667 |
| 8548 | BLZF1 | LZE8T | Human | Esophagus | ESCC | 4.17e-04 | 1.58e-01 | 0.067 |
| 8548 | BLZF1 | LZE20T | Human | Esophagus | ESCC | 2.20e-03 | 5.64e-02 | 0.0662 |
| 8548 | BLZF1 | LZE24T | Human | Esophagus | ESCC | 2.40e-09 | 3.30e-01 | 0.0596 |
| 8548 | BLZF1 | LZE21T | Human | Esophagus | ESCC | 1.87e-06 | 1.80e-01 | 0.0655 |
| 8548 | BLZF1 | LZE6T | Human | Esophagus | ESCC | 1.36e-06 | 1.23e-01 | 0.0845 |
| 8548 | BLZF1 | P2T-E | Human | Esophagus | ESCC | 7.57e-23 | 2.75e-01 | 0.1177 |
| 8548 | BLZF1 | P4T-E | Human | Esophagus | ESCC | 1.70e-24 | 4.98e-01 | 0.1323 |
| 8548 | BLZF1 | P5T-E | Human | Esophagus | ESCC | 3.97e-18 | 3.93e-01 | 0.1327 |
| 8548 | BLZF1 | P8T-E | Human | Esophagus | ESCC | 3.08e-11 | 2.22e-01 | 0.0889 |
| 8548 | BLZF1 | P9T-E | Human | Esophagus | ESCC | 9.68e-10 | 2.47e-01 | 0.1131 |
| 8548 | BLZF1 | P10T-E | Human | Esophagus | ESCC | 1.02e-15 | 3.09e-01 | 0.116 |
| 8548 | BLZF1 | P11T-E | Human | Esophagus | ESCC | 3.62e-13 | 5.11e-01 | 0.1426 |
| 8548 | BLZF1 | P12T-E | Human | Esophagus | ESCC | 2.35e-15 | 2.00e-01 | 0.1122 |
| 8548 | BLZF1 | P15T-E | Human | Esophagus | ESCC | 3.57e-11 | 2.24e-01 | 0.1149 |
| 8548 | BLZF1 | P16T-E | Human | Esophagus | ESCC | 1.20e-15 | 2.04e-01 | 0.1153 |
| 8548 | BLZF1 | P17T-E | Human | Esophagus | ESCC | 1.01e-11 | 3.04e-01 | 0.1278 |
| 8548 | BLZF1 | P20T-E | Human | Esophagus | ESCC | 2.60e-21 | 3.61e-01 | 0.1124 |
| 8548 | BLZF1 | P21T-E | Human | Esophagus | ESCC | 3.40e-27 | 5.04e-01 | 0.1617 |
| Page: 1 2 3 4 5 6 |
| Tissue | Expression Dynamics | Abbreviation |
| Esophagus | 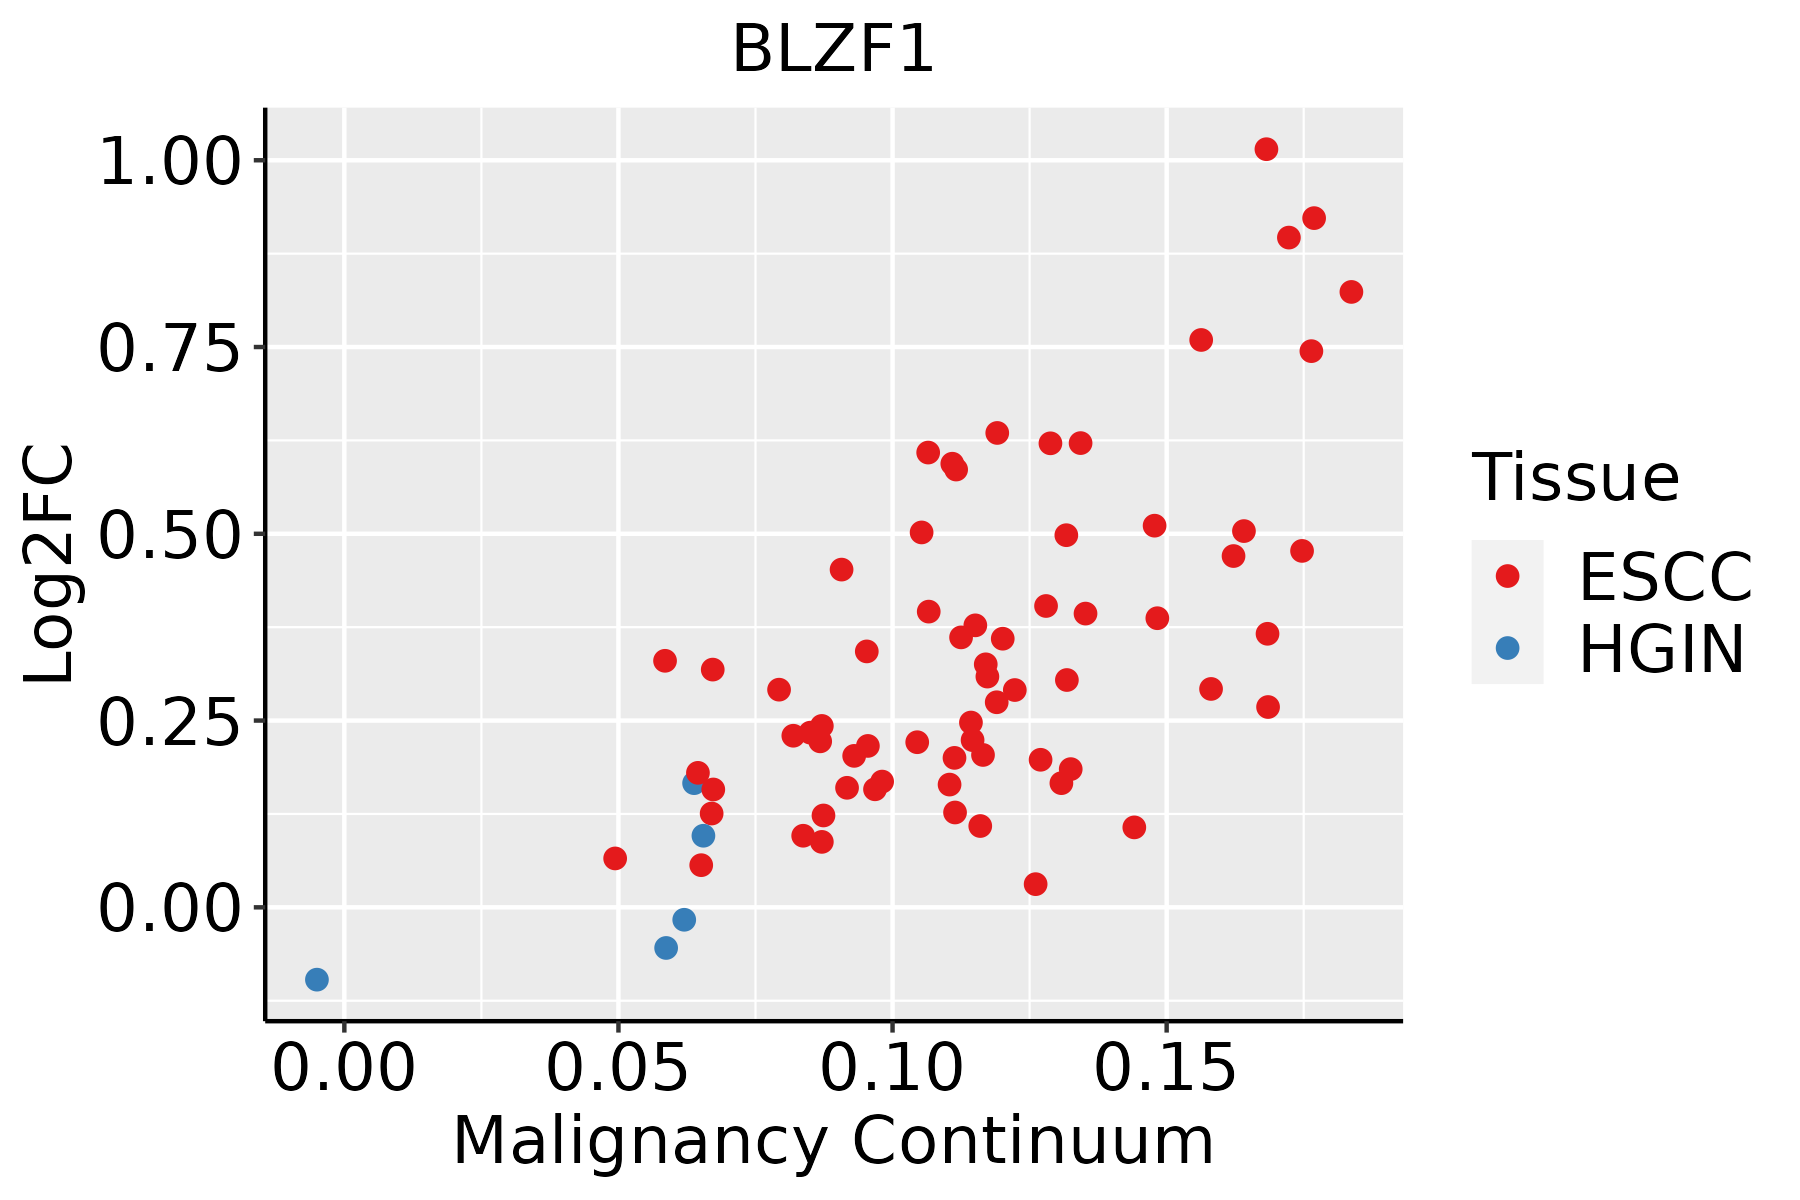 | ESCC: Esophageal squamous cell carcinoma |
| HGIN: High-grade intraepithelial neoplasias | ||
| LGIN: Low-grade intraepithelial neoplasias | ||
| Liver | 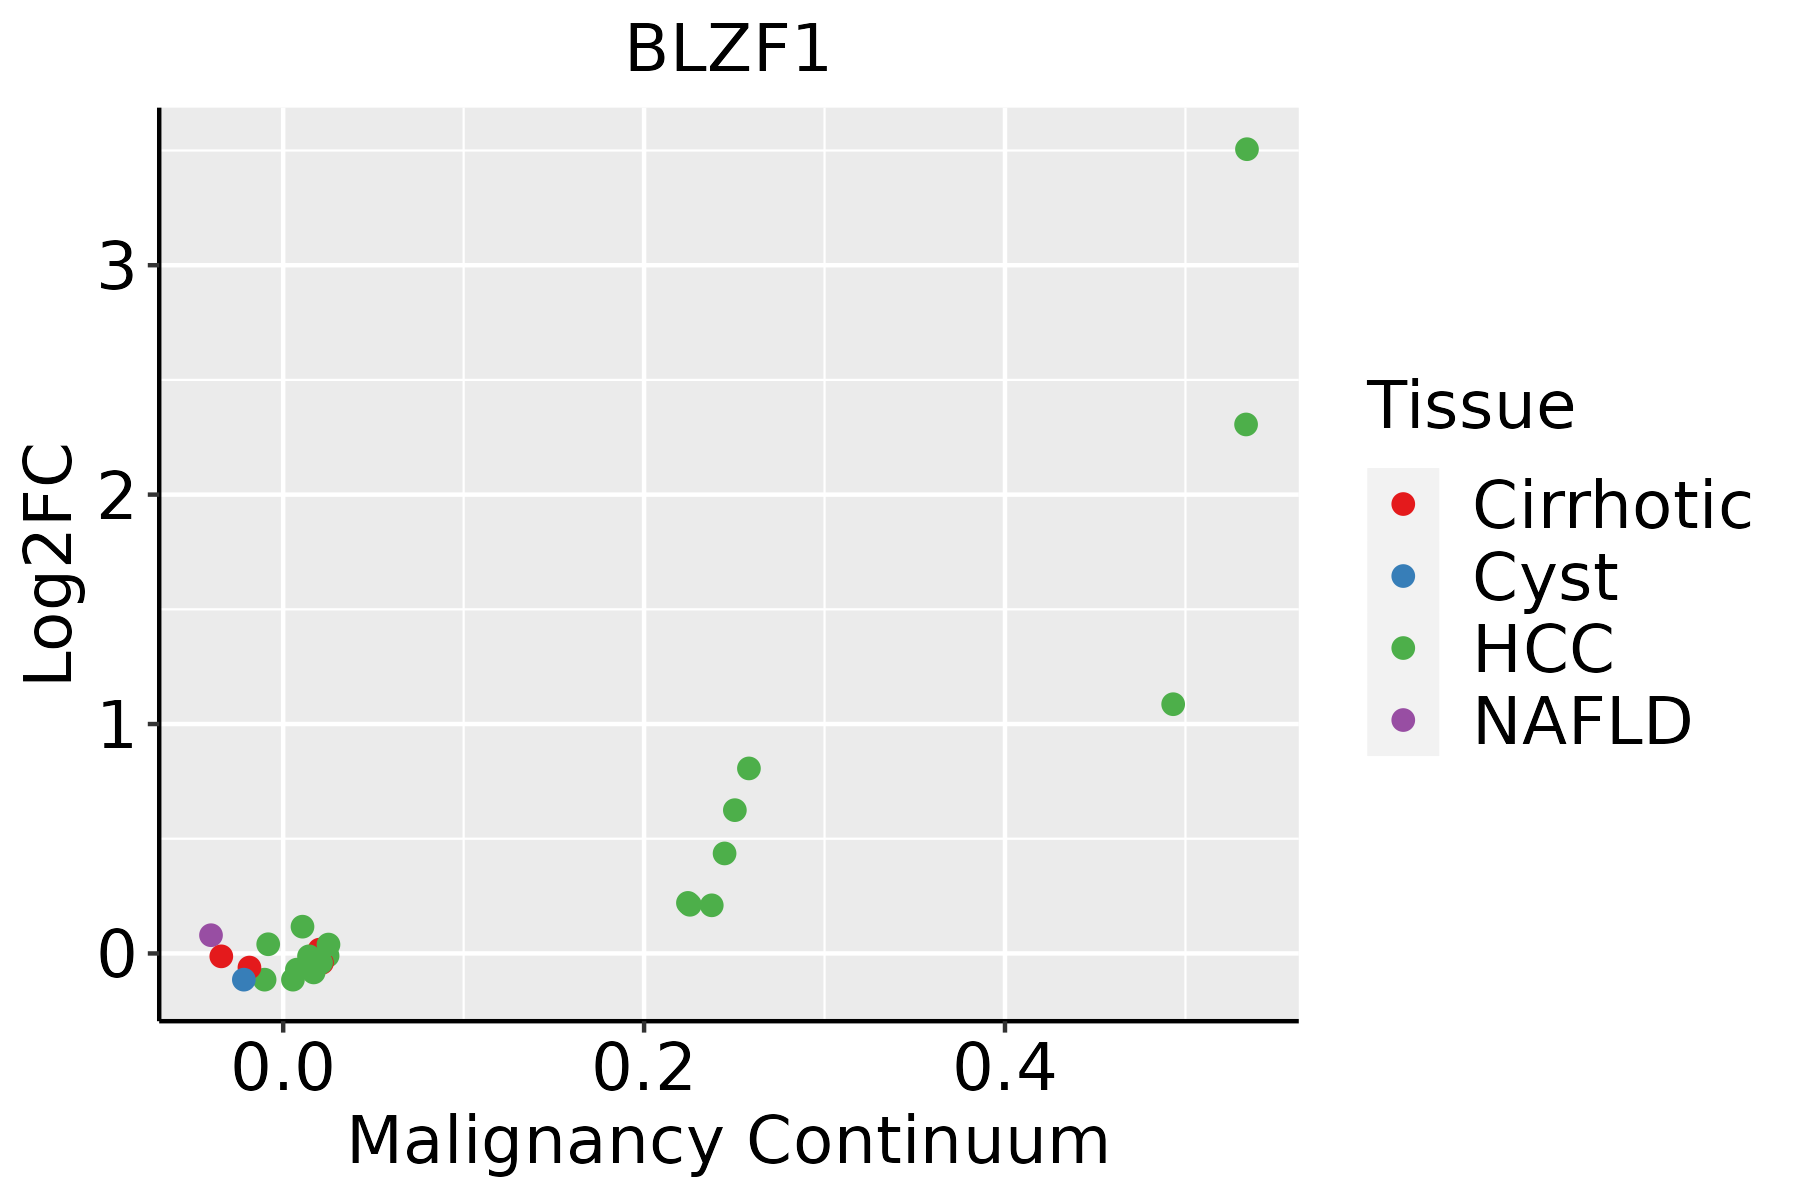 | HCC: Hepatocellular carcinoma |
| NAFLD: Non-alcoholic fatty liver disease | ||
| Lung | 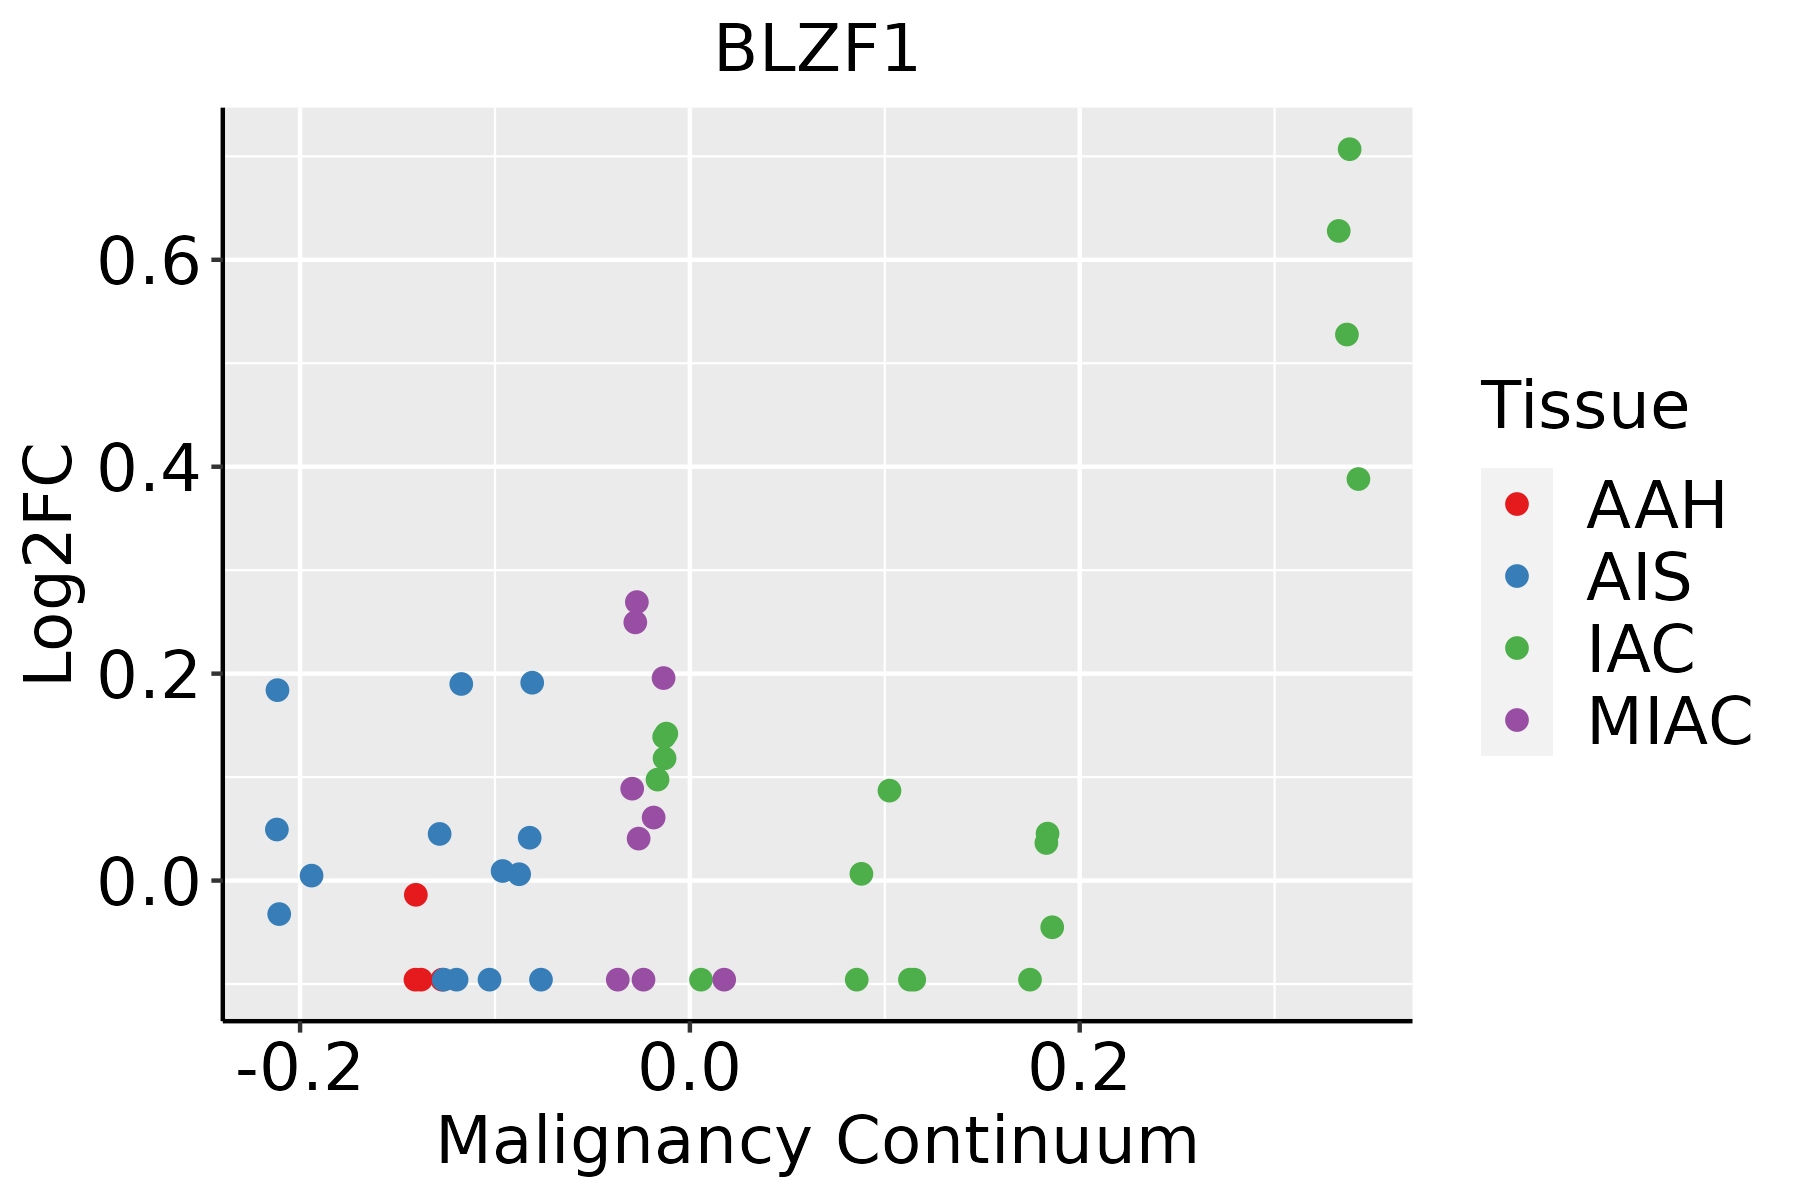 | AAH: Atypical adenomatous hyperplasia |
| AIS: Adenocarcinoma in situ | ||
| IAC: Invasive lung adenocarcinoma | ||
| MIA: Minimally invasive adenocarcinoma | ||
| Oral Cavity | 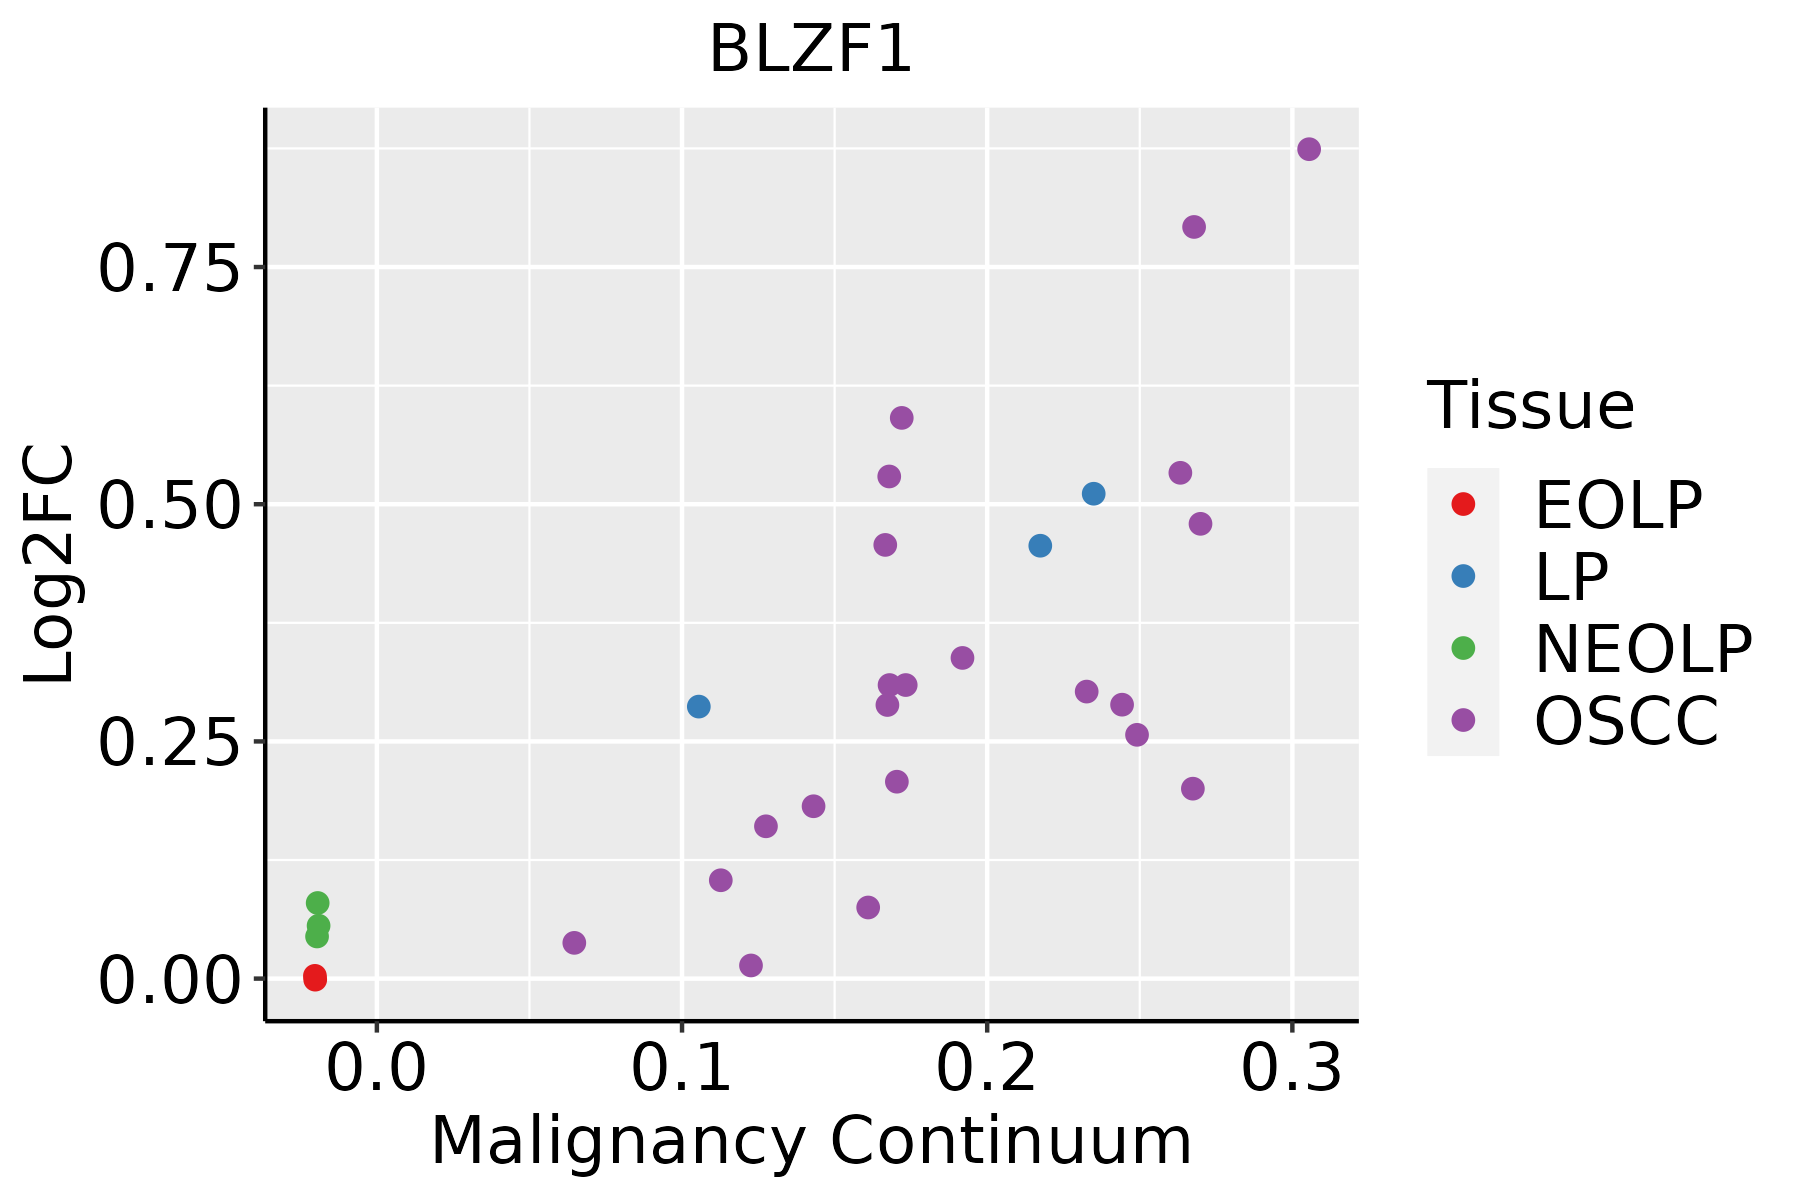 | EOLP: Erosive Oral lichen planus |
| LP: leukoplakia | ||
| NEOLP: Non-erosive oral lichen planus | ||
| OSCC: Oral squamous cell carcinoma | ||
| Skin | 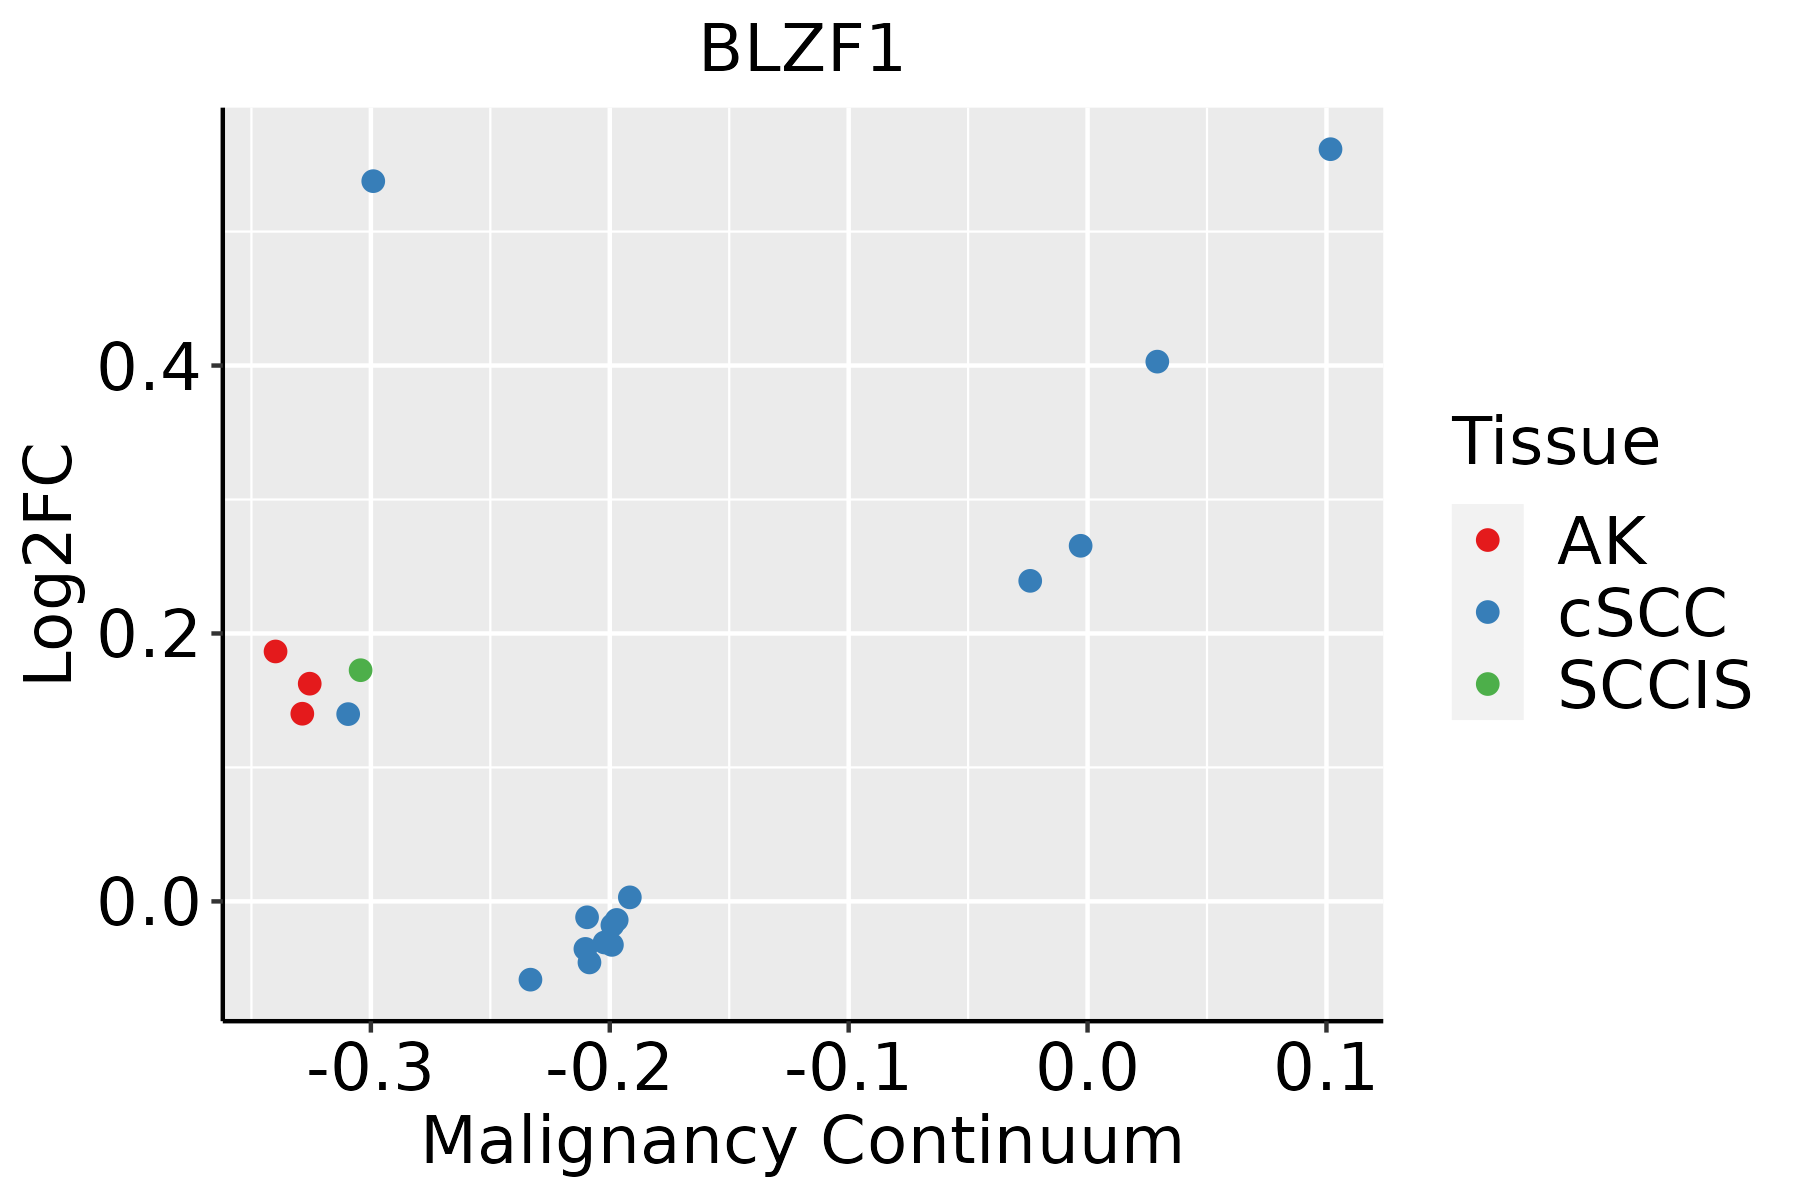 | AK: Actinic keratosis |
| cSCC: Cutaneous squamous cell carcinoma | ||
| SCCIS:squamous cell carcinoma in situ | ||
| Thyroid |  | ATC: Anaplastic thyroid cancer |
| HT: Hashimoto's thyroiditis | ||
| PTC: Papillary thyroid cancer |
| ∗log2FC in expression of this searched gene in stem-like cells from each diseased tissue sample relative to stem-like cells in normal samples in each tissue plotted against the malignancy continuum. Samples are colored based on if they are from different disease stage. |
Top |
Malignant transformation related pathway analysis |
| Find out the enriched GO biological processes and KEGG pathways involved in transition from healthy to precancer to cancer |
| Tissue | Disease Stage | Enriched GO biological Processes |
| Colorectum | AD |  |
| Colorectum | SER |  |
| Colorectum | MSS |  |
| Colorectum | MSI-H |  |
| Colorectum | FAP |  |
| ∗Top 15 enriched GO BP terms are showed in the bar plot of each disease state in each tissue. Each row represents a significant GO biological process which is colored according to the -log10(p.adjust). |
| Page: 1 2 3 4 5 6 7 8 9 |
| GO ID | Tissue | Disease Stage | Description | Gene Ratio | Bg Ratio | pvalue | p.adjust | Count |
| GO:004819318 | Esophagus | ESCC | Golgi vesicle transport | 231/8552 | 296/18723 | 1.82e-30 | 9.63e-28 | 231 |
| GO:0090150110 | Esophagus | ESCC | establishment of protein localization to membrane | 182/8552 | 260/18723 | 1.27e-15 | 8.19e-14 | 182 |
| GO:0072659110 | Esophagus | ESCC | protein localization to plasma membrane | 193/8552 | 284/18723 | 1.95e-14 | 1.03e-12 | 193 |
| GO:199077819 | Esophagus | ESCC | protein localization to cell periphery | 217/8552 | 333/18723 | 4.08e-13 | 1.88e-11 | 217 |
| GO:000689215 | Esophagus | ESCC | post-Golgi vesicle-mediated transport | 82/8552 | 104/18723 | 4.00e-12 | 1.55e-10 | 82 |
| GO:009887615 | Esophagus | ESCC | vesicle-mediated transport to the plasma membrane | 99/8552 | 136/18723 | 1.13e-10 | 3.39e-09 | 99 |
| GO:000689315 | Esophagus | ESCC | Golgi to plasma membrane transport | 48/8552 | 60/18723 | 5.11e-08 | 9.16e-07 | 48 |
| GO:004300114 | Esophagus | ESCC | Golgi to plasma membrane protein transport | 34/8552 | 40/18723 | 3.00e-07 | 4.27e-06 | 34 |
| GO:00070308 | Esophagus | ESCC | Golgi organization | 101/8552 | 157/18723 | 1.78e-06 | 2.10e-05 | 101 |
| GO:006195114 | Esophagus | ESCC | establishment of protein localization to plasma membrane | 44/8552 | 60/18723 | 1.25e-05 | 1.15e-04 | 44 |
| GO:004819321 | Liver | HCC | Golgi vesicle transport | 217/7958 | 296/18723 | 2.58e-27 | 1.02e-24 | 217 |
| GO:009015012 | Liver | HCC | establishment of protein localization to membrane | 168/7958 | 260/18723 | 4.07e-13 | 2.13e-11 | 168 |
| GO:007265921 | Liver | HCC | protein localization to plasma membrane | 177/7958 | 284/18723 | 1.02e-11 | 4.18e-10 | 177 |
| GO:199077821 | Liver | HCC | protein localization to cell periphery | 200/7958 | 333/18723 | 6.07e-11 | 2.23e-09 | 200 |
| GO:000689221 | Liver | HCC | post-Golgi vesicle-mediated transport | 77/7958 | 104/18723 | 6.14e-11 | 2.24e-09 | 77 |
| GO:009887621 | Liver | HCC | vesicle-mediated transport to the plasma membrane | 92/7958 | 136/18723 | 2.57e-09 | 7.07e-08 | 92 |
| GO:00070302 | Liver | HCC | Golgi organization | 99/7958 | 157/18723 | 1.54e-07 | 2.85e-06 | 99 |
| GO:000689321 | Liver | HCC | Golgi to plasma membrane transport | 44/7958 | 60/18723 | 1.24e-06 | 1.81e-05 | 44 |
| GO:004300121 | Liver | HCC | Golgi to plasma membrane protein transport | 32/7958 | 40/18723 | 1.40e-06 | 2.01e-05 | 32 |
| GO:006195111 | Liver | HCC | establishment of protein localization to plasma membrane | 41/7958 | 60/18723 | 4.65e-05 | 4.49e-04 | 41 |
| Page: 1 2 3 4 5 |
| Pathway ID | Tissue | Disease Stage | Description | Gene Ratio | Bg Ratio | pvalue | p.adjust | qvalue | Count |
| Page: 1 |
Top |
Cell-cell communication analysis |
| Identification of potential cell-cell interactions between two cell types and their ligand-receptor pairs for different disease states |
| Ligand | Receptor | LRpair | Pathway | Tissue | Disease Stage |
| Page: 1 |
Top |
Single-cell gene regulatory network inference analysis |
| Find out the significant the regulons (TFs) and the target genes of each regulon across cell types for different disease states |
| TF | Cell Type | Tissue | Disease Stage | Target Gene | RSS | Regulon Activity |
| ∗The dot plots of a searched regulon are shown for all cell subpopulations in each disease state of each tissue based on the regulon specific score inferred using pySCENIC and by calculating the average expression. |
| Page: 1 |
Top |
Somatic mutation of malignant transformation related genes |
| Annotation of somatic variants for genes involved in malignant transformation |
| Hugo Symbol | Variant Class | Variant Classification | dbSNP RS | HGVSc | HGVSp | HGVSp Short | SWISSPROT | BIOTYPE | SIFT | PolyPhen | Tumor Sample Barcode | Tissue | Histology | Sex | Age | Stage | Therapy Types | Drugs | Outcome |
| BLZF1 | SNV | Missense_Mutation | c.845C>G | p.Thr282Ser | p.T282S | Q9H2G9 | protein_coding | tolerated(0.22) | possibly_damaging(0.582) | TCGA-BH-A0BZ-01 | Breast | breast invasive carcinoma | Female | <65 | III/IV | Chemotherapy | doxorubicin | CR | |
| BLZF1 | insertion | In_Frame_Ins | novel | c.290_291insTGGCACTAA | p.Thr97_Lys98insGlyThrLys | p.T97_K98insGTK | Q9H2G9 | protein_coding | TCGA-A1-A0SM-01 | Breast | breast invasive carcinoma | Male | >=65 | I/II | Unknown | Unknown | SD | ||
| BLZF1 | SNV | Missense_Mutation | rs369684533 | c.455G>A | p.Arg152His | p.R152H | Q9H2G9 | protein_coding | tolerated(0.12) | benign(0.01) | TCGA-A6-6781-01 | Colorectum | colon adenocarcinoma | Male | <65 | III/IV | Chemotherapy | oxaliplatin | SD |
| BLZF1 | SNV | Missense_Mutation | c.875C>T | p.Thr292Ile | p.T292I | Q9H2G9 | protein_coding | tolerated(0.2) | probably_damaging(0.976) | TCGA-AA-3710-01 | Colorectum | colon adenocarcinoma | Female | >=65 | I/II | Unknown | Unknown | SD | |
| BLZF1 | SNV | Missense_Mutation | novel | c.381N>T | p.Lys127Asn | p.K127N | Q9H2G9 | protein_coding | deleterious(0.01) | possibly_damaging(0.848) | TCGA-AA-3984-01 | Colorectum | colon adenocarcinoma | Female | <65 | I/II | Unknown | Unknown | SD |
| BLZF1 | SNV | Missense_Mutation | rs138245508 | c.772N>T | p.Arg258Cys | p.R258C | Q9H2G9 | protein_coding | deleterious(0) | possibly_damaging(0.855) | TCGA-AA-A010-01 | Colorectum | colon adenocarcinoma | Female | <65 | I/II | Chemotherapy | folinic | CR |
| BLZF1 | SNV | Missense_Mutation | rs768658214 | c.1180C>T | p.Arg394Trp | p.R394W | Q9H2G9 | protein_coding | deleterious(0.01) | benign(0.394) | TCGA-AA-A01C-01 | Colorectum | colon adenocarcinoma | Male | >=65 | III/IV | Unknown | Unknown | SD |
| BLZF1 | SNV | Missense_Mutation | novel | c.217G>T | p.Ala73Ser | p.A73S | Q9H2G9 | protein_coding | tolerated_low_confidence(0.34) | benign(0.024) | TCGA-AZ-4315-01 | Colorectum | colon adenocarcinoma | Male | <65 | I/II | Unknown | Unknown | SD |
| BLZF1 | SNV | Missense_Mutation | c.187N>A | p.Leu63Ile | p.L63I | Q9H2G9 | protein_coding | deleterious_low_confidence(0.01) | probably_damaging(0.997) | TCGA-CA-6717-01 | Colorectum | colon adenocarcinoma | Male | <65 | I/II | Chemotherapy | oxaliplatin | CR | |
| BLZF1 | SNV | Missense_Mutation | c.923N>A | p.Ser308Tyr | p.S308Y | Q9H2G9 | protein_coding | tolerated(0.15) | possibly_damaging(0.534) | TCGA-CA-6717-01 | Colorectum | colon adenocarcinoma | Male | <65 | I/II | Chemotherapy | oxaliplatin | CR |
| Page: 1 2 3 4 5 |
Top |
Related drugs of malignant transformation related genes |
| Identification of chemicals and drugs interact with genes involved in malignant transfromation |
| (DGIdb 4.0) |
| Entrez ID | Symbol | Category | Interaction Types | Drug Claim Name | Drug Name | PMIDs |
| Page: 1 |

Copyright 2023-Present -The University of Texas Health Science Center at Houston |