
|
|||||
|
 | |
| |
| |
| |
| |
| |
|
Gene: BLVRB |
Gene summary for BLVRB |
| Gene information | Species | Human | Gene symbol | BLVRB | Gene ID | 645 |
| Gene name | biliverdin reductase B | |
| Gene Alias | BVRB | |
| Cytomap | 19q13.2 | |
| Gene Type | protein-coding | GO ID | GO:0006725 | UniProtAcc | P30043 |
Top |
Malignant transformation analysis |
| Identification of the aberrant gene expression in precancerous and cancerous lesions by comparing the gene expression of stem-like cells in diseased tissues with normal stem cells |
| Entrez ID | Symbol | Replicates | Species | Organ | Tissue | Adj P-value | Log2FC | Malignancy |
| 645 | BLVRB | GSM4909286 | Human | Breast | IDC | 5.83e-07 | -3.03e-01 | 0.1081 |
| 645 | BLVRB | GSM4909288 | Human | Breast | IDC | 7.90e-06 | -1.35e-01 | 0.0988 |
| 645 | BLVRB | GSM4909291 | Human | Breast | IDC | 7.95e-14 | 6.15e-01 | 0.1753 |
| 645 | BLVRB | GSM4909294 | Human | Breast | IDC | 2.65e-02 | -2.59e-02 | 0.2022 |
| 645 | BLVRB | GSM4909296 | Human | Breast | IDC | 9.98e-07 | 8.57e-02 | 0.1524 |
| 645 | BLVRB | GSM4909297 | Human | Breast | IDC | 8.36e-12 | -1.25e-01 | 0.1517 |
| 645 | BLVRB | GSM4909304 | Human | Breast | IDC | 1.62e-02 | 3.31e-01 | 0.1636 |
| 645 | BLVRB | GSM4909306 | Human | Breast | IDC | 6.92e-04 | 3.65e-01 | 0.1564 |
| 645 | BLVRB | GSM4909311 | Human | Breast | IDC | 8.92e-30 | -1.73e-01 | 0.1534 |
| 645 | BLVRB | GSM4909312 | Human | Breast | IDC | 1.42e-08 | -2.40e-01 | 0.1552 |
| 645 | BLVRB | GSM4909313 | Human | Breast | IDC | 3.59e-03 | 2.66e-02 | 0.0391 |
| 645 | BLVRB | GSM4909315 | Human | Breast | IDC | 1.96e-55 | 9.23e-01 | 0.21 |
| 645 | BLVRB | GSM4909316 | Human | Breast | IDC | 6.85e-27 | 8.18e-01 | 0.21 |
| 645 | BLVRB | GSM4909319 | Human | Breast | IDC | 6.90e-43 | 2.94e-02 | 0.1563 |
| 645 | BLVRB | GSM4909320 | Human | Breast | IDC | 3.97e-05 | 7.41e-02 | 0.1575 |
| 645 | BLVRB | GSM4909321 | Human | Breast | IDC | 1.00e-17 | 2.51e-01 | 0.1559 |
| 645 | BLVRB | brca2 | Human | Breast | Precancer | 5.82e-06 | 4.02e-01 | -0.024 |
| 645 | BLVRB | brca3 | Human | Breast | Precancer | 1.13e-20 | 5.09e-01 | -0.0263 |
| 645 | BLVRB | brca10 | Human | Breast | Precancer | 6.41e-03 | 3.41e-01 | -0.0029 |
| 645 | BLVRB | M2 | Human | Breast | IDC | 3.82e-03 | -6.50e-02 | 0.21 |
| Page: 1 2 3 4 5 6 7 8 9 10 11 12 |
| Tissue | Expression Dynamics | Abbreviation |
| Breast |  | IDC: Invasive ductal carcinoma |
| DCIS: Ductal carcinoma in situ | ||
| Precancer(BRCA1-mut): Precancerous lesion from BRCA1 mutation carriers | ||
| Cervix |  | CC: Cervix cancer |
| HSIL_HPV: HPV-infected high-grade squamous intraepithelial lesions | ||
| N_HPV: HPV-infected normal cervix | ||
| Colorectum (GSE201348) | 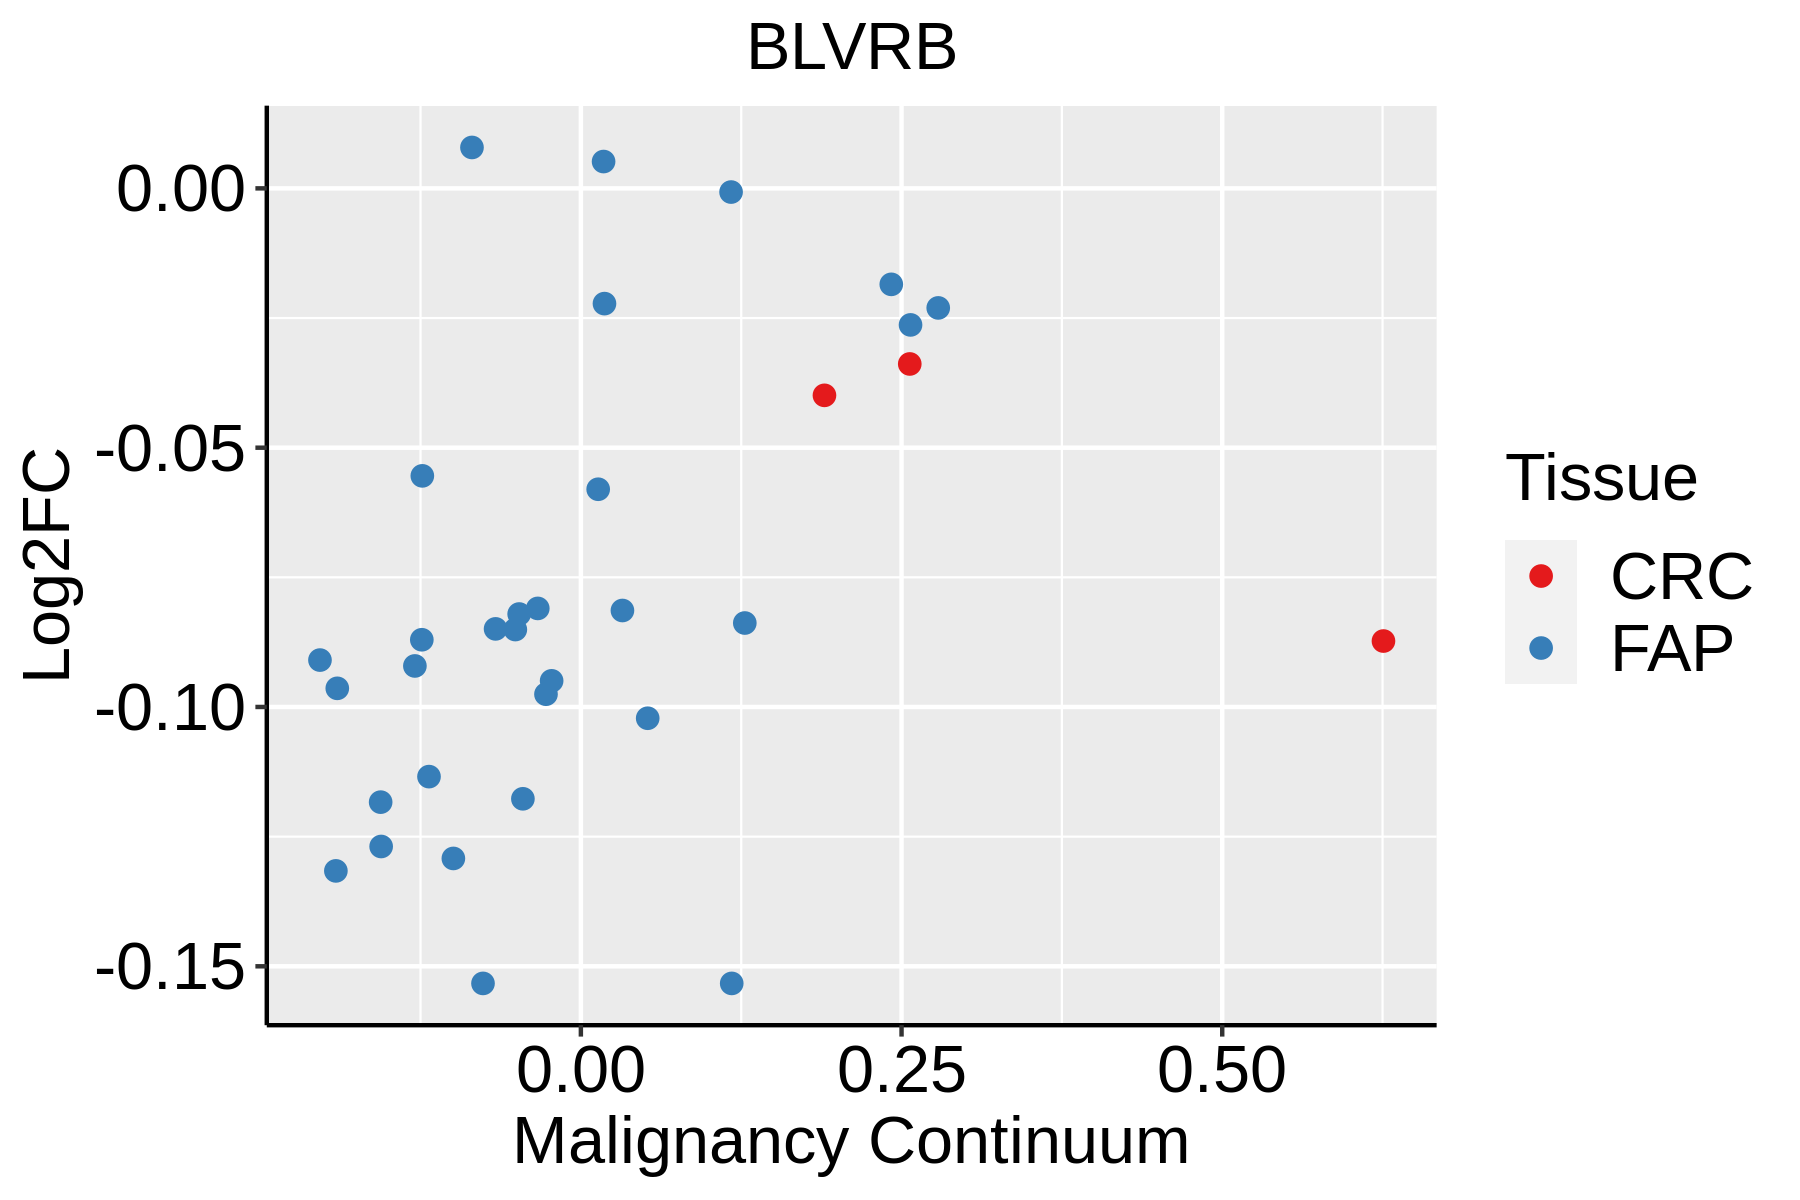 | FAP: Familial adenomatous polyposis |
| CRC: Colorectal cancer | ||
| Colorectum (HTA11) |  | AD: Adenomas |
| SER: Sessile serrated lesions | ||
| MSI-H: Microsatellite-high colorectal cancer | ||
| MSS: Microsatellite stable colorectal cancer | ||
| Esophagus |  | ESCC: Esophageal squamous cell carcinoma |
| HGIN: High-grade intraepithelial neoplasias | ||
| LGIN: Low-grade intraepithelial neoplasias | ||
| GC |  | CAG: Chronic atrophic gastritis |
| CAG with IM: Chronic atrophic gastritis with intestinal metaplasia | ||
| CSG: Chronic superficial gastritis | ||
| GC: Gastric cancer | ||
| SIM: Severe intestinal metaplasia | ||
| WIM: Wild intestinal metaplasia | ||
| Liver |  | HCC: Hepatocellular carcinoma |
| NAFLD: Non-alcoholic fatty liver disease | ||
| Oral Cavity | 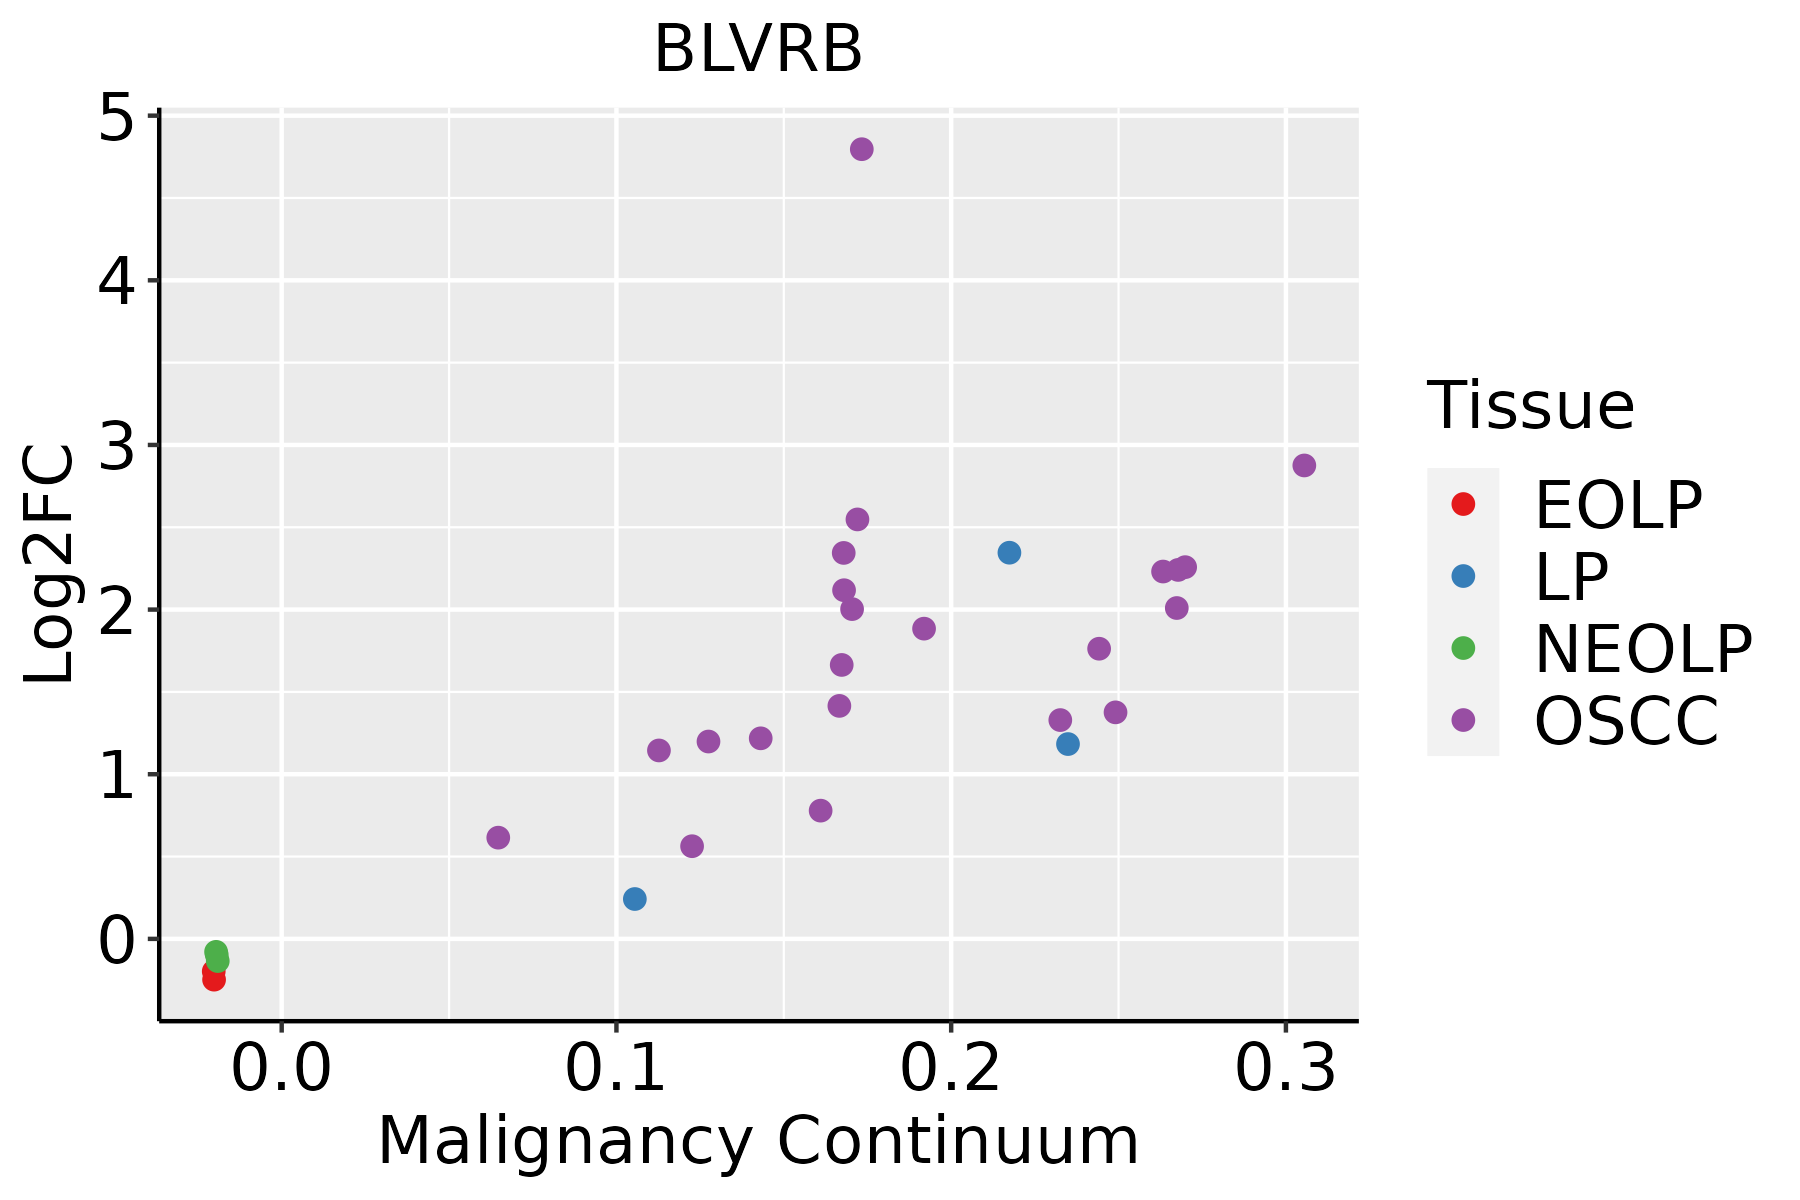 | EOLP: Erosive Oral lichen planus |
| LP: leukoplakia | ||
| NEOLP: Non-erosive oral lichen planus | ||
| OSCC: Oral squamous cell carcinoma | ||
| Prostate | 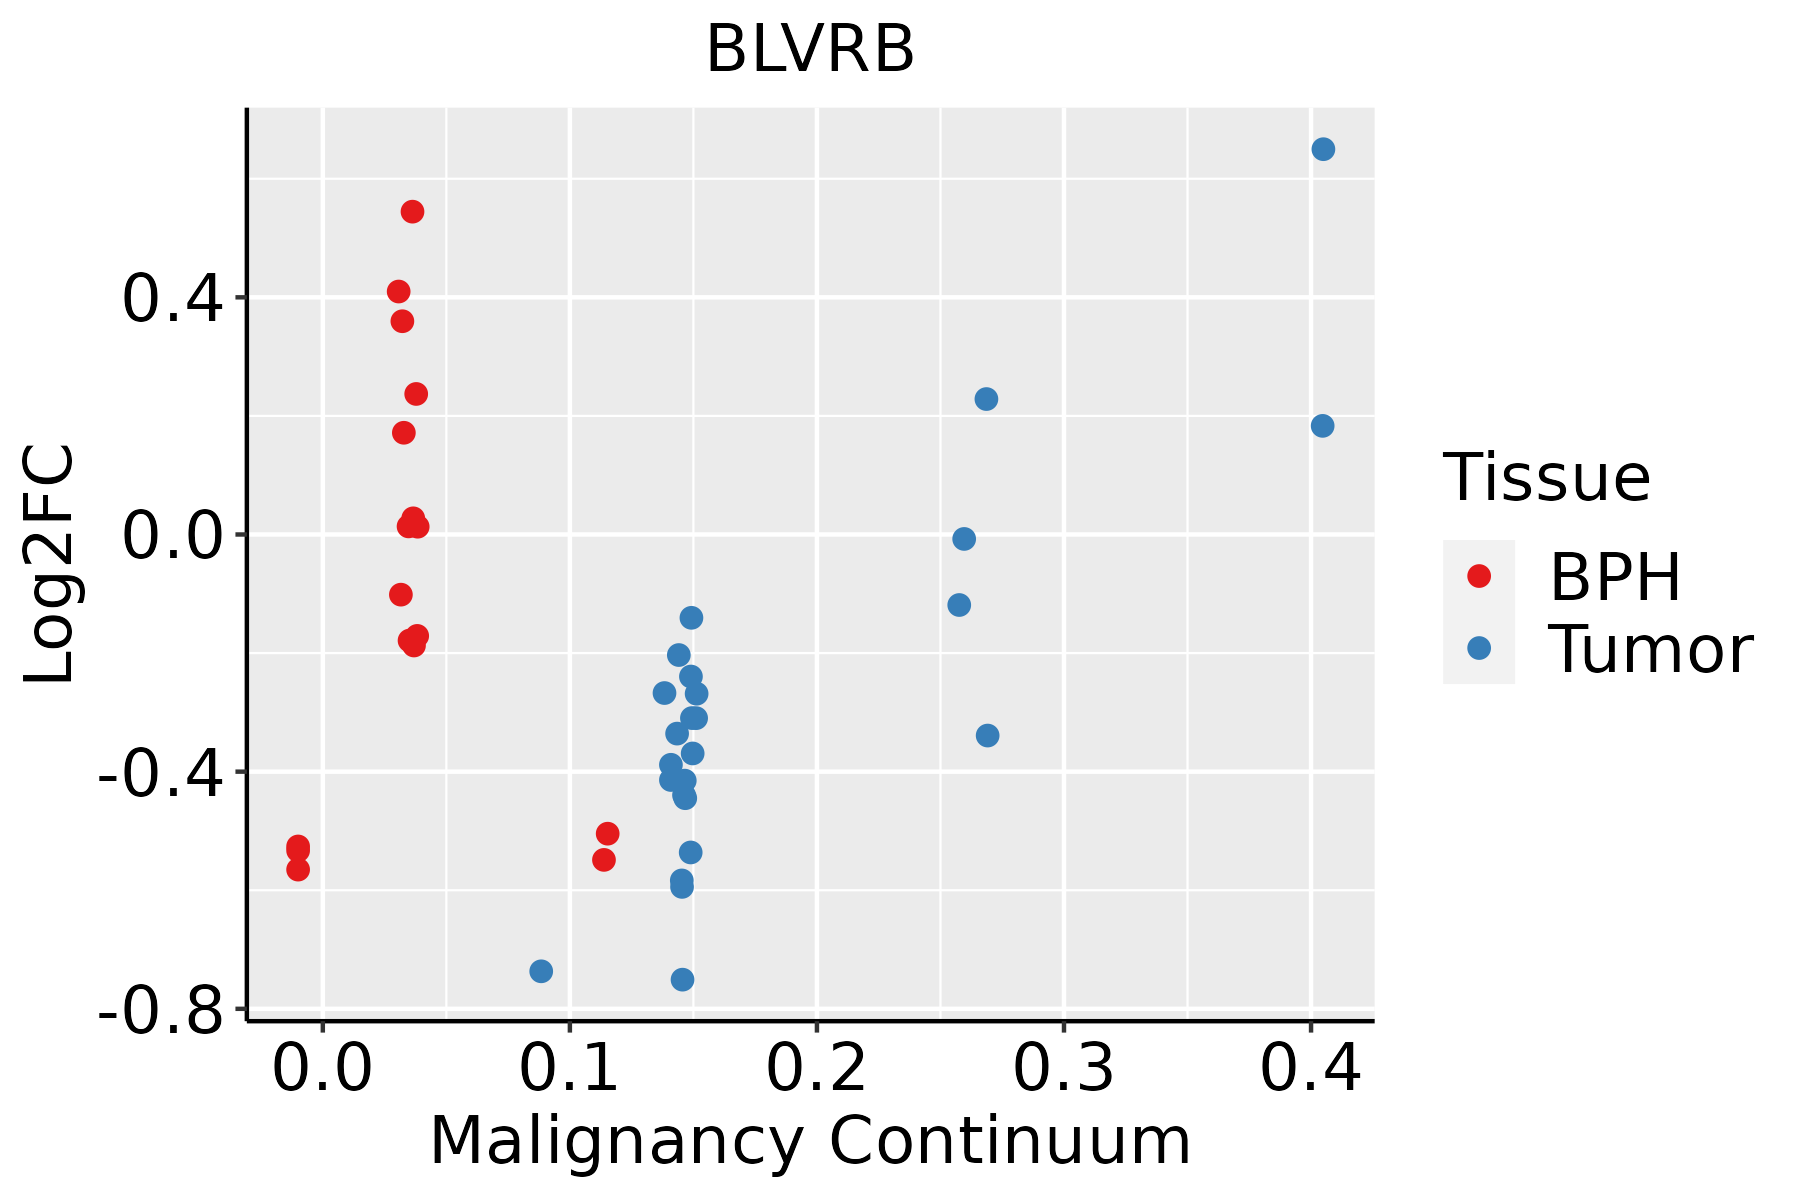 | BPH: Benign Prostatic Hyperplasia |
| Skin |  | AK: Actinic keratosis |
| cSCC: Cutaneous squamous cell carcinoma | ||
| SCCIS:squamous cell carcinoma in situ | ||
| Thyroid | 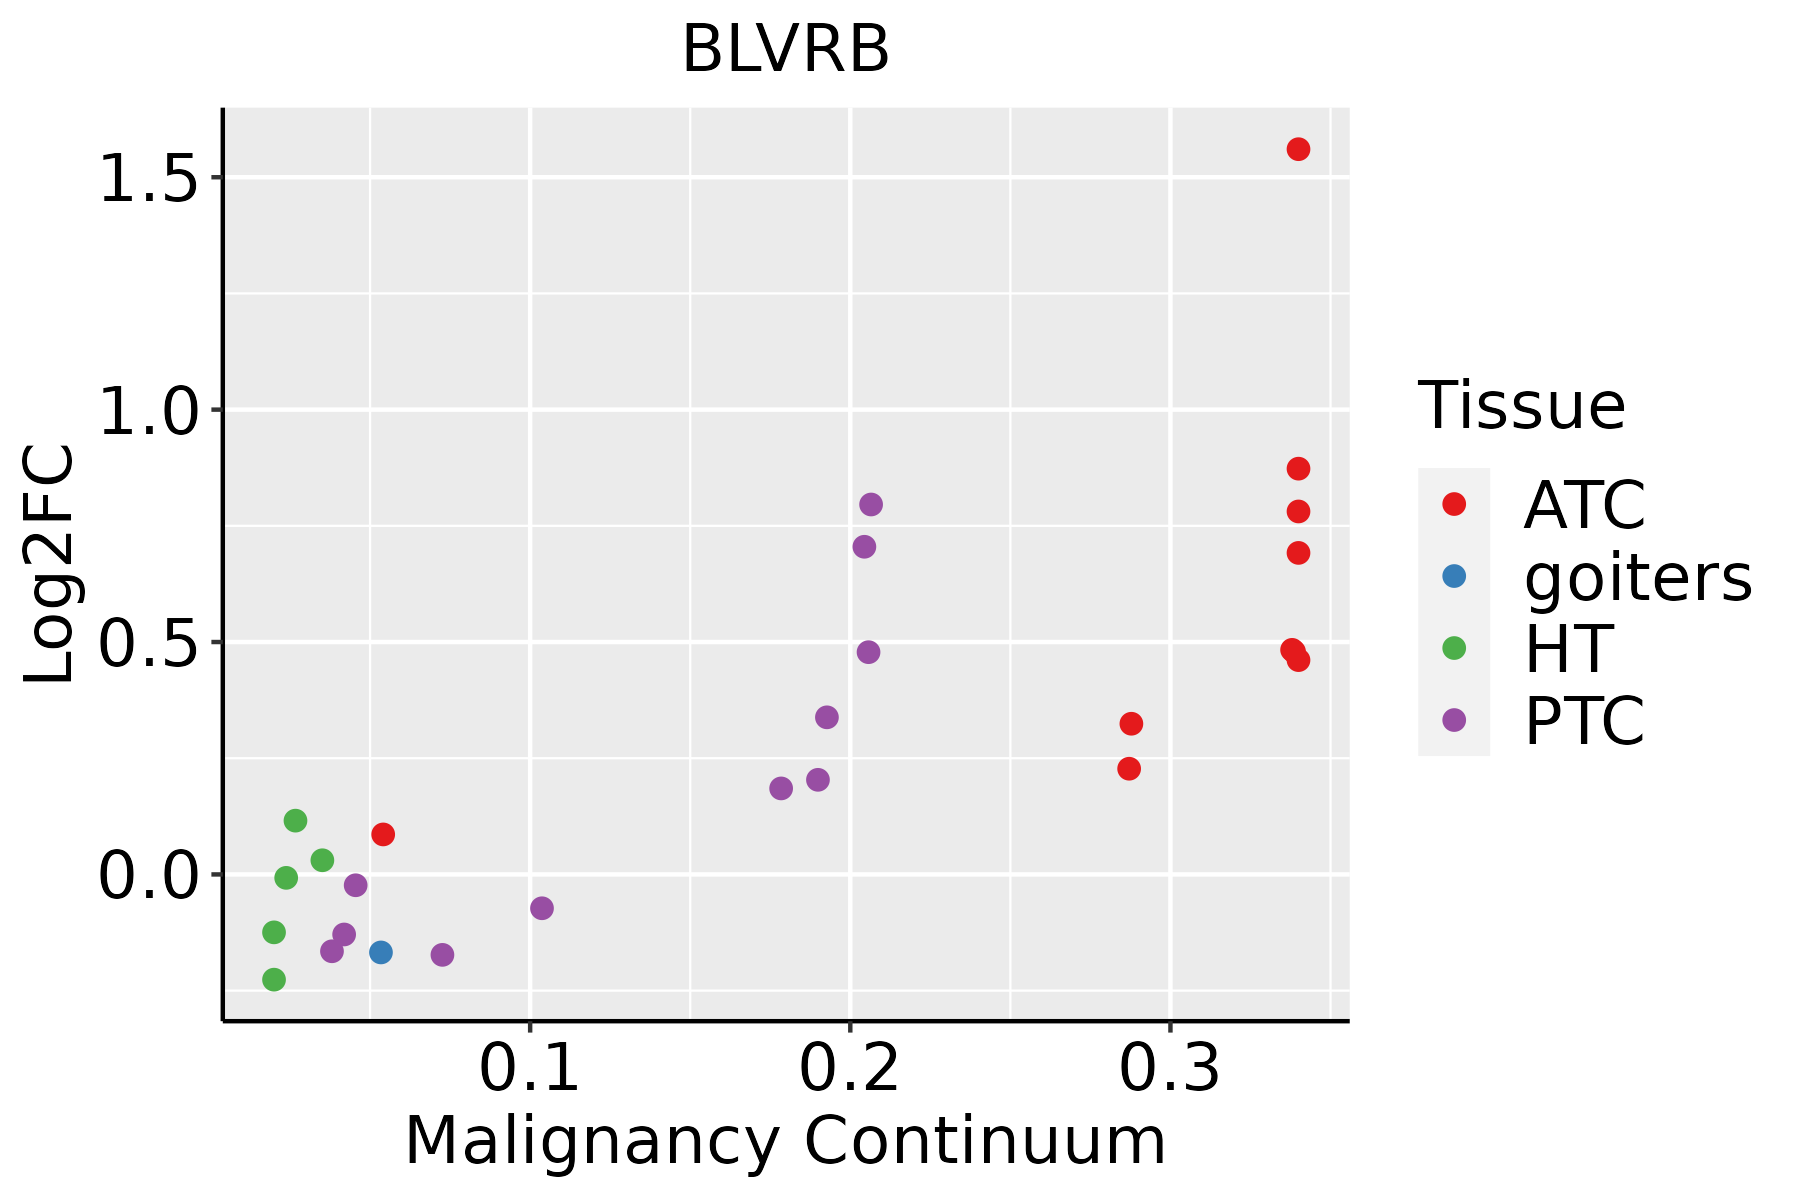 | ATC: Anaplastic thyroid cancer |
| HT: Hashimoto's thyroiditis | ||
| PTC: Papillary thyroid cancer |
| ∗log2FC in expression of this searched gene in stem-like cells from each diseased tissue sample relative to stem-like cells in normal samples in each tissue plotted against the malignancy continuum. Samples are colored based on if they are from different disease stage. |
Top |
Malignant transformation related pathway analysis |
| Find out the enriched GO biological processes and KEGG pathways involved in transition from healthy to precancer to cancer |
| Tissue | Disease Stage | Enriched GO biological Processes |
| Colorectum | AD |  |
| Colorectum | SER |  |
| Colorectum | MSS |  |
| Colorectum | MSI-H |  |
| Colorectum | FAP |  |
| ∗Top 15 enriched GO BP terms are showed in the bar plot of each disease state in each tissue. Each row represents a significant GO biological process which is colored according to the -log10(p.adjust). |
| Page: 1 2 3 4 5 6 7 8 9 |
| GO ID | Tissue | Disease Stage | Description | Gene Ratio | Bg Ratio | pvalue | p.adjust | Count |
| GO:00467007 | Breast | Precancer | heterocycle catabolic process | 44/1080 | 445/18723 | 3.49e-04 | 4.88e-03 | 44 |
| GO:00442708 | Breast | Precancer | cellular nitrogen compound catabolic process | 44/1080 | 451/18723 | 4.64e-04 | 6.12e-03 | 44 |
| GO:00194397 | Breast | Precancer | aromatic compound catabolic process | 44/1080 | 467/18723 | 9.55e-04 | 1.07e-02 | 44 |
| GO:19013617 | Breast | Precancer | organic cyclic compound catabolic process | 45/1080 | 495/18723 | 1.73e-03 | 1.74e-02 | 45 |
| GO:190136112 | Breast | IDC | organic cyclic compound catabolic process | 56/1434 | 495/18723 | 2.12e-03 | 1.99e-02 | 56 |
| GO:004670012 | Breast | IDC | heterocycle catabolic process | 51/1434 | 445/18723 | 2.51e-03 | 2.25e-02 | 51 |
| GO:004427012 | Breast | IDC | cellular nitrogen compound catabolic process | 50/1434 | 451/18723 | 5.29e-03 | 3.93e-02 | 50 |
| GO:001943912 | Breast | IDC | aromatic compound catabolic process | 51/1434 | 467/18723 | 6.54e-03 | 4.59e-02 | 51 |
| GO:190136122 | Breast | DCIS | organic cyclic compound catabolic process | 55/1390 | 495/18723 | 1.75e-03 | 1.71e-02 | 55 |
| GO:004670022 | Breast | DCIS | heterocycle catabolic process | 50/1390 | 445/18723 | 2.19e-03 | 2.03e-02 | 50 |
| GO:001943922 | Breast | DCIS | aromatic compound catabolic process | 51/1390 | 467/18723 | 3.58e-03 | 2.92e-02 | 51 |
| GO:004427022 | Breast | DCIS | cellular nitrogen compound catabolic process | 49/1390 | 451/18723 | 4.68e-03 | 3.56e-02 | 49 |
| GO:00467008 | Cervix | CC | heterocycle catabolic process | 80/2311 | 445/18723 | 3.23e-04 | 3.42e-03 | 80 |
| GO:00442709 | Cervix | CC | cellular nitrogen compound catabolic process | 79/2311 | 451/18723 | 7.80e-04 | 6.91e-03 | 79 |
| GO:00194398 | Cervix | CC | aromatic compound catabolic process | 79/2311 | 467/18723 | 2.14e-03 | 1.54e-02 | 79 |
| GO:19013618 | Cervix | CC | organic cyclic compound catabolic process | 80/2311 | 495/18723 | 6.77e-03 | 3.72e-02 | 80 |
| GO:0044270 | Colorectum | AD | cellular nitrogen compound catabolic process | 147/3918 | 451/18723 | 3.35e-09 | 2.23e-07 | 147 |
| GO:0046700 | Colorectum | AD | heterocycle catabolic process | 145/3918 | 445/18723 | 4.37e-09 | 2.84e-07 | 145 |
| GO:0019439 | Colorectum | AD | aromatic compound catabolic process | 146/3918 | 467/18723 | 7.48e-08 | 3.84e-06 | 146 |
| GO:1901361 | Colorectum | AD | organic cyclic compound catabolic process | 153/3918 | 495/18723 | 8.23e-08 | 4.18e-06 | 153 |
| Page: 1 2 3 4 5 |
| Pathway ID | Tissue | Disease Stage | Description | Gene Ratio | Bg Ratio | pvalue | p.adjust | qvalue | Count |
| Page: 1 |
Top |
Cell-cell communication analysis |
| Identification of potential cell-cell interactions between two cell types and their ligand-receptor pairs for different disease states |
| Ligand | Receptor | LRpair | Pathway | Tissue | Disease Stage |
| Page: 1 |
Top |
Single-cell gene regulatory network inference analysis |
| Find out the significant the regulons (TFs) and the target genes of each regulon across cell types for different disease states |
| TF | Cell Type | Tissue | Disease Stage | Target Gene | RSS | Regulon Activity |
| ∗The dot plots of a searched regulon are shown for all cell subpopulations in each disease state of each tissue based on the regulon specific score inferred using pySCENIC and by calculating the average expression. |
| Page: 1 |
Top |
Somatic mutation of malignant transformation related genes |
| Annotation of somatic variants for genes involved in malignant transformation |
| Hugo Symbol | Variant Class | Variant Classification | dbSNP RS | HGVSc | HGVSp | HGVSp Short | SWISSPROT | BIOTYPE | SIFT | PolyPhen | Tumor Sample Barcode | Tissue | Histology | Sex | Age | Stage | Therapy Types | Drugs | Outcome |
| BLVRB | SNV | Missense_Mutation | c.379N>T | p.Ala127Ser | p.A127S | P30043 | protein_coding | tolerated(0.37) | benign(0.028) | TCGA-AR-A251-01 | Breast | breast invasive carcinoma | Female | <65 | III/IV | Chemotherapy | doxorubicin | SD | |
| BLVRB | SNV | Missense_Mutation | novel | c.263N>A | p.Ser88Tyr | p.S88Y | P30043 | protein_coding | deleterious(0.03) | probably_damaging(0.964) | TCGA-2W-A8YY-01 | Cervix | cervical & endocervical cancer | Female | <65 | I/II | Chemotherapy | cisplatin | CR |
| BLVRB | SNV | Missense_Mutation | novel | c.599N>G | p.Tyr200Cys | p.Y200C | P30043 | protein_coding | tolerated(0.13) | probably_damaging(0.94) | TCGA-AA-3952-01 | Colorectum | colon adenocarcinoma | Male | >=65 | III/IV | Unknown | Unknown | PD |
| BLVRB | SNV | Missense_Mutation | c.563N>C | p.Cys188Ser | p.C188S | P30043 | protein_coding | tolerated(0.19) | probably_damaging(0.999) | TCGA-AG-3726-01 | Colorectum | rectum adenocarcinoma | Female | <65 | I/II | Unknown | Unknown | SD | |
| BLVRB | SNV | Missense_Mutation | novel | c.589N>T | p.His197Tyr | p.H197Y | P30043 | protein_coding | deleterious(0.02) | benign(0.225) | TCGA-AP-A051-01 | Endometrium | uterine corpus endometrioid carcinoma | Female | >=65 | I/II | Unknown | Unknown | SD |
| BLVRB | SNV | Missense_Mutation | novel | c.290N>G | p.Ala97Gly | p.A97G | P30043 | protein_coding | tolerated(0.07) | benign(0.02) | TCGA-D1-A15Z-01 | Endometrium | uterine corpus endometrioid carcinoma | Female | >=65 | I/II | Unknown | Unknown | SD |
| BLVRB | SNV | Missense_Mutation | novel | c.391G>A | p.Asp131Asn | p.D131N | P30043 | protein_coding | deleterious(0) | probably_damaging(1) | TCGA-05-4432-01 | Lung | lung adenocarcinoma | Male | >=65 | I/II | Chemotherapy | cisplatin | CR |
| BLVRB | SNV | Missense_Mutation | novel | c.538N>A | p.Asp180Asn | p.D180N | P30043 | protein_coding | deleterious(0.01) | probably_damaging(1) | TCGA-NC-A5HG-01 | Lung | lung squamous cell carcinoma | Male | <65 | III/IV | Chemotherapy | cisplatin | CR |
| BLVRB | SNV | Missense_Mutation | rs201096602 | c.271N>A | p.Ala91Thr | p.A91T | P30043 | protein_coding | tolerated(1) | benign(0) | TCGA-KK-A59V-01 | Prostate | prostate adenocarcinoma | Male | <65 | 9 | Unknown | Unknown | SD |
| BLVRB | SNV | Missense_Mutation | novel | c.580N>C | p.Tyr194His | p.Y194H | P30043 | protein_coding | tolerated(0.31) | possibly_damaging(0.902) | TCGA-HU-A4G8-01 | Stomach | stomach adenocarcinoma | Female | >=65 | I/II | Chemotherapy | 5-fluorouracil | SD |
| Page: 1 2 |
Top |
Related drugs of malignant transformation related genes |
| Identification of chemicals and drugs interact with genes involved in malignant transfromation |
| (DGIdb 4.0) |
| Entrez ID | Symbol | Category | Interaction Types | Drug Claim Name | Drug Name | PMIDs |
| 645 | BLVRB | ENZYME | methylene blue | 23913015 |
| Page: 1 |

Copyright 2023-Present -The University of Texas Health Science Center at Houston |