Schematic overview of the cellular and molecular mechanisms involved in the cancer progression, including the proposed cellular and molecular mechanisms in cancer cells trajectory. AT1: alveolar type 1 cells; AT2: alveolar type 2 cells; AAH: atypical adenomatous hyperplasia; AIS: adenocarcinoma in situ; MIA: minimally invasive adenocarcinoma; IA: invasive adenocarcinoma; EMT: epithelial-mesenchymal transition

Home

Download

Statistics

Help

Contact

Center for Computational Systems Medicine
leaf

Gene summary

leaf

Malignant transformation analysis

leaf

Malignant transformation related pathway analysis

leaf

Cell-cell communication analysis

leaf

Single-cell gene regulatory network inference analysis

leaf

Somatic mutation of malignant transformation related genes

leaf

Related drugs of malignant transformation related genes

Gene: BLVRA

Gene summary for BLVRA

check button Gene summary.

Gene informationSpeciesHuman
Gene symbol

BLVRA

Gene ID

644

Gene namebiliverdin reductase A
Gene AliasBLVR
Cytomap7p13
Gene Typeprotein-coding
GO ID

GO:0006725

UniProtAcc

A0A140VJF4


Top

Malignant transformation analysis

check button Identification of the aberrant gene expression in precancerous and cancerous lesions by comparing the gene expression of stem-like cells in diseased tissues with normal stem cells
check button Malignant transformation involving gene list.
Entrez IDSymbolReplicatesSpeciesOrganTissueAdj P-valueLog2FCMalignancy
644BLVRALZE2THumanEsophagusESCC8.10e-037.59e-010.082
644BLVRALZE4THumanEsophagusESCC1.13e-166.27e-010.0811
644BLVRALZE5THumanEsophagusESCC3.55e-055.66e-010.0514
644BLVRALZE7THumanEsophagusESCC1.45e-075.54e-010.0667
644BLVRALZE8THumanEsophagusESCC1.81e-214.39e-010.067
644BLVRALZE20THumanEsophagusESCC3.02e-092.19e-010.0662
644BLVRALZE22THumanEsophagusESCC1.10e-047.59e-010.068
644BLVRALZE24THumanEsophagusESCC1.87e-207.19e-010.0596
644BLVRALZE21THumanEsophagusESCC1.54e-041.73e-010.0655
644BLVRALZE6THumanEsophagusESCC9.41e-065.14e-010.0845
644BLVRAP1T-EHumanEsophagusESCC3.42e-096.80e-010.0875
644BLVRAP2T-EHumanEsophagusESCC1.26e-449.17e-010.1177
644BLVRAP4T-EHumanEsophagusESCC5.81e-297.20e-010.1323
644BLVRAP5T-EHumanEsophagusESCC1.98e-123.74e-010.1327
644BLVRAP8T-EHumanEsophagusESCC4.00e-296.37e-010.0889
644BLVRAP9T-EHumanEsophagusESCC2.92e-349.09e-010.1131
644BLVRAP10T-EHumanEsophagusESCC9.06e-183.40e-010.116
644BLVRAP11T-EHumanEsophagusESCC3.83e-128.03e-010.1426
644BLVRAP12T-EHumanEsophagusESCC5.25e-641.29e+000.1122
644BLVRAP15T-EHumanEsophagusESCC1.07e-368.29e-010.1149
Page: 1 2 3 4 5 6 7 

check button Transcriptomic changes along malignancy continuum.
TissueExpression DynamicsAbbreviation
EsophagusThe image shows the transcriptomic changes along malignancy continuum.log2FC in expression of this searched gene in stem-like cells from each diseased tissue sample relative to stem-like cells in normal samples in each tissue plotted against the malignancy continuum. Samples are colored based on if they are from different disease stage.
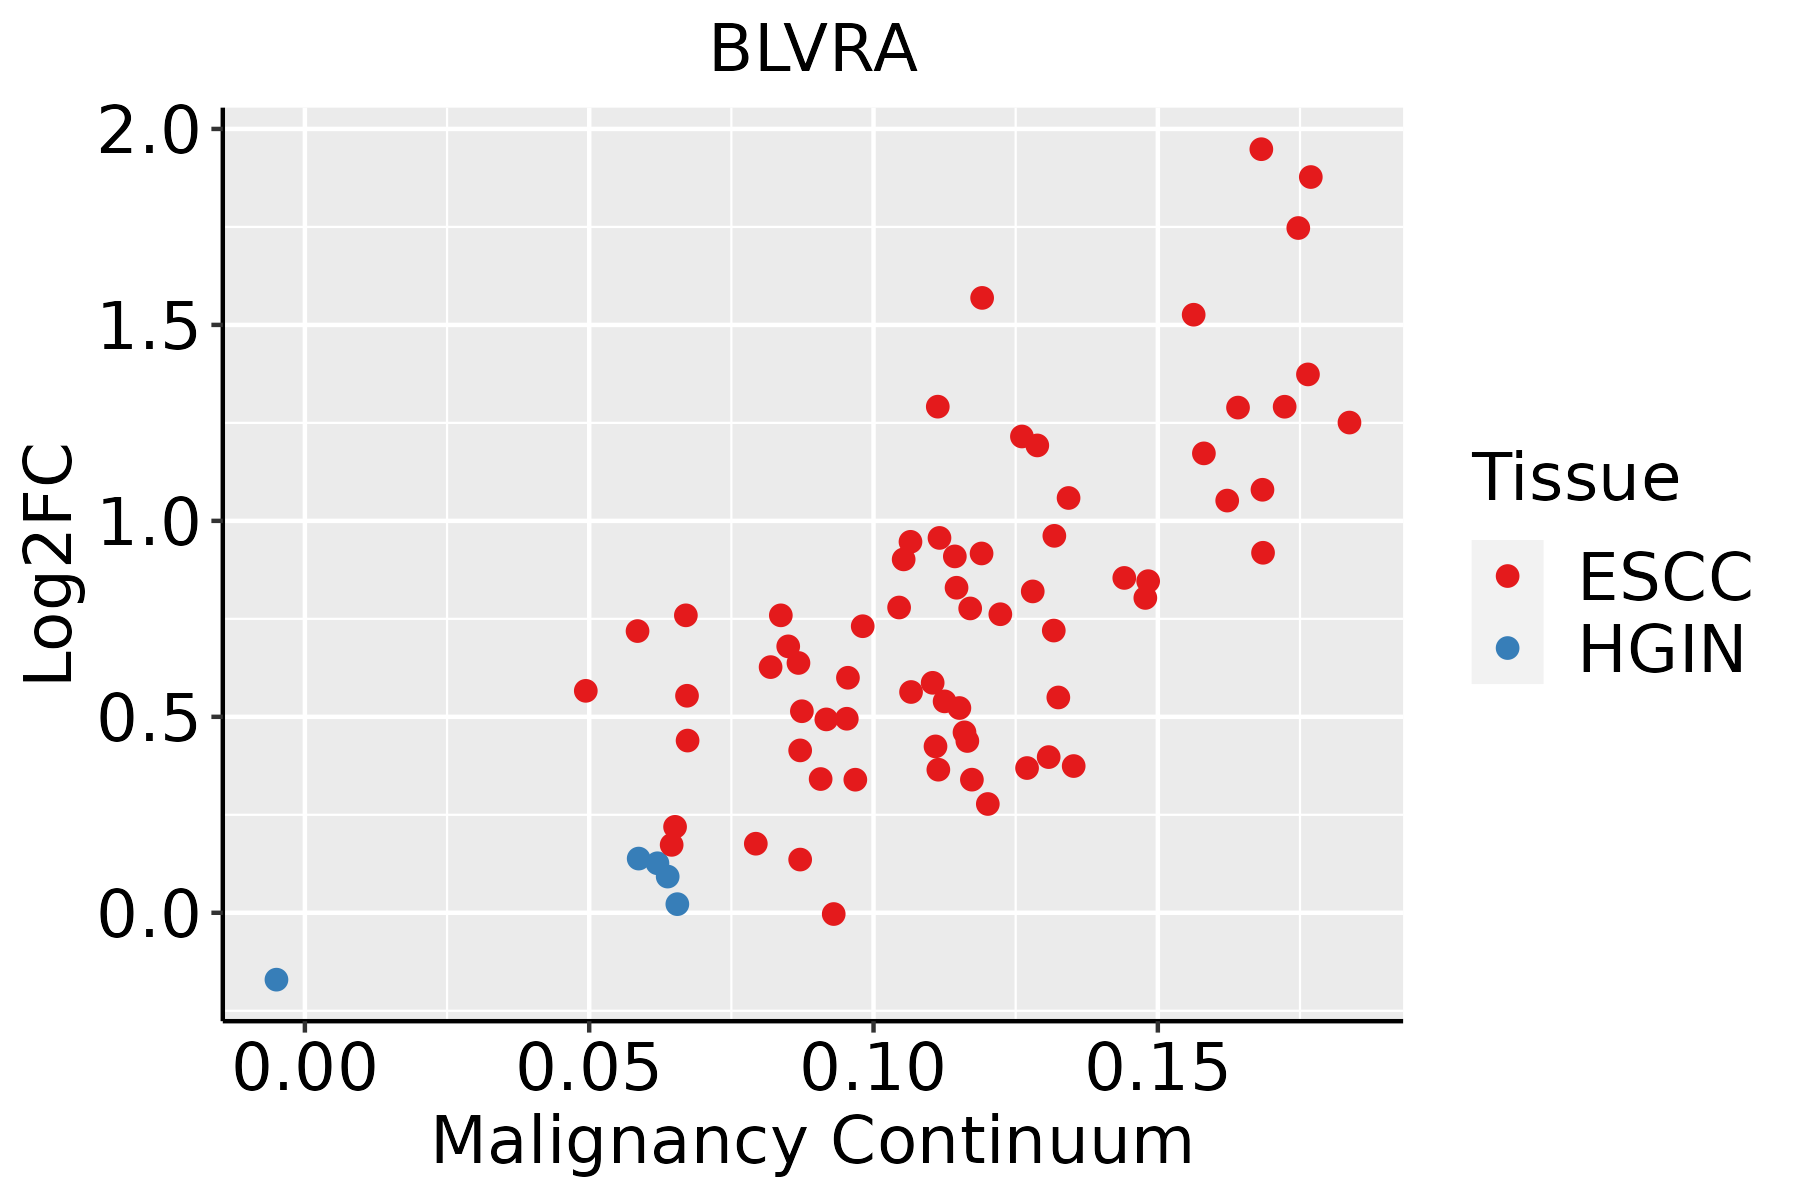
ESCC: Esophageal squamous cell carcinoma
HGIN: High-grade intraepithelial neoplasias
LGIN: Low-grade intraepithelial neoplasias
LiverThe image shows the transcriptomic changes along malignancy continuum.log2FC in expression of this searched gene in stem-like cells from each diseased tissue sample relative to stem-like cells in normal samples in each tissue plotted against the malignancy continuum. Samples are colored based on if they are from different disease stage.HCC: Hepatocellular carcinoma
NAFLD: Non-alcoholic fatty liver disease
Oral CavityThe image shows the transcriptomic changes along malignancy continuum.log2FC in expression of this searched gene in stem-like cells from each diseased tissue sample relative to stem-like cells in normal samples in each tissue plotted against the malignancy continuum. Samples are colored based on if they are from different disease stage.EOLP: Erosive Oral lichen planus
LP: leukoplakia
NEOLP: Non-erosive oral lichen planus
OSCC: Oral squamous cell carcinoma
SkinThe image shows the transcriptomic changes along malignancy continuum.log2FC in expression of this searched gene in stem-like cells from each diseased tissue sample relative to stem-like cells in normal samples in each tissue plotted against the malignancy continuum. Samples are colored based on if they are from different disease stage.
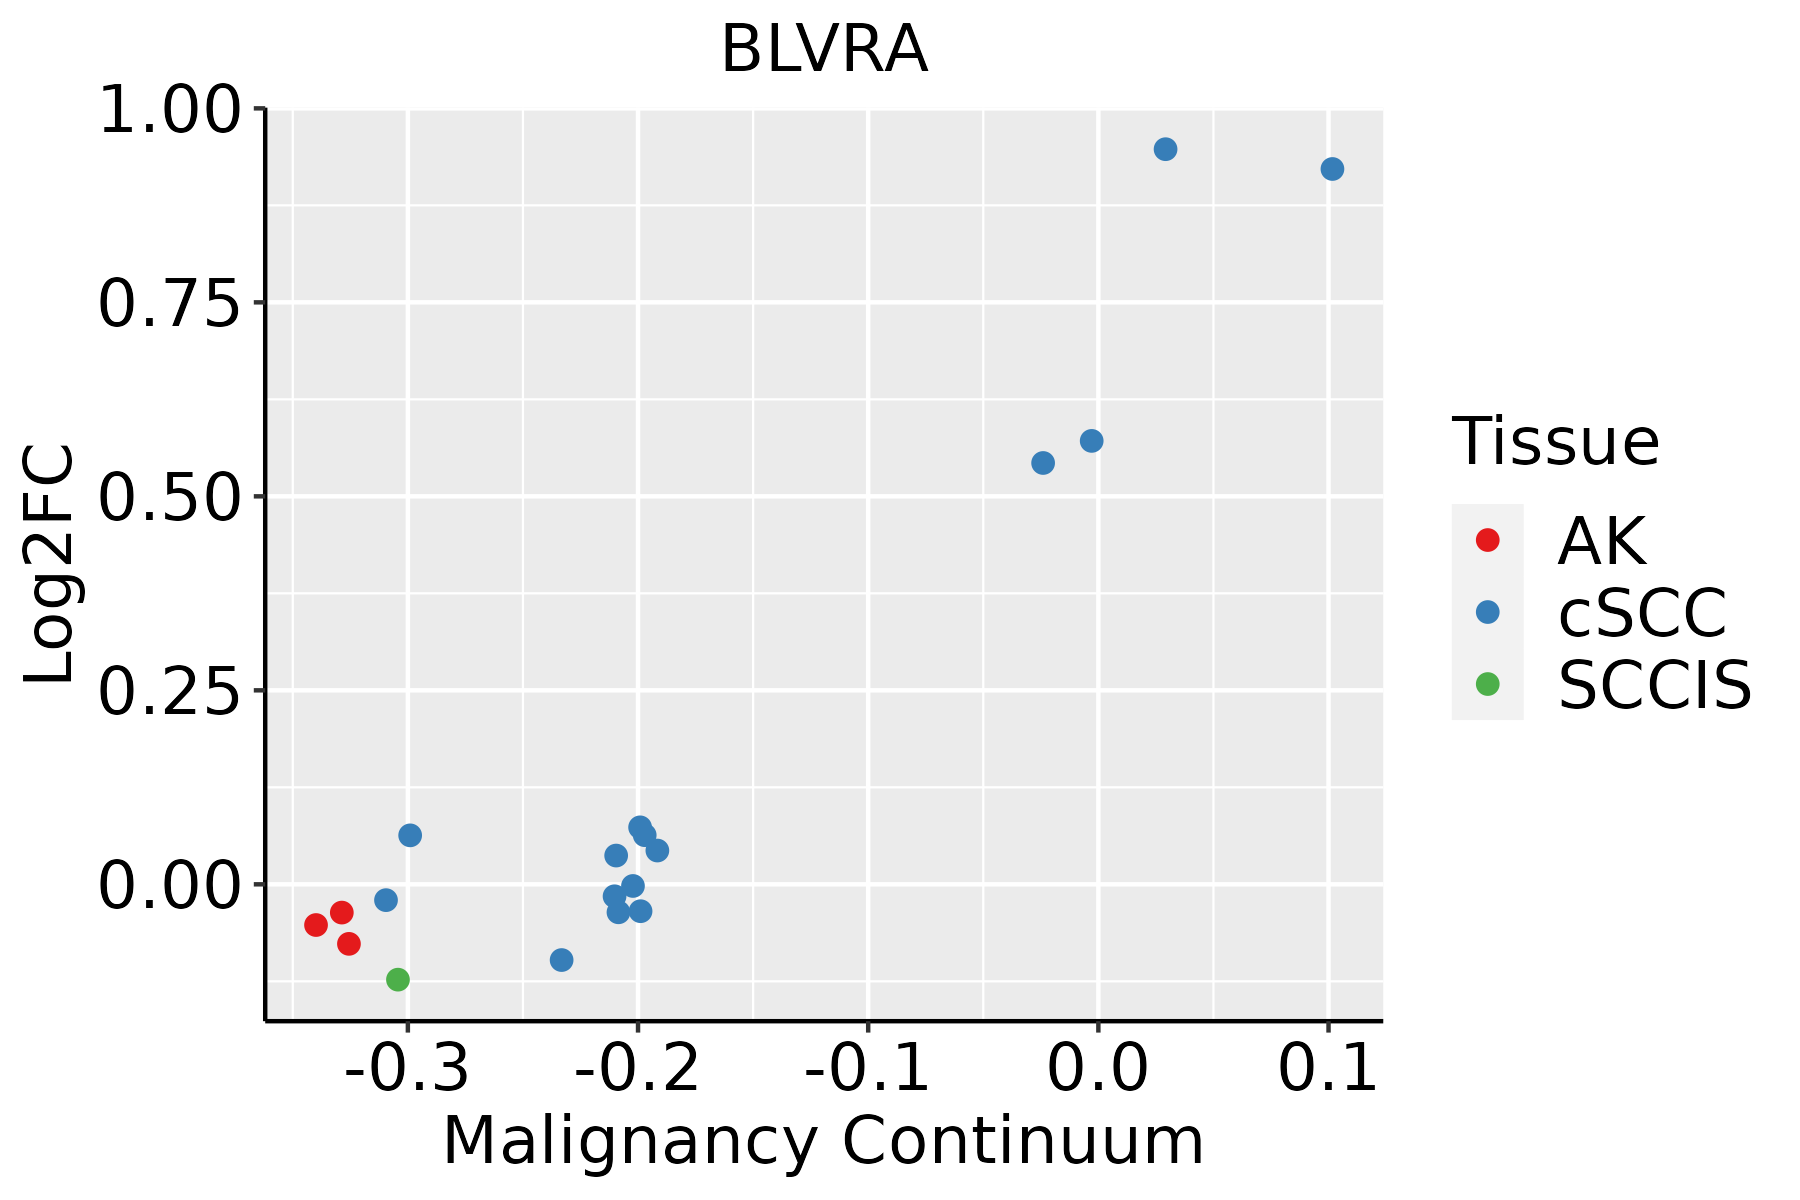
AK: Actinic keratosis
cSCC: Cutaneous squamous cell carcinoma
SCCIS:squamous cell carcinoma in situ
ThyroidThe image shows the transcriptomic changes along malignancy continuum.log2FC in expression of this searched gene in stem-like cells from each diseased tissue sample relative to stem-like cells in normal samples in each tissue plotted against the malignancy continuum. Samples are colored based on if they are from different disease stage.
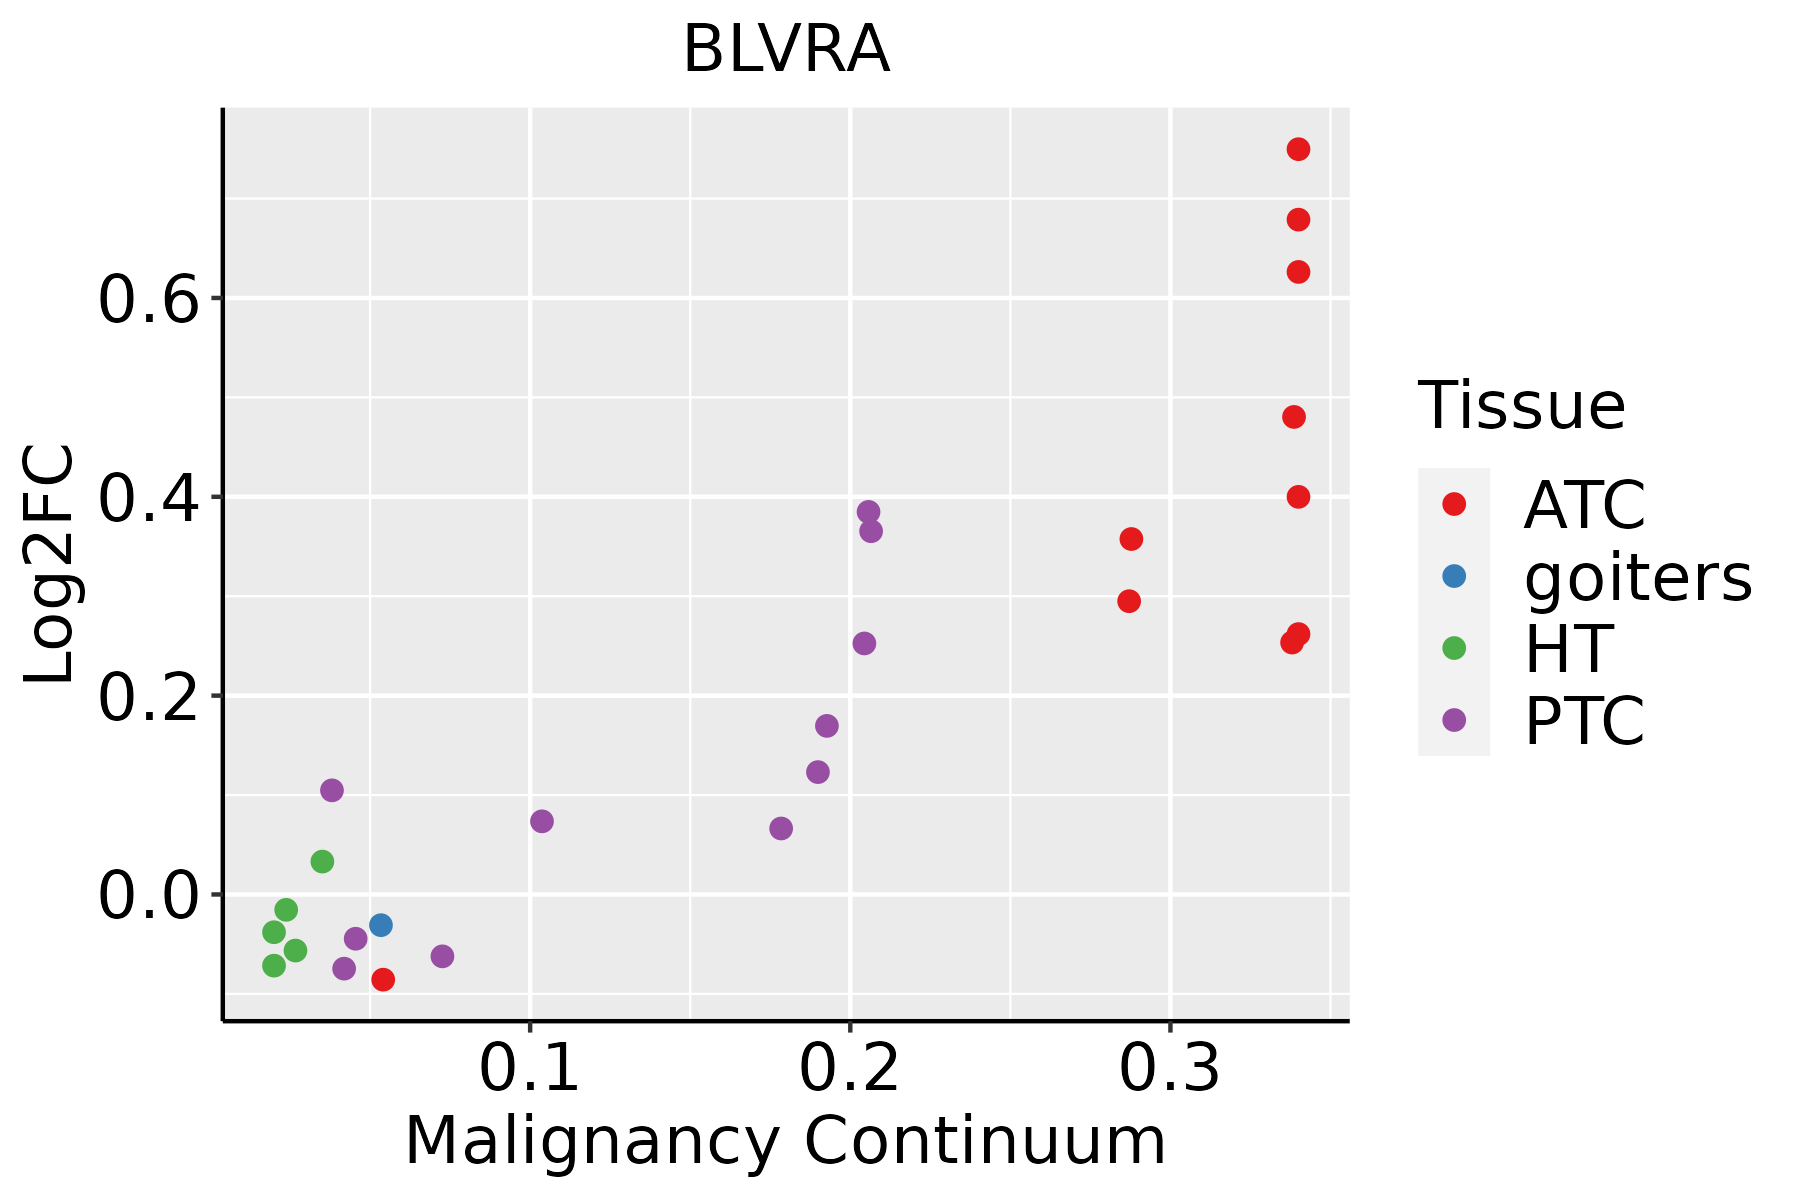
ATC: Anaplastic thyroid cancer
HT: Hashimoto's thyroiditis
PTC: Papillary thyroid cancer
∗log2FC in expression of this searched gene in stem-like cells from each diseased tissue sample relative to stem-like cells in normal samples in each tissue plotted against the malignancy continuum. Samples are colored based on if they are from different disease stage.

Top

Malignant transformation related pathway analysis

check buttonFind out the enriched GO biological processes and KEGG pathways involved in transition from healthy to precancer to cancer
check button Figure of enriched GO biological processes.
TissueDisease StageEnriched GO biological Processes
ColorectumADGO analysis - Figure of enriched GO biological processes: Top 15 enriched GO BP terms are showed in the bar plot of each disease state in each tissue. Each row represents a significant GO biological process which is colored according to the -log10(p.adjust).
ColorectumSERGO analysis - Figure of enriched GO biological processes: Top 15 enriched GO BP terms are showed in the bar plot of each disease state in each tissue. Each row represents a significant GO biological process which is colored according to the -log10(p.adjust).
ColorectumMSSGO analysis - Figure of enriched GO biological processes: Top 15 enriched GO BP terms are showed in the bar plot of each disease state in each tissue. Each row represents a significant GO biological process which is colored according to the -log10(p.adjust).
ColorectumMSI-HGO analysis - Figure of enriched GO biological processes: Top 15 enriched GO BP terms are showed in the bar plot of each disease state in each tissue. Each row represents a significant GO biological process which is colored according to the -log10(p.adjust).
ColorectumFAPGO analysis - Figure of enriched GO biological processes: Top 15 enriched GO BP terms are showed in the bar plot of each disease state in each tissue. Each row represents a significant GO biological process which is colored according to the -log10(p.adjust).
∗Top 15 enriched GO BP terms are showed in the bar plot of each disease state in each tissue. Each row represents a significant GO biological process which is colored according to the -log10(p.adjust).
Page: 1 2 3 4 5 6 7 8 9 

check button Enriched GO biological processes.
GO IDTissueDisease StageDescriptionGene RatioBg Ratiopvaluep.adjustCount
GO:004670018EsophagusESCCheterocycle catabolic process286/8552445/187231.12e-157.47e-14286
GO:004427019EsophagusESCCcellular nitrogen compound catabolic process288/8552451/187233.03e-151.79e-13288
GO:001943918EsophagusESCCaromatic compound catabolic process295/8552467/187231.09e-145.98e-13295
GO:190136118EsophagusESCCorganic cyclic compound catabolic process307/8552495/187239.99e-144.80e-12307
GO:00330132EsophagusESCCtetrapyrrole metabolic process37/855259/187236.23e-032.29e-0237
GO:00424401EsophagusESCCpigment metabolic process50/855284/187237.34e-032.64e-0250
GO:00421681EsophagusESCCheme metabolic process27/855242/187231.16e-023.90e-0227
GO:190136111LiverCirrhoticorganic cyclic compound catabolic process213/4634495/187231.58e-193.67e-17213
GO:001943911LiverCirrhoticaromatic compound catabolic process202/4634467/187236.93e-191.28e-16202
GO:004427011LiverCirrhoticcellular nitrogen compound catabolic process195/4634451/187232.99e-184.94e-16195
GO:004670011LiverCirrhoticheterocycle catabolic process192/4634445/187237.17e-181.12e-15192
GO:0006787LiverCirrhoticporphyrin-containing compound catabolic process8/463412/187232.59e-031.53e-028
GO:0033015LiverCirrhotictetrapyrrole catabolic process8/463412/187232.59e-031.53e-028
GO:0033013LiverCirrhotictetrapyrrole metabolic process24/463459/187235.06e-032.62e-0224
GO:0042167LiverCirrhoticheme catabolic process7/463411/187237.11e-033.41e-027
GO:0046149LiverCirrhoticpigment catabolic process7/463411/187237.11e-033.41e-027
GO:0006778LiverCirrhoticporphyrin-containing compound metabolic process20/463449/187239.60e-034.35e-0220
GO:004427021LiverHCCcellular nitrogen compound catabolic process303/7958451/187239.76e-273.64e-24303
GO:004670021LiverHCCheterocycle catabolic process299/7958445/187232.07e-267.29e-24299
GO:190136121LiverHCCorganic cyclic compound catabolic process325/7958495/187236.52e-262.18e-23325
Page: 1 2 3 

check button Enriched KEGG pathways.
Pathway IDTissueDisease StageDescriptionGene RatioBg Ratiopvaluep.adjustqvalueCount
Page: 1 

Top

Cell-cell communication analysis

check buttonIdentification of potential cell-cell interactions between two cell types and their ligand-receptor pairs for different disease states
LigandReceptorLRpairPathwayTissueDisease Stage
Page: 1 

Top

Single-cell gene regulatory network inference analysis

check buttonFind out the significant the regulons (TFs) and the target genes of each regulon across cell types for different disease states
TFCell TypeTissueDisease StageTarget GeneRSSRegulon Activity
∗The dot plots of a searched regulon are shown for all cell subpopulations in each disease state of each tissue based on the regulon specific score inferred using pySCENIC and by calculating the average expression.
Page: 1 

Top

Somatic mutation of malignant transformation related genes

check buttonAnnotation of somatic variants for genes involved in malignant transformation
Hugo SymbolVariant ClassVariant ClassificationdbSNP RSHGVScHGVSpHGVSp ShortSWISSPROTBIOTYPESIFTPolyPhenTumor Sample BarcodeTissueHistologySexAgeStageTherapy TypesDrugsOutcome
BLVRASNVMissense_Mutationnovelc.737N>Cp.Val246Alap.V246AP53004protein_codingtolerated(0.78)benign(0.001)TCGA-A7-A4SD-01Breastbreast invasive carcinomaFemale<65I/IIChemotherapytaxotereCR
BLVRASNVMissense_Mutationnovelc.173C>Ap.Ser58Tyrp.S58YP53004protein_codingdeleterious(0)probably_damaging(0.959)TCGA-AN-A046-01Breastbreast invasive carcinomaFemale>=65I/IIUnknownUnknownSD
BLVRASNVMissense_Mutationc.704N>Gp.Ser235Cysp.S235CP53004protein_codingdeleterious(0.05)probably_damaging(0.996)TCGA-GM-A2D9-01Breastbreast invasive carcinomaFemale>=65I/IIHormone TherapyarimidexSD
BLVRASNVMissense_Mutationc.512N>Ap.Ser171Tyrp.S171YP53004protein_codingdeleterious(0.01)probably_damaging(0.992)TCGA-GM-A2DO-01Breastbreast invasive carcinomaFemale<65I/IIHormone TherapytamoxiphenCR
BLVRAinsertionNonsense_Mutationnovelc.428_429insTCCTCCTTGCTCCTGAGGTGCAGGTCAAGCCCAGp.Lys143AsnfsTer6p.K143Nfs*6P53004protein_codingTCGA-AO-A0JB-01Breastbreast invasive carcinomaFemale<65III/IVChemotherapycyclophosphamideSD
BLVRAinsertionFrame_Shift_Insnovelc.448_449insCCACp.Leu150ProfsTer69p.L150Pfs*69P53004protein_codingTCGA-BH-A0B8-01Breastbreast invasive carcinomaFemale<65I/IIHormone TherapyarimidexSD
BLVRAinsertionNonsense_Mutationnovelc.449_450insGCAATTTCTGCCTCCCAGGTTCTAGTGATTCTCCTGp.Leu150_Leu151insGlnPheLeuProProArgPheTerTerPheSerCysp.L150_L151insQFLPPRF**FSCP53004protein_codingTCGA-BH-A0B8-01Breastbreast invasive carcinomaFemale<65I/IIHormone TherapyarimidexSD
BLVRASNVMissense_Mutationrs183114141c.127G>Ap.Val43Metp.V43MP53004protein_codingdeleterious(0)possibly_damaging(0.48)TCGA-2W-A8YY-01Cervixcervical & endocervical cancerFemale<65I/IIChemotherapycisplatinCR
BLVRASNVMissense_Mutationc.478N>Cp.Glu160Glnp.E160QP53004protein_codingtolerated(0.39)benign(0.188)TCGA-JW-A5VL-01Cervixcervical & endocervical cancerFemale<65I/IIUnknownUnknownSD
BLVRASNVMissense_Mutationrs183114141c.127N>Tp.Val43Leup.V43LP53004protein_codingdeleterious(0.02)benign(0.354)TCGA-A6-6140-01Colorectumcolon adenocarcinomaMale<65I/IIChemotherapyoxaliplatinSD
Page: 1 2 3 4 5 

Top

Related drugs of malignant transformation related genes

check buttonIdentification of chemicals and drugs interact with genes involved in malignant transfromation
(DGIdb 4.0)
Entrez IDSymbolCategoryInteraction TypesDrug Claim NameDrug NamePMIDs
644BLVRAENZYMEUrsodeoxycholic acid
Page: 1