
|
|||||
|
 | |
| |
| |
| |
| |
| |
|
Gene: BLOC1S6 |
Gene summary for BLOC1S6 |
| Gene information | Species | Human | Gene symbol | BLOC1S6 | Gene ID | 26258 |
| Gene name | biogenesis of lysosomal organelles complex 1 subunit 6 | |
| Gene Alias | BLOS6 | |
| Cytomap | 15q21.1 | |
| Gene Type | protein-coding | GO ID | GO:0001505 | UniProtAcc | B3KY40 |
Top |
Malignant transformation analysis |
| Identification of the aberrant gene expression in precancerous and cancerous lesions by comparing the gene expression of stem-like cells in diseased tissues with normal stem cells |
| Entrez ID | Symbol | Replicates | Species | Organ | Tissue | Adj P-value | Log2FC | Malignancy |
| 26258 | BLOC1S6 | LZE2T | Human | Esophagus | ESCC | 1.90e-06 | 3.14e-01 | 0.082 |
| 26258 | BLOC1S6 | LZE4T | Human | Esophagus | ESCC | 1.09e-12 | 3.69e-01 | 0.0811 |
| 26258 | BLOC1S6 | LZE24T | Human | Esophagus | ESCC | 1.03e-07 | 1.97e-01 | 0.0596 |
| 26258 | BLOC1S6 | LZE21T | Human | Esophagus | ESCC | 2.31e-06 | 9.93e-02 | 0.0655 |
| 26258 | BLOC1S6 | LZE6T | Human | Esophagus | ESCC | 2.30e-04 | 1.40e-01 | 0.0845 |
| 26258 | BLOC1S6 | P1T-E | Human | Esophagus | ESCC | 1.54e-08 | 5.37e-01 | 0.0875 |
| 26258 | BLOC1S6 | P2T-E | Human | Esophagus | ESCC | 1.76e-20 | 3.37e-01 | 0.1177 |
| 26258 | BLOC1S6 | P4T-E | Human | Esophagus | ESCC | 2.27e-30 | 7.03e-01 | 0.1323 |
| 26258 | BLOC1S6 | P5T-E | Human | Esophagus | ESCC | 1.27e-17 | 3.30e-01 | 0.1327 |
| 26258 | BLOC1S6 | P8T-E | Human | Esophagus | ESCC | 6.63e-27 | 4.79e-01 | 0.0889 |
| 26258 | BLOC1S6 | P9T-E | Human | Esophagus | ESCC | 4.76e-18 | 3.52e-01 | 0.1131 |
| 26258 | BLOC1S6 | P10T-E | Human | Esophagus | ESCC | 3.35e-27 | 5.52e-01 | 0.116 |
| 26258 | BLOC1S6 | P11T-E | Human | Esophagus | ESCC | 3.34e-09 | 3.73e-01 | 0.1426 |
| 26258 | BLOC1S6 | P12T-E | Human | Esophagus | ESCC | 6.66e-23 | 4.73e-01 | 0.1122 |
| 26258 | BLOC1S6 | P15T-E | Human | Esophagus | ESCC | 2.40e-19 | 4.33e-01 | 0.1149 |
| 26258 | BLOC1S6 | P16T-E | Human | Esophagus | ESCC | 4.94e-25 | 4.16e-01 | 0.1153 |
| 26258 | BLOC1S6 | P17T-E | Human | Esophagus | ESCC | 1.07e-04 | 2.42e-01 | 0.1278 |
| 26258 | BLOC1S6 | P19T-E | Human | Esophagus | ESCC | 1.69e-07 | 7.80e-01 | 0.1662 |
| 26258 | BLOC1S6 | P20T-E | Human | Esophagus | ESCC | 2.08e-25 | 2.48e-01 | 0.1124 |
| 26258 | BLOC1S6 | P21T-E | Human | Esophagus | ESCC | 8.67e-18 | 2.59e-01 | 0.1617 |
| Page: 1 2 3 4 5 6 |
| Tissue | Expression Dynamics | Abbreviation |
| Esophagus | 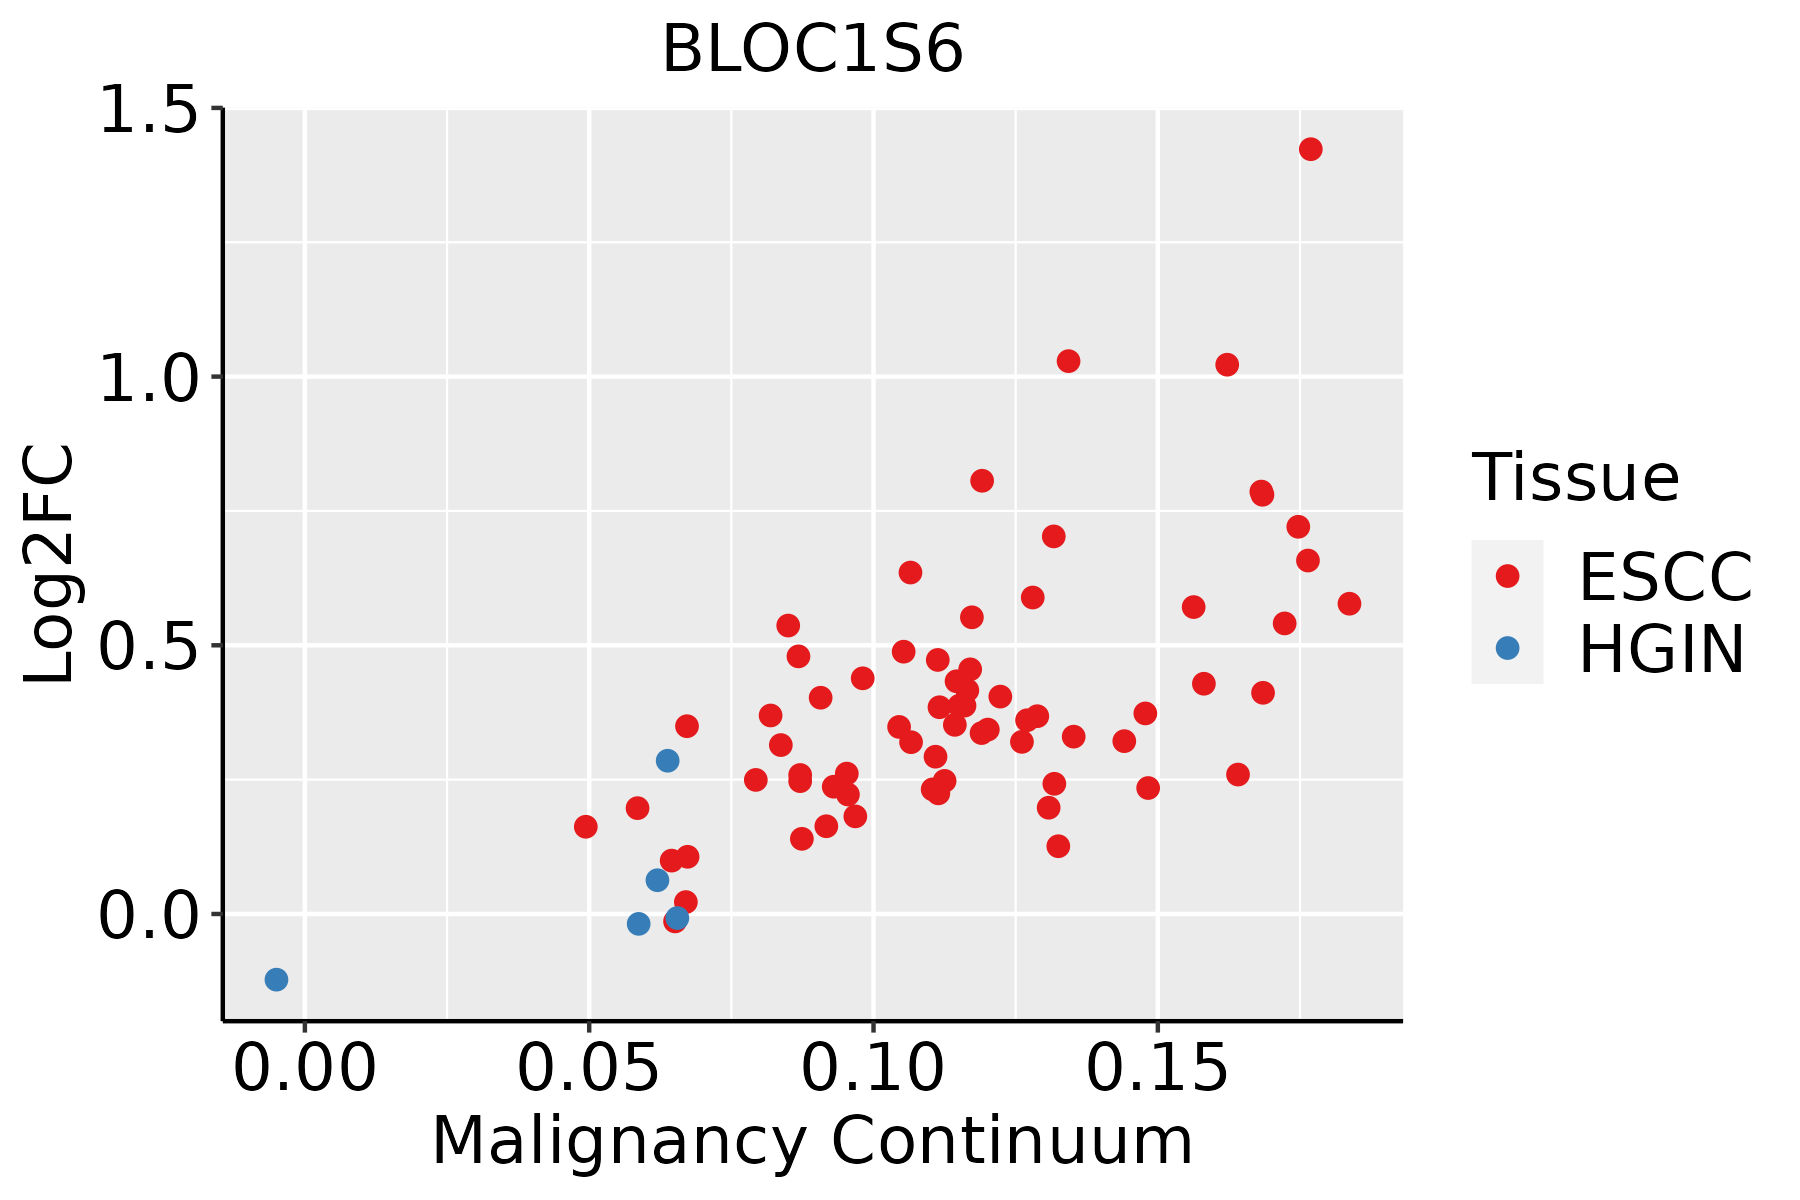 | ESCC: Esophageal squamous cell carcinoma |
| HGIN: High-grade intraepithelial neoplasias | ||
| LGIN: Low-grade intraepithelial neoplasias | ||
| Liver | 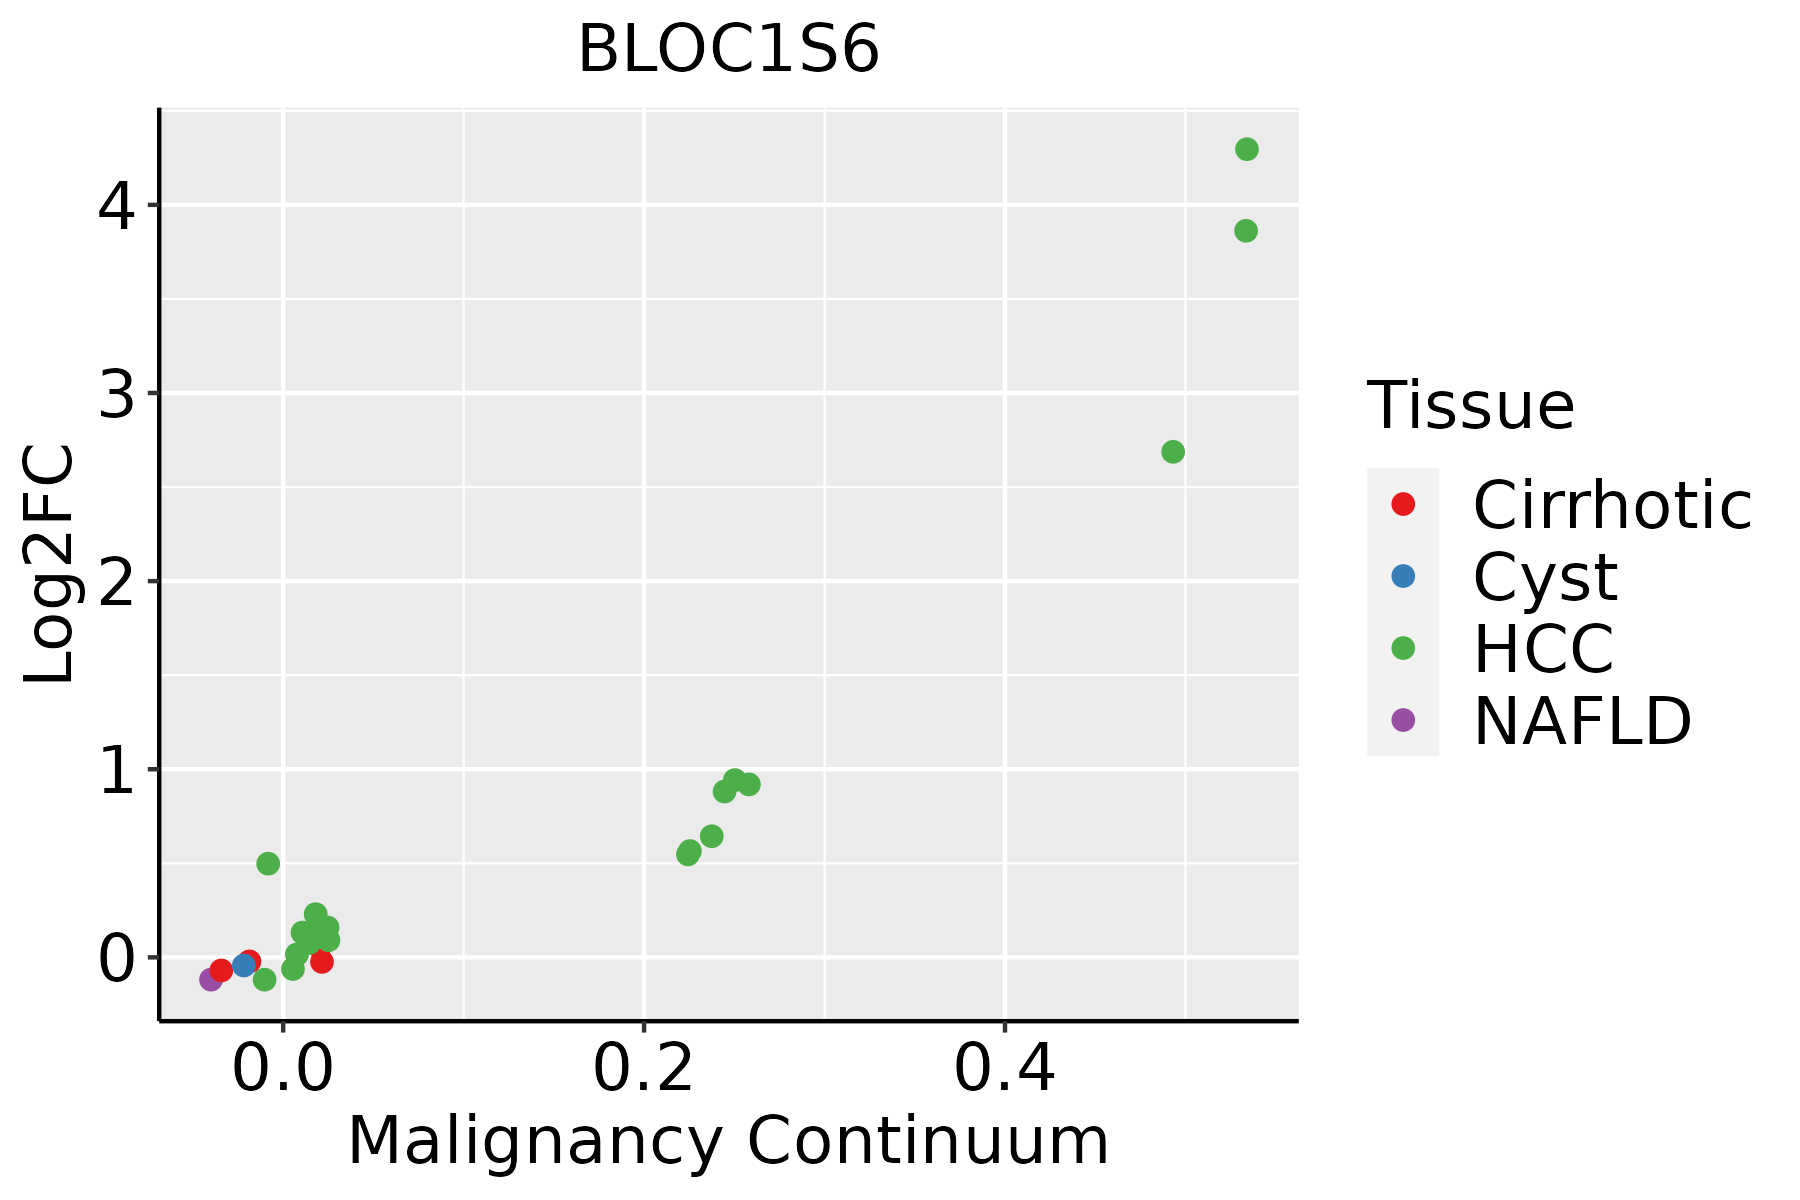 | HCC: Hepatocellular carcinoma |
| NAFLD: Non-alcoholic fatty liver disease | ||
| Oral Cavity | 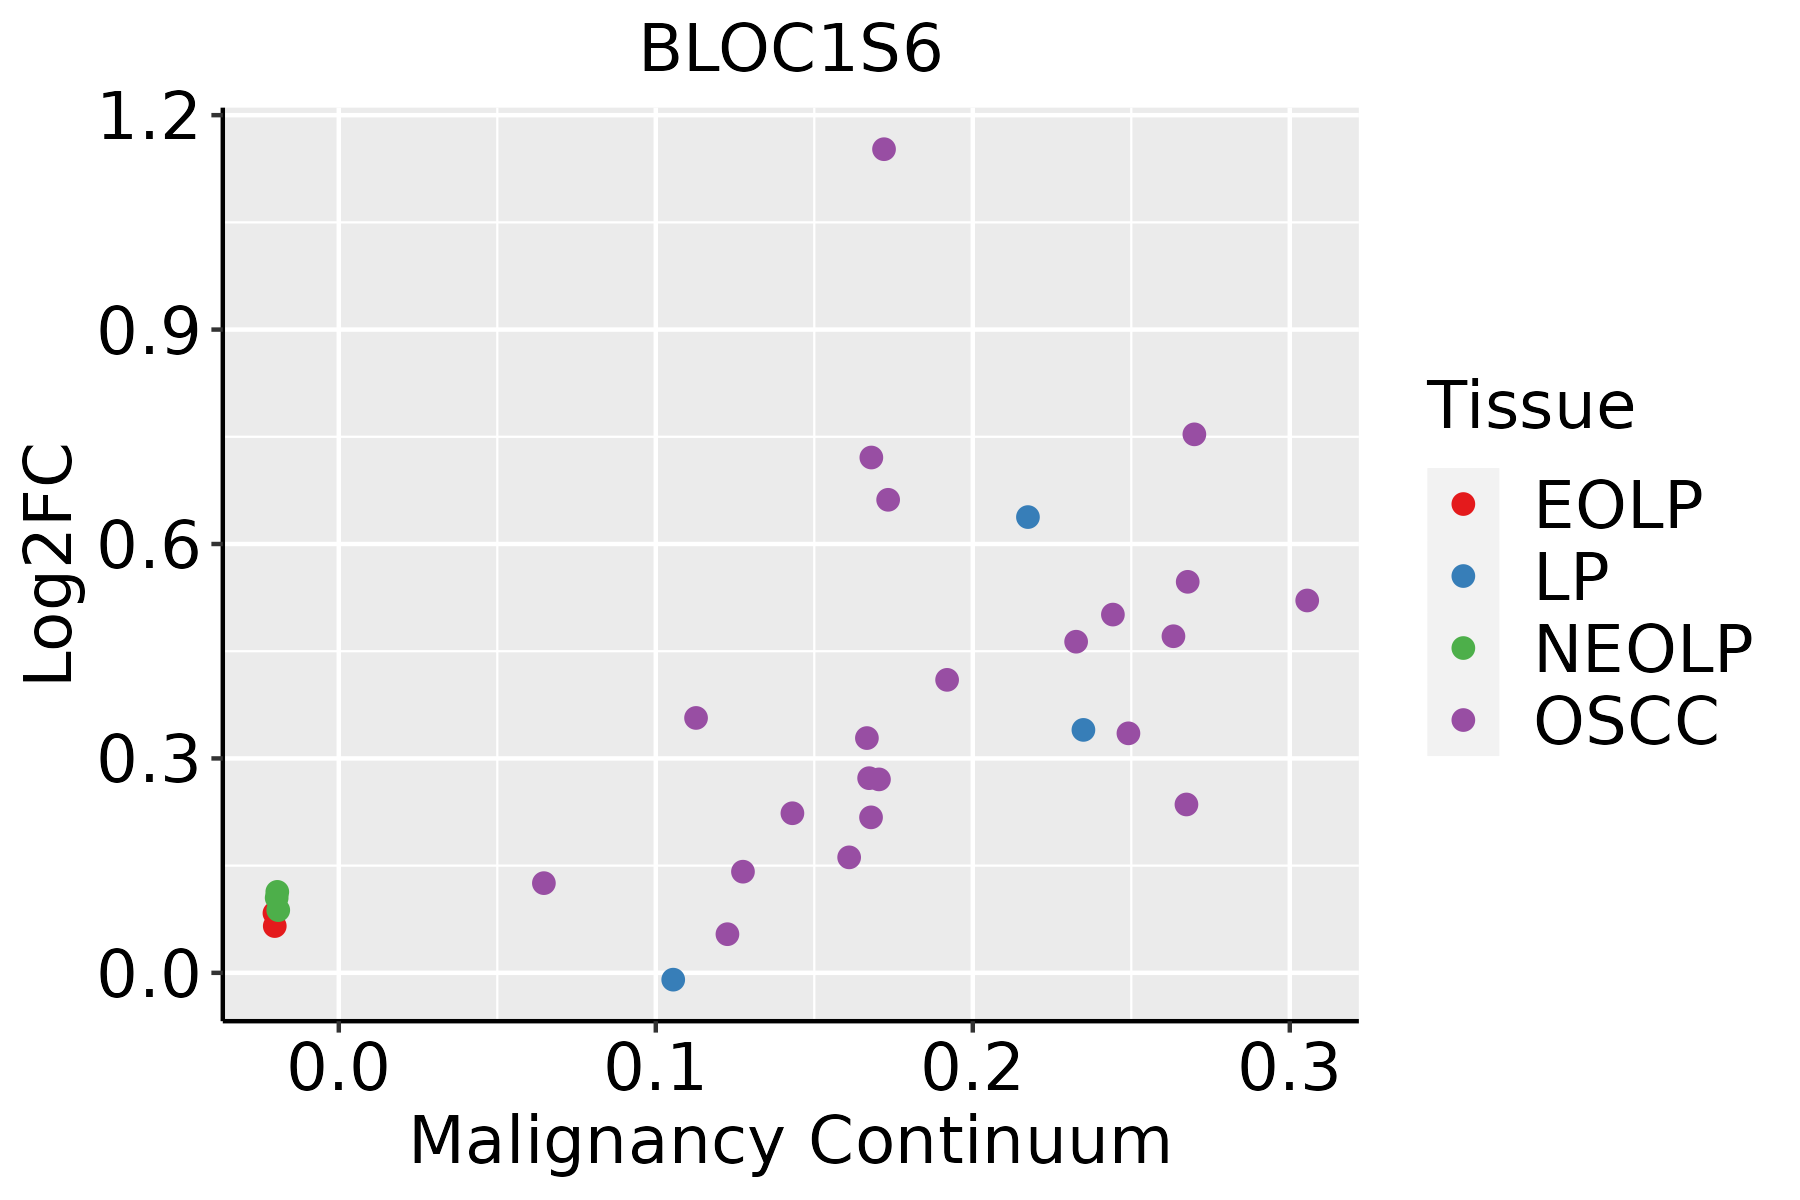 | EOLP: Erosive Oral lichen planus |
| LP: leukoplakia | ||
| NEOLP: Non-erosive oral lichen planus | ||
| OSCC: Oral squamous cell carcinoma | ||
| Prostate | 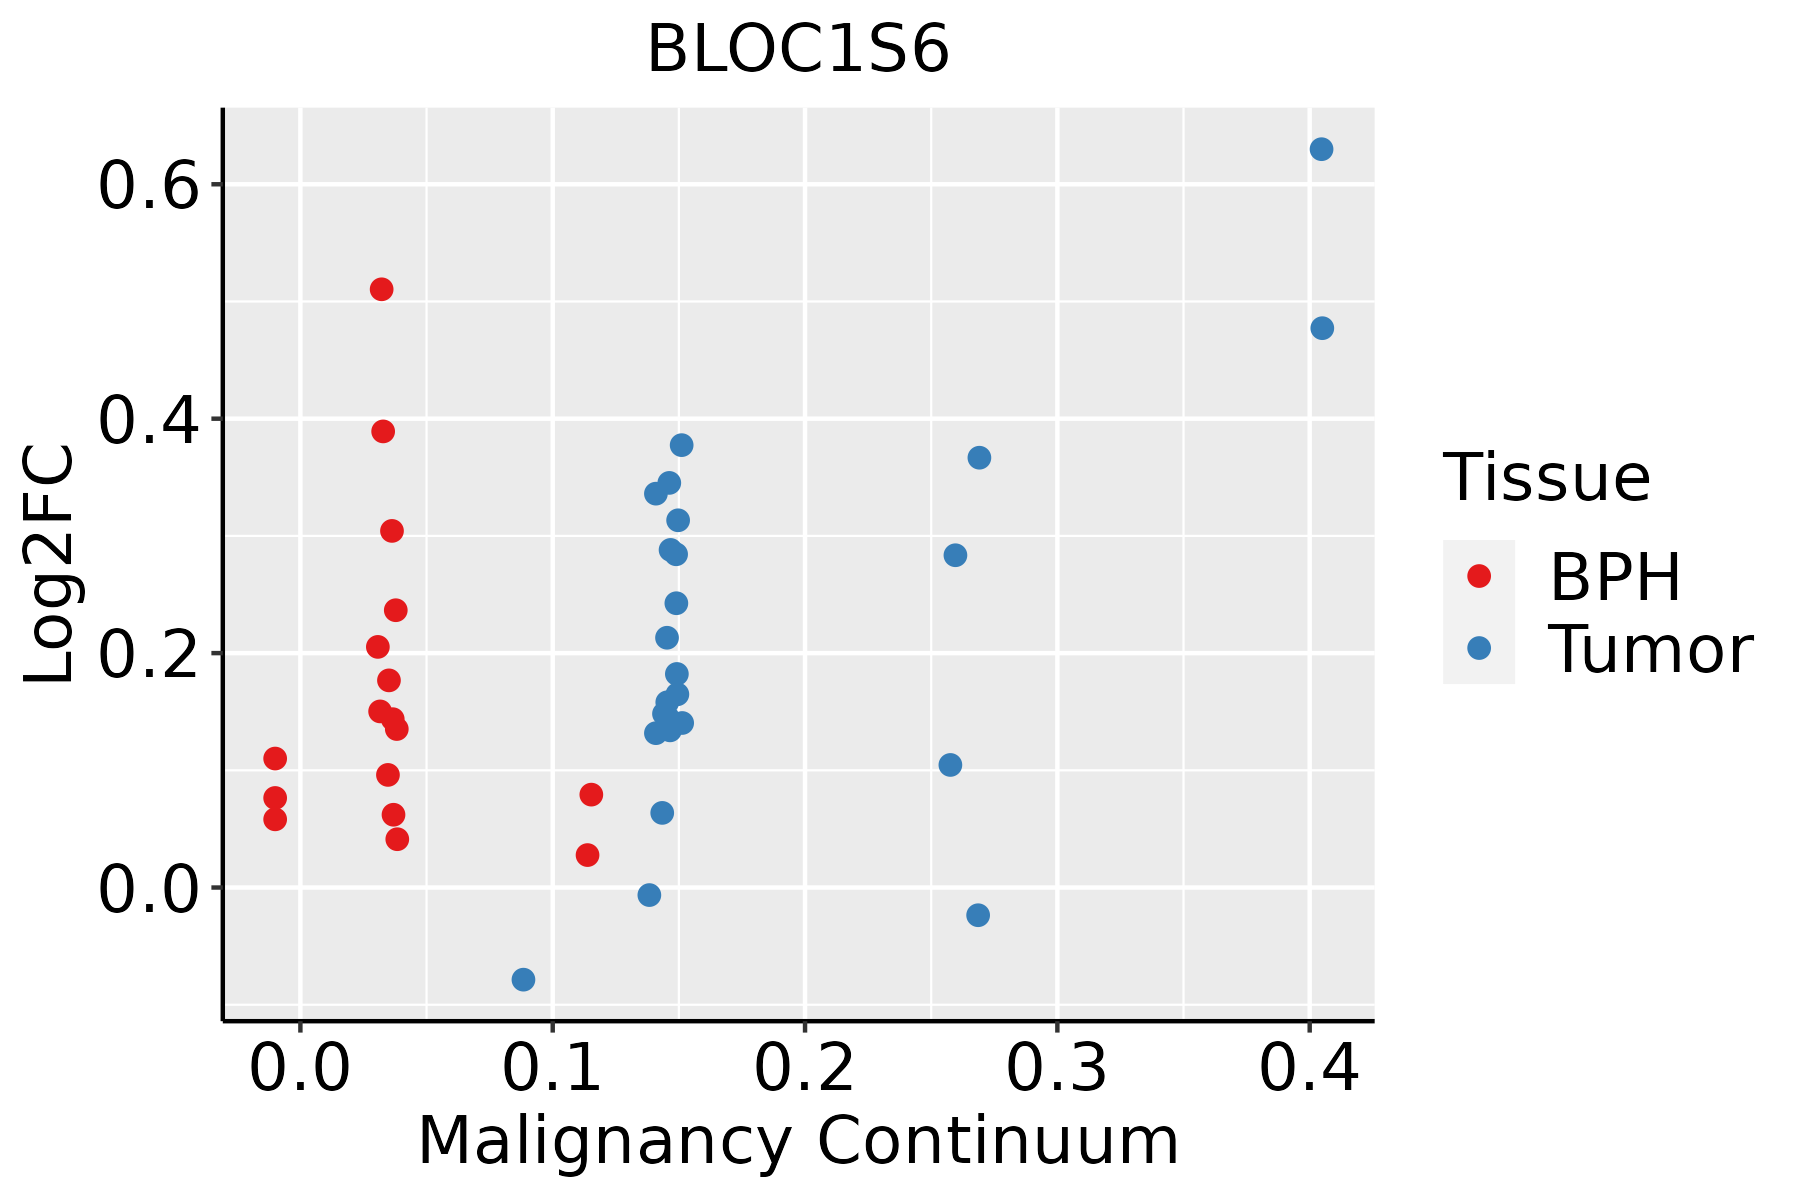 | BPH: Benign Prostatic Hyperplasia |
| Skin |  | AK: Actinic keratosis |
| cSCC: Cutaneous squamous cell carcinoma | ||
| SCCIS:squamous cell carcinoma in situ | ||
| Thyroid | 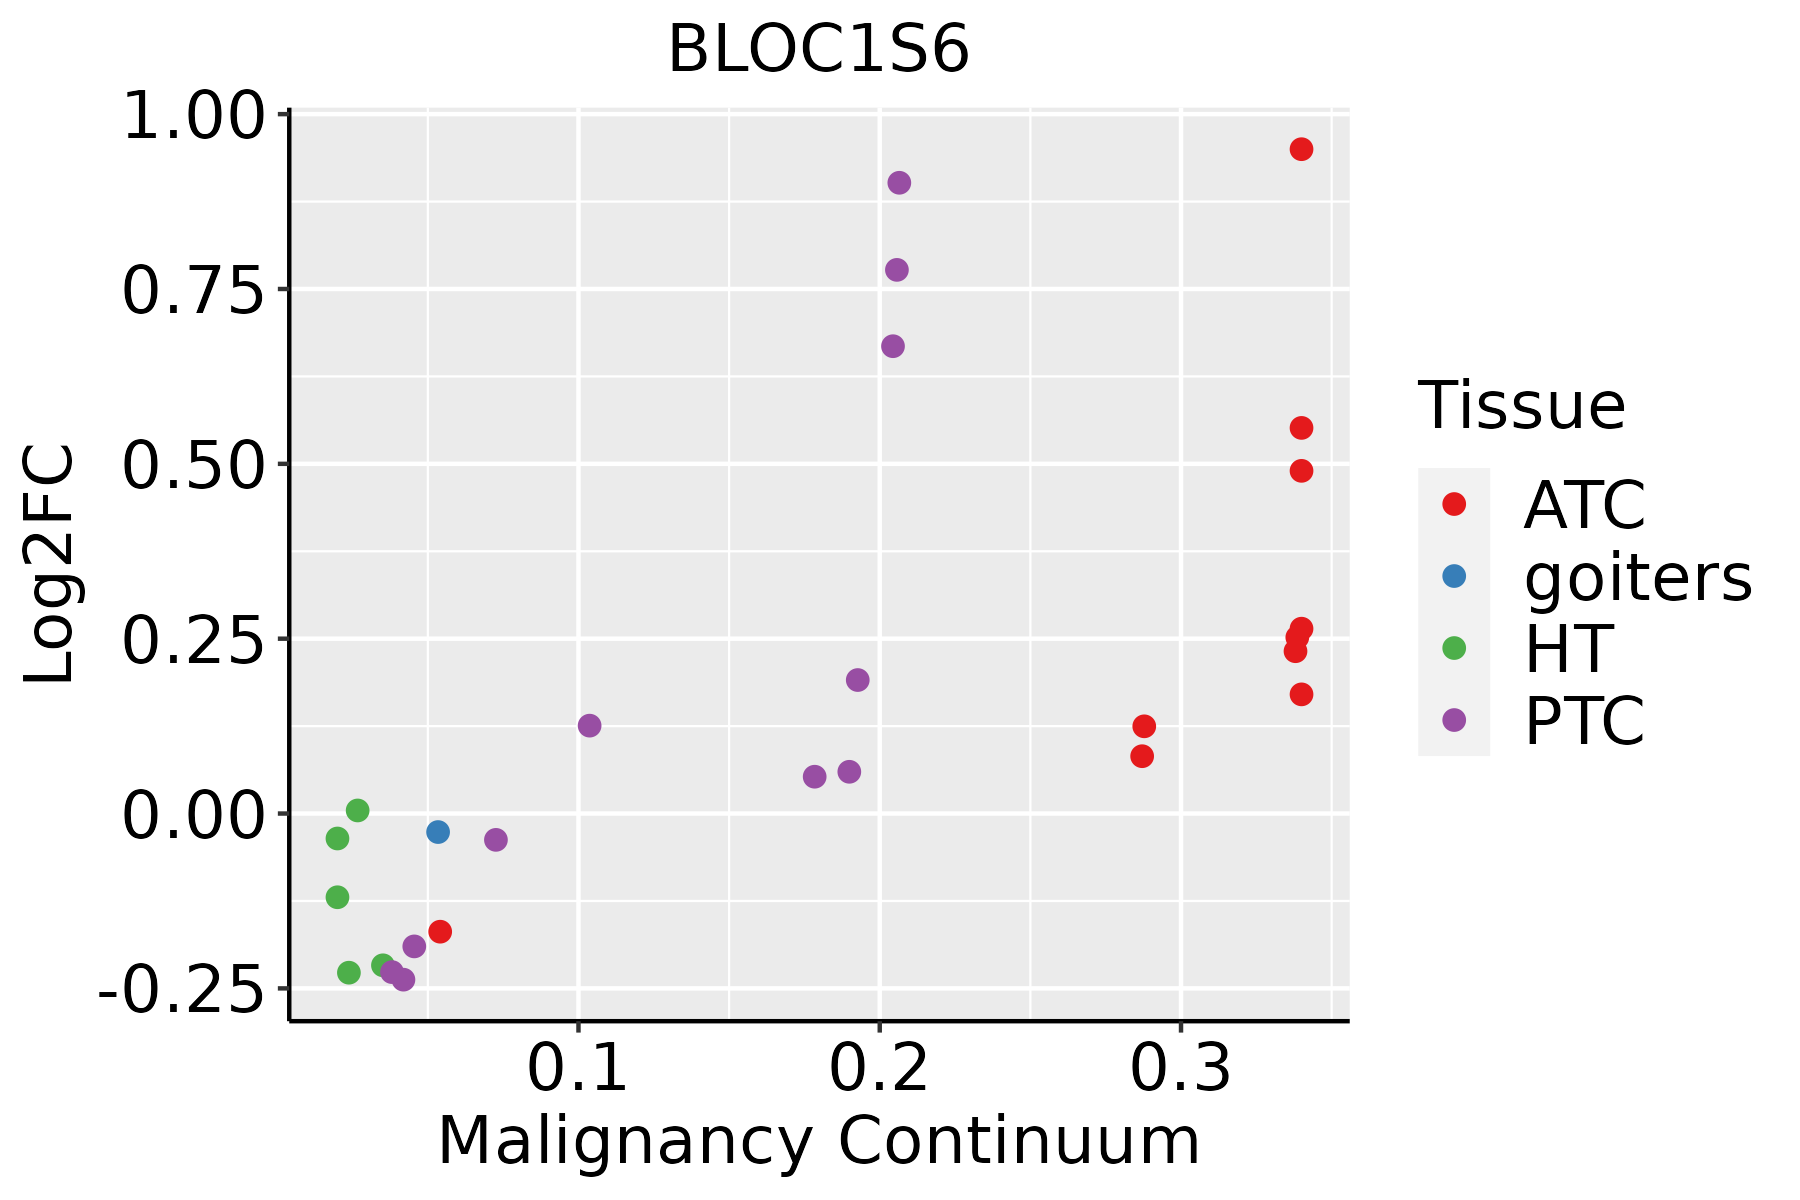 | ATC: Anaplastic thyroid cancer |
| HT: Hashimoto's thyroiditis | ||
| PTC: Papillary thyroid cancer |
| ∗log2FC in expression of this searched gene in stem-like cells from each diseased tissue sample relative to stem-like cells in normal samples in each tissue plotted against the malignancy continuum. Samples are colored based on if they are from different disease stage. |
Top |
Malignant transformation related pathway analysis |
| Find out the enriched GO biological processes and KEGG pathways involved in transition from healthy to precancer to cancer |
| Tissue | Disease Stage | Enriched GO biological Processes |
| Colorectum | AD |  |
| Colorectum | SER |  |
| Colorectum | MSS |  |
| Colorectum | MSI-H |  |
| Colorectum | FAP |  |
| ∗Top 15 enriched GO BP terms are showed in the bar plot of each disease state in each tissue. Each row represents a significant GO biological process which is colored according to the -log10(p.adjust). |
| Page: 1 2 3 4 5 6 7 8 9 |
| GO ID | Tissue | Disease Stage | Description | Gene Ratio | Bg Ratio | pvalue | p.adjust | Count |
| GO:005165617 | Esophagus | ESCC | establishment of organelle localization | 273/8552 | 390/18723 | 9.13e-23 | 1.81e-20 | 273 |
| GO:001605014 | Esophagus | ESCC | vesicle organization | 211/8552 | 300/18723 | 2.85e-18 | 2.87e-16 | 211 |
| GO:005165016 | Esophagus | ESCC | establishment of vesicle localization | 114/8552 | 161/18723 | 8.20e-11 | 2.53e-09 | 114 |
| GO:003070518 | Esophagus | ESCC | cytoskeleton-dependent intracellular transport | 133/8552 | 195/18723 | 1.48e-10 | 4.27e-09 | 133 |
| GO:001097013 | Esophagus | ESCC | transport along microtubule | 107/8552 | 155/18723 | 3.17e-09 | 6.80e-08 | 107 |
| GO:005164815 | Esophagus | ESCC | vesicle localization | 119/8552 | 177/18723 | 5.16e-09 | 1.08e-07 | 119 |
| GO:00723846 | Esophagus | ESCC | organelle transport along microtubule | 65/8552 | 85/18723 | 6.61e-09 | 1.35e-07 | 65 |
| GO:000808810 | Esophagus | ESCC | axo-dendritic transport | 58/8552 | 75/18723 | 2.09e-08 | 4.02e-07 | 58 |
| GO:00989304 | Esophagus | ESCC | axonal transport | 49/8552 | 64/18723 | 4.54e-07 | 6.15e-06 | 49 |
| GO:004206027 | Esophagus | ESCC | wound healing | 243/8552 | 422/18723 | 4.62e-07 | 6.25e-06 | 243 |
| GO:00224069 | Esophagus | ESCC | membrane docking | 62/8552 | 86/18723 | 5.93e-07 | 7.79e-06 | 62 |
| GO:00330593 | Esophagus | ESCC | cellular pigmentation | 40/8552 | 53/18723 | 9.67e-06 | 9.21e-05 | 40 |
| GO:00474962 | Esophagus | ESCC | vesicle transport along microtubule | 36/8552 | 47/18723 | 1.53e-05 | 1.38e-04 | 36 |
| GO:00991114 | Esophagus | ESCC | microtubule-based transport | 115/8552 | 190/18723 | 2.54e-05 | 2.15e-04 | 115 |
| GO:01400567 | Esophagus | ESCC | organelle localization by membrane tethering | 53/8552 | 77/18723 | 3.33e-05 | 2.74e-04 | 53 |
| GO:00080892 | Esophagus | ESCC | anterograde axonal transport | 37/8552 | 50/18723 | 4.42e-05 | 3.51e-04 | 37 |
| GO:00995185 | Esophagus | ESCC | vesicle cytoskeletal trafficking | 50/8552 | 73/18723 | 6.75e-05 | 5.12e-04 | 50 |
| GO:00610254 | Esophagus | ESCC | membrane fusion | 98/8552 | 163/18723 | 1.39e-04 | 9.41e-04 | 98 |
| GO:00487531 | Esophagus | ESCC | pigment granule organization | 23/8552 | 29/18723 | 2.25e-04 | 1.40e-03 | 23 |
| GO:00324381 | Esophagus | ESCC | melanosome organization | 22/8552 | 28/18723 | 3.95e-04 | 2.26e-03 | 22 |
| Page: 1 2 3 4 5 6 7 8 9 10 |
| Pathway ID | Tissue | Disease Stage | Description | Gene Ratio | Bg Ratio | pvalue | p.adjust | qvalue | Count |
| Page: 1 |
Top |
Cell-cell communication analysis |
| Identification of potential cell-cell interactions between two cell types and their ligand-receptor pairs for different disease states |
| Ligand | Receptor | LRpair | Pathway | Tissue | Disease Stage |
| Page: 1 |
Top |
Single-cell gene regulatory network inference analysis |
| Find out the significant the regulons (TFs) and the target genes of each regulon across cell types for different disease states |
| TF | Cell Type | Tissue | Disease Stage | Target Gene | RSS | Regulon Activity |
| ∗The dot plots of a searched regulon are shown for all cell subpopulations in each disease state of each tissue based on the regulon specific score inferred using pySCENIC and by calculating the average expression. |
| Page: 1 |
Top |
Somatic mutation of malignant transformation related genes |
| Annotation of somatic variants for genes involved in malignant transformation |
| Hugo Symbol | Variant Class | Variant Classification | dbSNP RS | HGVSc | HGVSp | HGVSp Short | SWISSPROT | BIOTYPE | SIFT | PolyPhen | Tumor Sample Barcode | Tissue | Histology | Sex | Age | Stage | Therapy Types | Drugs | Outcome |
| BLOC1S6 | SNV | Missense_Mutation | c.239N>G | p.Thr80Arg | p.T80R | protein_coding | deleterious(0.01) | possibly_damaging(0.836) | TCGA-D8-A27R-01 | Breast | breast invasive carcinoma | Female | <65 | III/IV | Chemotherapy | adriamycin+cyclophosphamide | SD | ||
| BLOC1S6 | SNV | Missense_Mutation | c.279G>T | p.Glu93Asp | p.E93D | protein_coding | deleterious(0.01) | probably_damaging(0.99) | TCGA-AA-A010-01 | Colorectum | colon adenocarcinoma | Female | <65 | I/II | Chemotherapy | folinic | CR | ||
| BLOC1S6 | SNV | Missense_Mutation | novel | c.254N>C | p.Val85Ala | p.V85A | protein_coding | tolerated(0.07) | benign(0.338) | TCGA-B5-A3FC-01 | Endometrium | uterine corpus endometrioid carcinoma | Female | <65 | I/II | Unknown | Unknown | SD | |
| BLOC1S6 | SNV | Missense_Mutation | rs779791657 | c.130N>G | p.Ile44Val | p.I44V | protein_coding | tolerated_low_confidence(1) | benign(0) | TCGA-D1-A17Q-01 | Endometrium | uterine corpus endometrioid carcinoma | Female | <65 | I/II | Unknown | Unknown | SD | |
| BLOC1S6 | SNV | Missense_Mutation | novel | c.427A>G | p.Lys143Glu | p.K143E | protein_coding | deleterious(0) | possibly_damaging(0.572) | TCGA-DF-A2KU-01 | Endometrium | uterine corpus endometrioid carcinoma | Female | Unknown | I/II | Unknown | Unknown | SD | |
| BLOC1S6 | SNV | Missense_Mutation | c.139N>A | p.Leu47Met | p.L47M | protein_coding | tolerated(0.13) | possibly_damaging(0.73) | TCGA-DD-A1EE-01 | Liver | liver hepatocellular carcinoma | Male | >=65 | III/IV | Unknown | Unknown | PD | ||
| BLOC1S6 | SNV | Missense_Mutation | c.139N>A | p.Leu47Met | p.L47M | protein_coding | tolerated(0.13) | possibly_damaging(0.73) | TCGA-DD-A1EF-01 | Liver | liver hepatocellular carcinoma | Female | <65 | I/II | Unknown | Unknown | PD | ||
| BLOC1S6 | SNV | Missense_Mutation | novel | c.223N>T | p.Ala75Ser | p.A75S | protein_coding | tolerated(0.4) | probably_damaging(0.995) | TCGA-34-2604-01 | Lung | lung squamous cell carcinoma | Female | >=65 | I/II | Unknown | Unknown | SD | |
| BLOC1S6 | SNV | Missense_Mutation | novel | c.430C>G | p.Leu144Val | p.L144V | protein_coding | deleterious(0.01) | benign(0.41) | TCGA-6A-AB49-01 | Lung | lung squamous cell carcinoma | Female | >=65 | I/II | Unknown | Unknown | SD | |
| BLOC1S6 | SNV | Missense_Mutation | novel | c.210G>C | p.Gln70His | p.Q70H | protein_coding | deleterious(0.02) | possibly_damaging(0.851) | TCGA-BA-6872-01 | Oral cavity | head & neck squamous cell carcinoma | Male | <65 | I/II | Unspecific | PD |
| Page: 1 2 |
Top |
Related drugs of malignant transformation related genes |
| Identification of chemicals and drugs interact with genes involved in malignant transfromation |
| (DGIdb 4.0) |
| Entrez ID | Symbol | Category | Interaction Types | Drug Claim Name | Drug Name | PMIDs |
| Page: 1 |

Copyright 2023-Present -The University of Texas Health Science Center at Houston |