
|
|||||
|
 | |
| |
| |
| |
| |
| |
|
Gene: BLOC1S5 |
Gene summary for BLOC1S5 |
| Gene information | Species | Human | Gene symbol | BLOC1S5 | Gene ID | 63915 |
| Gene name | biogenesis of lysosomal organelles complex 1 subunit 5 | |
| Gene Alias | BLOS5 | |
| Cytomap | 6p24.3 | |
| Gene Type | protein-coding | GO ID | GO:0006810 | UniProtAcc | Q8TDH9 |
Top |
Malignant transformation analysis |
| Identification of the aberrant gene expression in precancerous and cancerous lesions by comparing the gene expression of stem-like cells in diseased tissues with normal stem cells |
| Entrez ID | Symbol | Replicates | Species | Organ | Tissue | Adj P-value | Log2FC | Malignancy |
| 63915 | BLOC1S5 | LZE4T | Human | Esophagus | ESCC | 1.30e-04 | 2.21e-01 | 0.0811 |
| 63915 | BLOC1S5 | LZE8T | Human | Esophagus | ESCC | 2.58e-04 | 1.35e-01 | 0.067 |
| 63915 | BLOC1S5 | LZE22T | Human | Esophagus | ESCC | 1.24e-03 | 2.31e-01 | 0.068 |
| 63915 | BLOC1S5 | LZE24T | Human | Esophagus | ESCC | 9.50e-11 | 2.25e-01 | 0.0596 |
| 63915 | BLOC1S5 | LZE6T | Human | Esophagus | ESCC | 3.54e-04 | 1.67e-01 | 0.0845 |
| 63915 | BLOC1S5 | P2T-E | Human | Esophagus | ESCC | 3.19e-23 | 4.20e-01 | 0.1177 |
| 63915 | BLOC1S5 | P4T-E | Human | Esophagus | ESCC | 7.72e-10 | 2.33e-01 | 0.1323 |
| 63915 | BLOC1S5 | P5T-E | Human | Esophagus | ESCC | 1.78e-03 | 8.27e-02 | 0.1327 |
| 63915 | BLOC1S5 | P8T-E | Human | Esophagus | ESCC | 1.88e-04 | 1.14e-01 | 0.0889 |
| 63915 | BLOC1S5 | P9T-E | Human | Esophagus | ESCC | 3.01e-06 | 1.28e-01 | 0.1131 |
| 63915 | BLOC1S5 | P10T-E | Human | Esophagus | ESCC | 1.97e-10 | 2.12e-01 | 0.116 |
| 63915 | BLOC1S5 | P11T-E | Human | Esophagus | ESCC | 2.17e-09 | 2.73e-01 | 0.1426 |
| 63915 | BLOC1S5 | P12T-E | Human | Esophagus | ESCC | 4.40e-09 | 2.18e-01 | 0.1122 |
| 63915 | BLOC1S5 | P15T-E | Human | Esophagus | ESCC | 4.74e-03 | 1.20e-01 | 0.1149 |
| 63915 | BLOC1S5 | P16T-E | Human | Esophagus | ESCC | 1.53e-19 | 2.84e-01 | 0.1153 |
| 63915 | BLOC1S5 | P17T-E | Human | Esophagus | ESCC | 1.08e-03 | 1.86e-01 | 0.1278 |
| 63915 | BLOC1S5 | P20T-E | Human | Esophagus | ESCC | 1.30e-08 | 2.76e-01 | 0.1124 |
| 63915 | BLOC1S5 | P21T-E | Human | Esophagus | ESCC | 9.44e-07 | 1.15e-01 | 0.1617 |
| 63915 | BLOC1S5 | P22T-E | Human | Esophagus | ESCC | 9.20e-06 | 1.28e-01 | 0.1236 |
| 63915 | BLOC1S5 | P23T-E | Human | Esophagus | ESCC | 3.51e-07 | 2.07e-01 | 0.108 |
| Page: 1 2 3 |
| Tissue | Expression Dynamics | Abbreviation |
| Esophagus | 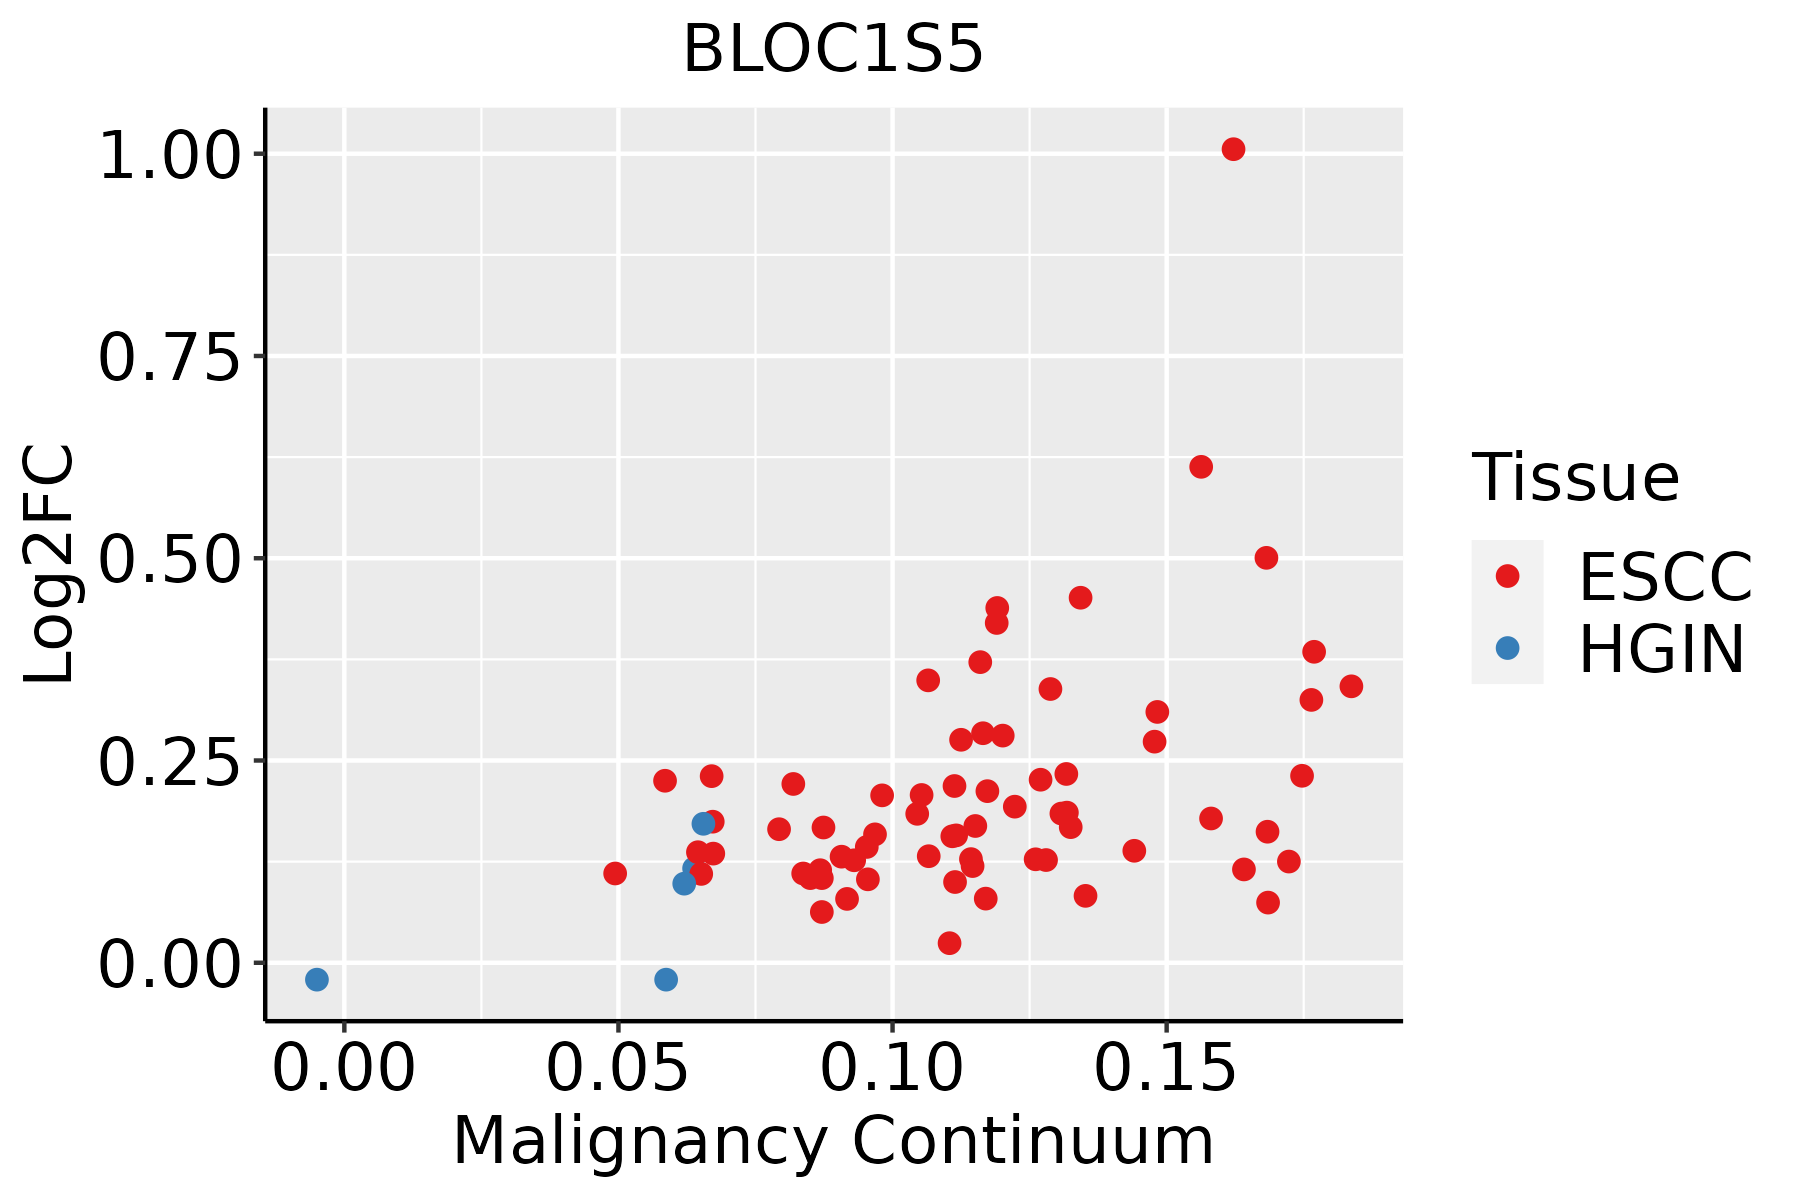 | ESCC: Esophageal squamous cell carcinoma |
| HGIN: High-grade intraepithelial neoplasias | ||
| LGIN: Low-grade intraepithelial neoplasias |
| ∗log2FC in expression of this searched gene in stem-like cells from each diseased tissue sample relative to stem-like cells in normal samples in each tissue plotted against the malignancy continuum. Samples are colored based on if they are from different disease stage. |
Top |
Malignant transformation related pathway analysis |
| Find out the enriched GO biological processes and KEGG pathways involved in transition from healthy to precancer to cancer |
| Tissue | Disease Stage | Enriched GO biological Processes |
| Colorectum | AD |  |
| Colorectum | SER |  |
| Colorectum | MSS |  |
| Colorectum | MSI-H |  |
| Colorectum | FAP |  |
| ∗Top 15 enriched GO BP terms are showed in the bar plot of each disease state in each tissue. Each row represents a significant GO biological process which is colored according to the -log10(p.adjust). |
| Page: 1 2 3 4 5 6 7 8 9 |
| GO ID | Tissue | Disease Stage | Description | Gene Ratio | Bg Ratio | pvalue | p.adjust | Count |
| GO:005165617 | Esophagus | ESCC | establishment of organelle localization | 273/8552 | 390/18723 | 9.13e-23 | 1.81e-20 | 273 |
| GO:001605014 | Esophagus | ESCC | vesicle organization | 211/8552 | 300/18723 | 2.85e-18 | 2.87e-16 | 211 |
| GO:005165016 | Esophagus | ESCC | establishment of vesicle localization | 114/8552 | 161/18723 | 8.20e-11 | 2.53e-09 | 114 |
| GO:003070518 | Esophagus | ESCC | cytoskeleton-dependent intracellular transport | 133/8552 | 195/18723 | 1.48e-10 | 4.27e-09 | 133 |
| GO:001097013 | Esophagus | ESCC | transport along microtubule | 107/8552 | 155/18723 | 3.17e-09 | 6.80e-08 | 107 |
| GO:005164815 | Esophagus | ESCC | vesicle localization | 119/8552 | 177/18723 | 5.16e-09 | 1.08e-07 | 119 |
| GO:00723846 | Esophagus | ESCC | organelle transport along microtubule | 65/8552 | 85/18723 | 6.61e-09 | 1.35e-07 | 65 |
| GO:000808810 | Esophagus | ESCC | axo-dendritic transport | 58/8552 | 75/18723 | 2.09e-08 | 4.02e-07 | 58 |
| GO:00989304 | Esophagus | ESCC | axonal transport | 49/8552 | 64/18723 | 4.54e-07 | 6.15e-06 | 49 |
| GO:00330593 | Esophagus | ESCC | cellular pigmentation | 40/8552 | 53/18723 | 9.67e-06 | 9.21e-05 | 40 |
| GO:00474962 | Esophagus | ESCC | vesicle transport along microtubule | 36/8552 | 47/18723 | 1.53e-05 | 1.38e-04 | 36 |
| GO:00991114 | Esophagus | ESCC | microtubule-based transport | 115/8552 | 190/18723 | 2.54e-05 | 2.15e-04 | 115 |
| GO:00080892 | Esophagus | ESCC | anterograde axonal transport | 37/8552 | 50/18723 | 4.42e-05 | 3.51e-04 | 37 |
| GO:00995185 | Esophagus | ESCC | vesicle cytoskeletal trafficking | 50/8552 | 73/18723 | 6.75e-05 | 5.12e-04 | 50 |
| GO:00487531 | Esophagus | ESCC | pigment granule organization | 23/8552 | 29/18723 | 2.25e-04 | 1.40e-03 | 23 |
| GO:00324381 | Esophagus | ESCC | melanosome organization | 22/8552 | 28/18723 | 3.95e-04 | 2.26e-03 | 22 |
| GO:00434731 | Esophagus | ESCC | pigmentation | 59/8552 | 98/18723 | 2.64e-03 | 1.12e-02 | 59 |
| GO:00484901 | Esophagus | ESCC | anterograde synaptic vesicle transport | 15/8552 | 19/18723 | 3.29e-03 | 1.35e-02 | 15 |
| GO:00995141 | Esophagus | ESCC | synaptic vesicle cytoskeletal transport | 15/8552 | 19/18723 | 3.29e-03 | 1.35e-02 | 15 |
| GO:00995171 | Esophagus | ESCC | synaptic vesicle transport along microtubule | 15/8552 | 19/18723 | 3.29e-03 | 1.35e-02 | 15 |
| Page: 1 2 |
| Pathway ID | Tissue | Disease Stage | Description | Gene Ratio | Bg Ratio | pvalue | p.adjust | qvalue | Count |
| Page: 1 |
Top |
Cell-cell communication analysis |
| Identification of potential cell-cell interactions between two cell types and their ligand-receptor pairs for different disease states |
| Ligand | Receptor | LRpair | Pathway | Tissue | Disease Stage |
| Page: 1 |
Top |
Single-cell gene regulatory network inference analysis |
| Find out the significant the regulons (TFs) and the target genes of each regulon across cell types for different disease states |
| TF | Cell Type | Tissue | Disease Stage | Target Gene | RSS | Regulon Activity |
| ∗The dot plots of a searched regulon are shown for all cell subpopulations in each disease state of each tissue based on the regulon specific score inferred using pySCENIC and by calculating the average expression. |
| Page: 1 |
Top |
Somatic mutation of malignant transformation related genes |
| Annotation of somatic variants for genes involved in malignant transformation |
| Hugo Symbol | Variant Class | Variant Classification | dbSNP RS | HGVSc | HGVSp | HGVSp Short | SWISSPROT | BIOTYPE | SIFT | PolyPhen | Tumor Sample Barcode | Tissue | Histology | Sex | Age | Stage | Therapy Types | Drugs | Outcome |
| BLOC1S5 | SNV | Missense_Mutation | c.286N>C | p.Asp96His | p.D96H | Q8TDH9 | protein_coding | tolerated(0.06) | benign(0.444) | TCGA-A2-A0ST-01 | Breast | breast invasive carcinoma | Female | <65 | I/II | Chemotherapy | adriamycin | SD | |
| BLOC1S5 | SNV | Missense_Mutation | c.445A>C | p.Met149Leu | p.M149L | Q8TDH9 | protein_coding | tolerated(0.47) | benign(0.003) | TCGA-D8-A147-01 | Breast | breast invasive carcinoma | Female | <65 | I/II | Chemotherapy | doxorubicine | SD | |
| BLOC1S5 | insertion | In_Frame_Ins | novel | c.385_386insAAA | p.Lys128dup | p.K128dup | Q8TDH9 | protein_coding | TCGA-AN-A0FN-01 | Breast | breast invasive carcinoma | Female | <65 | I/II | Unknown | Unknown | SD | ||
| BLOC1S5 | deletion | Frame_Shift_Del | novel | c.1_47delNNNNNNNNNNNNNNNNNNNNNNNNNNNNNNNNNNNNNNNNNNNNNNN | p.Met1_?16 | p.M1_?16 | Q8TDH9 | protein_coding | TCGA-C5-A7CK-01 | Cervix | cervical & endocervical cancer | Female | <65 | I/II | Chemotherapy | cisplatin | SD | ||
| BLOC1S5 | SNV | Missense_Mutation | rs183115218 | c.202N>T | p.Arg68Cys | p.R68C | Q8TDH9 | protein_coding | deleterious(0) | probably_damaging(0.917) | TCGA-A6-2686-01 | Colorectum | colon adenocarcinoma | Female | >=65 | I/II | Unknown | Unknown | SD |
| BLOC1S5 | SNV | Missense_Mutation | c.178N>G | p.Phe60Val | p.F60V | Q8TDH9 | protein_coding | deleterious(0) | probably_damaging(0.997) | TCGA-AA-3510-01 | Colorectum | colon adenocarcinoma | Male | >=65 | I/II | Unknown | Unknown | SD | |
| BLOC1S5 | SNV | Missense_Mutation | c.115N>A | p.Leu39Ile | p.L39I | Q8TDH9 | protein_coding | tolerated(0.24) | possibly_damaging(0.476) | TCGA-B5-A0JY-01 | Endometrium | uterine corpus endometrioid carcinoma | Female | <65 | III/IV | Chemotherapy | doxorubicin | SD | |
| BLOC1S5 | SNV | Missense_Mutation | c.472N>A | p.Glu158Lys | p.E158K | Q8TDH9 | protein_coding | tolerated(0.06) | benign(0.079) | TCGA-B5-A11R-01 | Endometrium | uterine corpus endometrioid carcinoma | Female | <65 | I/II | Chemotherapy | paclitaxel | SD | |
| BLOC1S5 | SNV | Missense_Mutation | novel | c.56N>A | p.Gly19Asp | p.G19D | Q8TDH9 | protein_coding | deleterious(0.04) | benign(0.018) | TCGA-B5-A3FC-01 | Endometrium | uterine corpus endometrioid carcinoma | Female | <65 | I/II | Unknown | Unknown | SD |
| BLOC1S5 | SNV | Missense_Mutation | c.491N>T | p.Arg164Ile | p.R164I | Q8TDH9 | protein_coding | deleterious(0.02) | benign(0.392) | TCGA-BS-A0UF-01 | Endometrium | uterine corpus endometrioid carcinoma | Female | >=65 | I/II | Unknown | Unknown | SD |
| Page: 1 2 |
Top |
Related drugs of malignant transformation related genes |
| Identification of chemicals and drugs interact with genes involved in malignant transfromation |
| (DGIdb 4.0) |
| Entrez ID | Symbol | Category | Interaction Types | Drug Claim Name | Drug Name | PMIDs |
| Page: 1 |

Copyright 2023-Present -The University of Texas Health Science Center at Houston |