
|
|||||
|
 | |
| |
| |
| |
| |
| |
|
Gene: BLOC1S4 |
Gene summary for BLOC1S4 |
| Gene information | Species | Human | Gene symbol | BLOC1S4 | Gene ID | 55330 |
| Gene name | biogenesis of lysosomal organelles complex 1 subunit 4 | |
| Gene Alias | BCAS4L | |
| Cytomap | 4p16.1 | |
| Gene Type | protein-coding | GO ID | GO:0001775 | UniProtAcc | Q9NUP1 |
Top |
Malignant transformation analysis |
| Identification of the aberrant gene expression in precancerous and cancerous lesions by comparing the gene expression of stem-like cells in diseased tissues with normal stem cells |
| Entrez ID | Symbol | Replicates | Species | Organ | Tissue | Adj P-value | Log2FC | Malignancy |
| 55330 | BLOC1S4 | LZE20T | Human | Esophagus | ESCC | 9.05e-12 | 3.92e-01 | 0.0662 |
| 55330 | BLOC1S4 | LZE24T | Human | Esophagus | ESCC | 5.18e-15 | 5.11e-01 | 0.0596 |
| 55330 | BLOC1S4 | P1T-E | Human | Esophagus | ESCC | 5.63e-17 | 5.55e-01 | 0.0875 |
| 55330 | BLOC1S4 | P2T-E | Human | Esophagus | ESCC | 4.13e-46 | 7.14e-01 | 0.1177 |
| 55330 | BLOC1S4 | P4T-E | Human | Esophagus | ESCC | 2.28e-28 | 6.70e-01 | 0.1323 |
| 55330 | BLOC1S4 | P5T-E | Human | Esophagus | ESCC | 2.45e-21 | 3.56e-01 | 0.1327 |
| 55330 | BLOC1S4 | P8T-E | Human | Esophagus | ESCC | 3.29e-33 | 5.95e-01 | 0.0889 |
| 55330 | BLOC1S4 | P9T-E | Human | Esophagus | ESCC | 8.12e-19 | 4.02e-01 | 0.1131 |
| 55330 | BLOC1S4 | P10T-E | Human | Esophagus | ESCC | 6.20e-25 | 3.83e-01 | 0.116 |
| 55330 | BLOC1S4 | P11T-E | Human | Esophagus | ESCC | 3.03e-19 | 6.82e-01 | 0.1426 |
| 55330 | BLOC1S4 | P12T-E | Human | Esophagus | ESCC | 8.08e-30 | 4.62e-01 | 0.1122 |
| 55330 | BLOC1S4 | P15T-E | Human | Esophagus | ESCC | 1.10e-09 | 2.61e-01 | 0.1149 |
| 55330 | BLOC1S4 | P16T-E | Human | Esophagus | ESCC | 1.48e-32 | 6.00e-01 | 0.1153 |
| 55330 | BLOC1S4 | P17T-E | Human | Esophagus | ESCC | 2.84e-10 | 4.78e-01 | 0.1278 |
| 55330 | BLOC1S4 | P19T-E | Human | Esophagus | ESCC | 1.02e-03 | 3.01e-01 | 0.1662 |
| 55330 | BLOC1S4 | P20T-E | Human | Esophagus | ESCC | 3.40e-13 | 3.19e-01 | 0.1124 |
| 55330 | BLOC1S4 | P21T-E | Human | Esophagus | ESCC | 9.84e-18 | 2.86e-01 | 0.1617 |
| 55330 | BLOC1S4 | P22T-E | Human | Esophagus | ESCC | 6.27e-35 | 5.54e-01 | 0.1236 |
| 55330 | BLOC1S4 | P23T-E | Human | Esophagus | ESCC | 1.93e-25 | 6.39e-01 | 0.108 |
| 55330 | BLOC1S4 | P24T-E | Human | Esophagus | ESCC | 5.39e-29 | 4.78e-01 | 0.1287 |
| Page: 1 2 3 4 5 6 |
| Tissue | Expression Dynamics | Abbreviation |
| Esophagus | 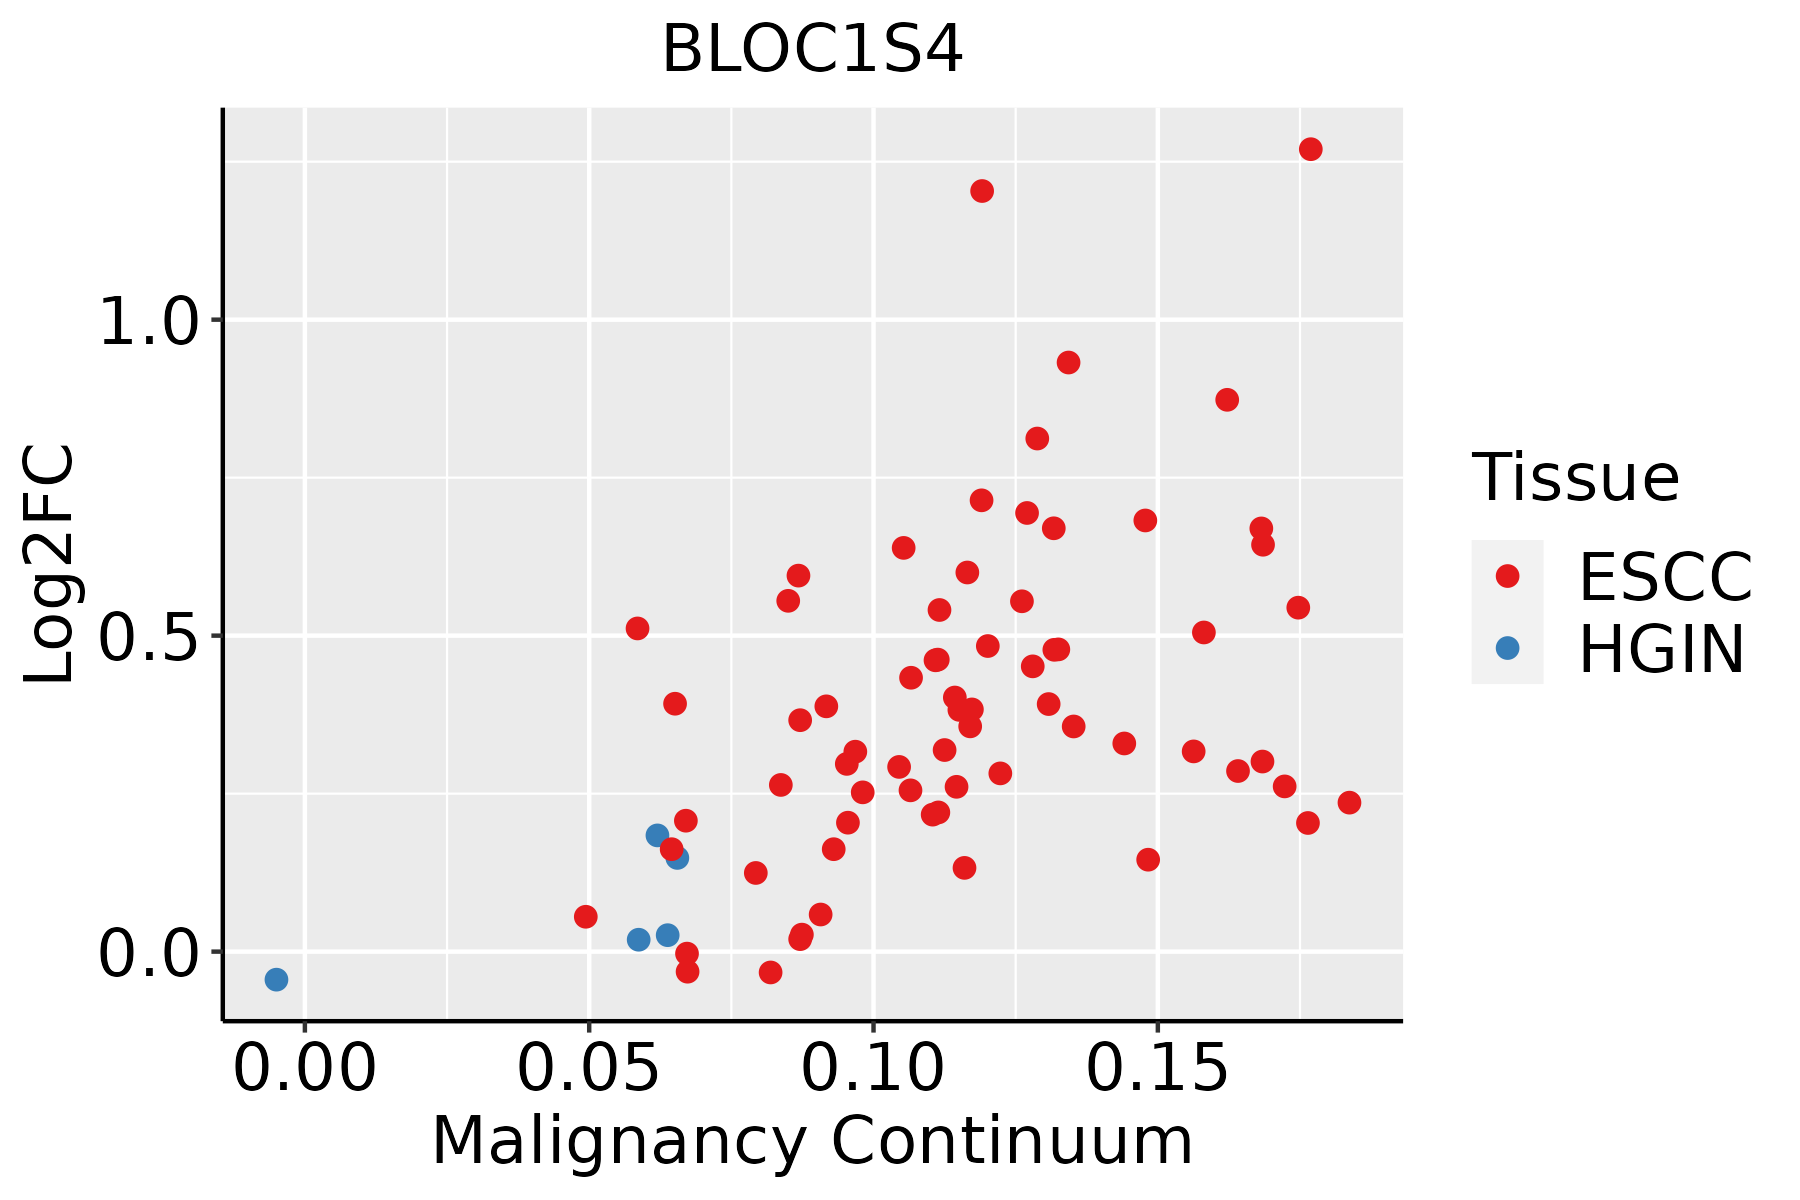 | ESCC: Esophageal squamous cell carcinoma |
| HGIN: High-grade intraepithelial neoplasias | ||
| LGIN: Low-grade intraepithelial neoplasias | ||
| Liver | 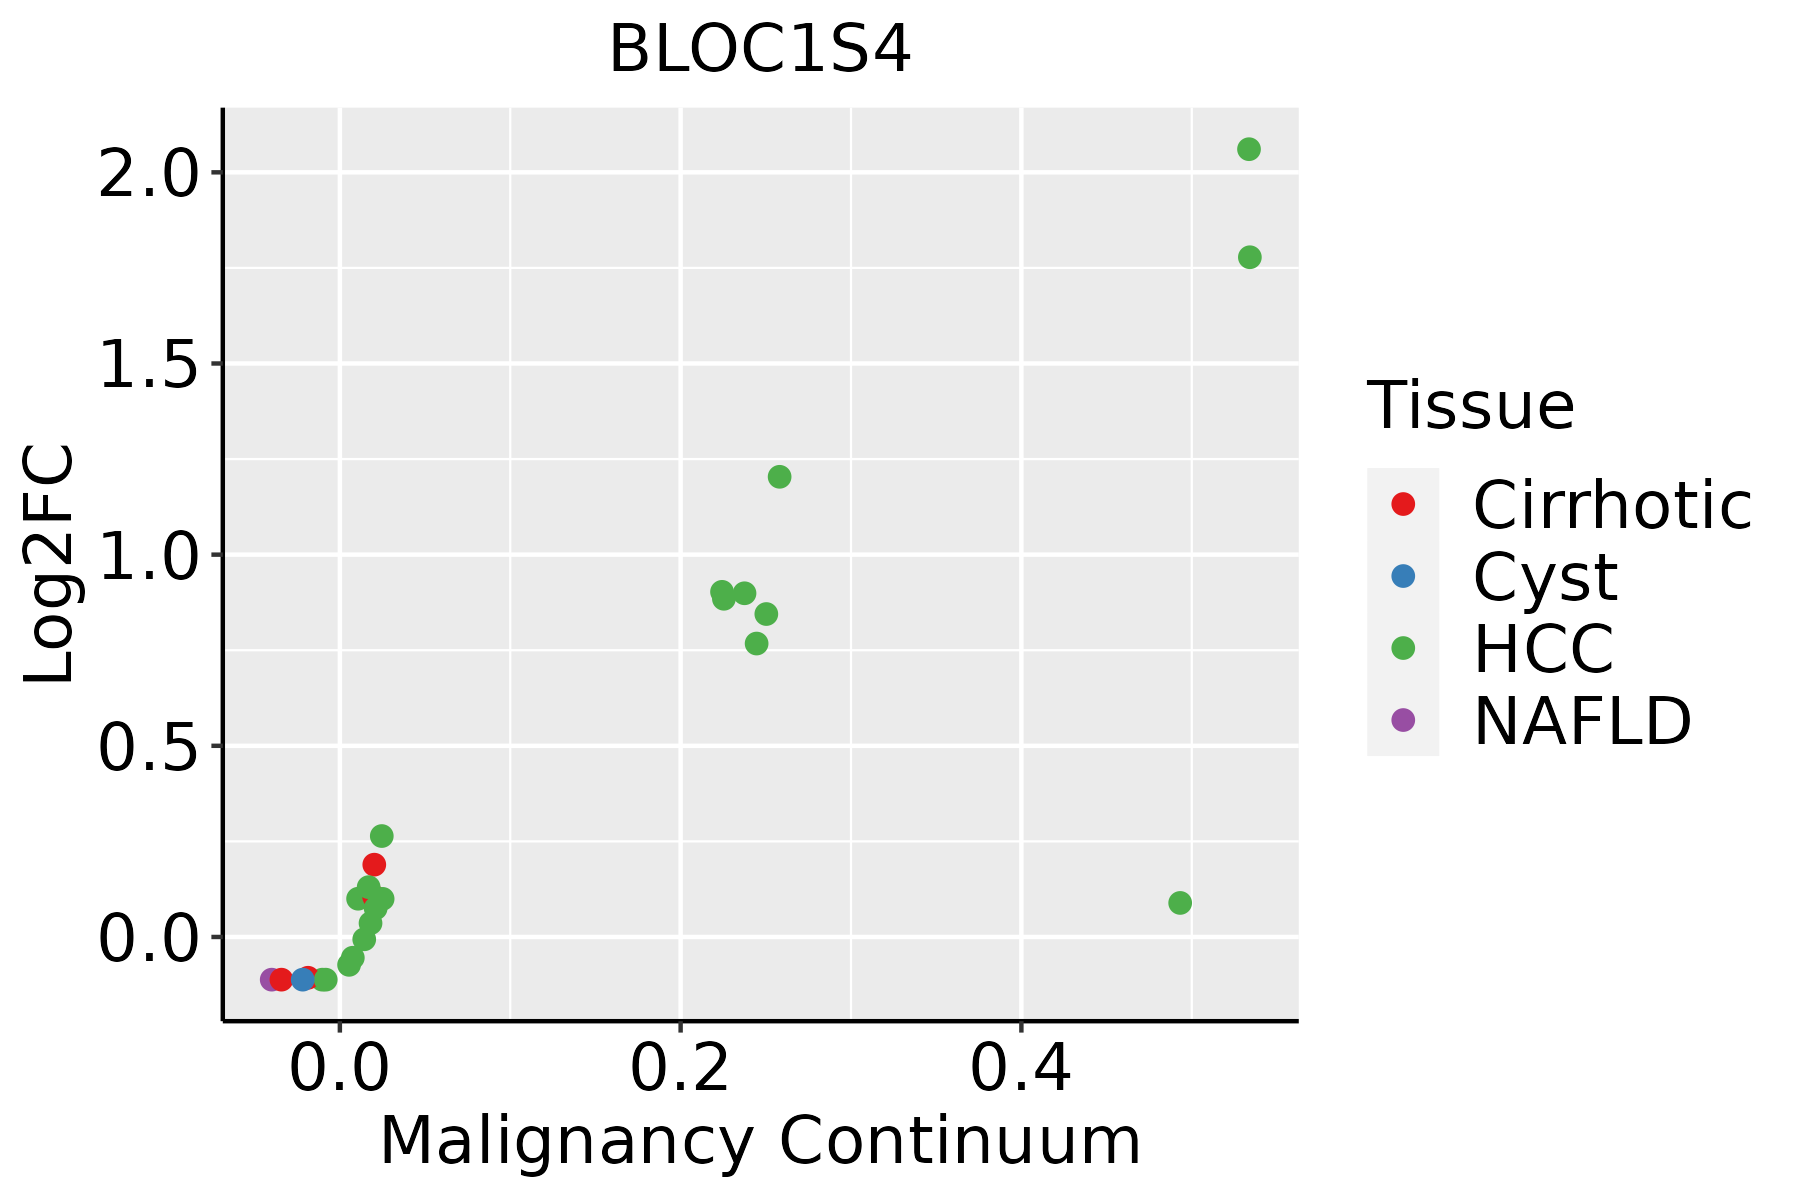 | HCC: Hepatocellular carcinoma |
| NAFLD: Non-alcoholic fatty liver disease | ||
| Oral Cavity |  | EOLP: Erosive Oral lichen planus |
| LP: leukoplakia | ||
| NEOLP: Non-erosive oral lichen planus | ||
| OSCC: Oral squamous cell carcinoma | ||
| Skin | 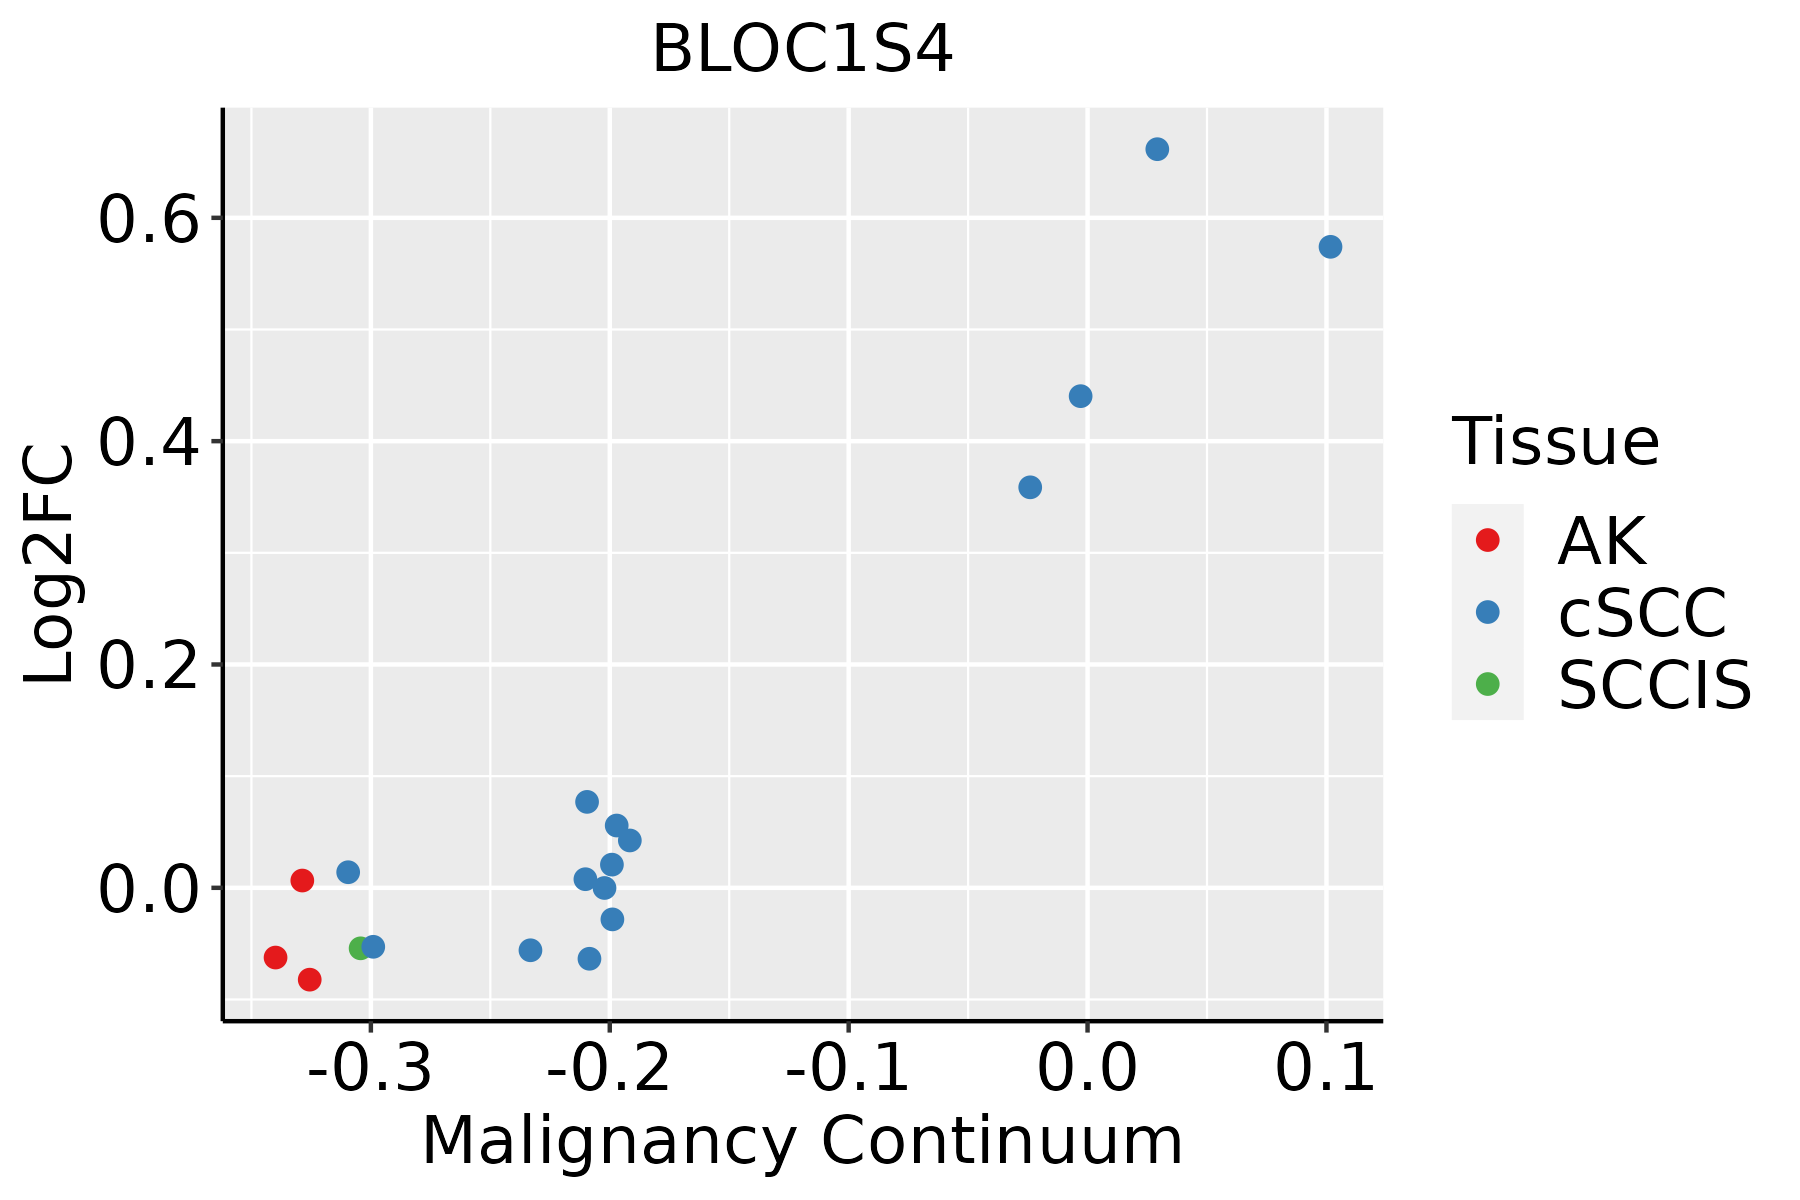 | AK: Actinic keratosis |
| cSCC: Cutaneous squamous cell carcinoma | ||
| SCCIS:squamous cell carcinoma in situ | ||
| Thyroid |  | ATC: Anaplastic thyroid cancer |
| HT: Hashimoto's thyroiditis | ||
| PTC: Papillary thyroid cancer |
| ∗log2FC in expression of this searched gene in stem-like cells from each diseased tissue sample relative to stem-like cells in normal samples in each tissue plotted against the malignancy continuum. Samples are colored based on if they are from different disease stage. |
Top |
Malignant transformation related pathway analysis |
| Find out the enriched GO biological processes and KEGG pathways involved in transition from healthy to precancer to cancer |
| Tissue | Disease Stage | Enriched GO biological Processes |
| Colorectum | AD |  |
| Colorectum | SER |  |
| Colorectum | MSS |  |
| Colorectum | MSI-H |  |
| Colorectum | FAP |  |
| ∗Top 15 enriched GO BP terms are showed in the bar plot of each disease state in each tissue. Each row represents a significant GO biological process which is colored according to the -log10(p.adjust). |
| Page: 1 2 3 4 5 6 7 8 9 |
| GO ID | Tissue | Disease Stage | Description | Gene Ratio | Bg Ratio | pvalue | p.adjust | Count |
| GO:005165617 | Esophagus | ESCC | establishment of organelle localization | 273/8552 | 390/18723 | 9.13e-23 | 1.81e-20 | 273 |
| GO:001605014 | Esophagus | ESCC | vesicle organization | 211/8552 | 300/18723 | 2.85e-18 | 2.87e-16 | 211 |
| GO:005165016 | Esophagus | ESCC | establishment of vesicle localization | 114/8552 | 161/18723 | 8.20e-11 | 2.53e-09 | 114 |
| GO:003070518 | Esophagus | ESCC | cytoskeleton-dependent intracellular transport | 133/8552 | 195/18723 | 1.48e-10 | 4.27e-09 | 133 |
| GO:001097013 | Esophagus | ESCC | transport along microtubule | 107/8552 | 155/18723 | 3.17e-09 | 6.80e-08 | 107 |
| GO:005164815 | Esophagus | ESCC | vesicle localization | 119/8552 | 177/18723 | 5.16e-09 | 1.08e-07 | 119 |
| GO:00723846 | Esophagus | ESCC | organelle transport along microtubule | 65/8552 | 85/18723 | 6.61e-09 | 1.35e-07 | 65 |
| GO:000808810 | Esophagus | ESCC | axo-dendritic transport | 58/8552 | 75/18723 | 2.09e-08 | 4.02e-07 | 58 |
| GO:00989304 | Esophagus | ESCC | axonal transport | 49/8552 | 64/18723 | 4.54e-07 | 6.15e-06 | 49 |
| GO:004206027 | Esophagus | ESCC | wound healing | 243/8552 | 422/18723 | 4.62e-07 | 6.25e-06 | 243 |
| GO:00330593 | Esophagus | ESCC | cellular pigmentation | 40/8552 | 53/18723 | 9.67e-06 | 9.21e-05 | 40 |
| GO:00474962 | Esophagus | ESCC | vesicle transport along microtubule | 36/8552 | 47/18723 | 1.53e-05 | 1.38e-04 | 36 |
| GO:00991114 | Esophagus | ESCC | microtubule-based transport | 115/8552 | 190/18723 | 2.54e-05 | 2.15e-04 | 115 |
| GO:00080892 | Esophagus | ESCC | anterograde axonal transport | 37/8552 | 50/18723 | 4.42e-05 | 3.51e-04 | 37 |
| GO:00995185 | Esophagus | ESCC | vesicle cytoskeletal trafficking | 50/8552 | 73/18723 | 6.75e-05 | 5.12e-04 | 50 |
| GO:00487531 | Esophagus | ESCC | pigment granule organization | 23/8552 | 29/18723 | 2.25e-04 | 1.40e-03 | 23 |
| GO:00324381 | Esophagus | ESCC | melanosome organization | 22/8552 | 28/18723 | 3.95e-04 | 2.26e-03 | 22 |
| GO:00434731 | Esophagus | ESCC | pigmentation | 59/8552 | 98/18723 | 2.64e-03 | 1.12e-02 | 59 |
| GO:00484901 | Esophagus | ESCC | anterograde synaptic vesicle transport | 15/8552 | 19/18723 | 3.29e-03 | 1.35e-02 | 15 |
| GO:00995141 | Esophagus | ESCC | synaptic vesicle cytoskeletal transport | 15/8552 | 19/18723 | 3.29e-03 | 1.35e-02 | 15 |
| Page: 1 2 3 4 5 6 7 8 |
| Pathway ID | Tissue | Disease Stage | Description | Gene Ratio | Bg Ratio | pvalue | p.adjust | qvalue | Count |
| Page: 1 |
Top |
Cell-cell communication analysis |
| Identification of potential cell-cell interactions between two cell types and their ligand-receptor pairs for different disease states |
| Ligand | Receptor | LRpair | Pathway | Tissue | Disease Stage |
| Page: 1 |
Top |
Single-cell gene regulatory network inference analysis |
| Find out the significant the regulons (TFs) and the target genes of each regulon across cell types for different disease states |
| TF | Cell Type | Tissue | Disease Stage | Target Gene | RSS | Regulon Activity |
| ∗The dot plots of a searched regulon are shown for all cell subpopulations in each disease state of each tissue based on the regulon specific score inferred using pySCENIC and by calculating the average expression. |
| Page: 1 |
Top |
Somatic mutation of malignant transformation related genes |
| Annotation of somatic variants for genes involved in malignant transformation |
| Hugo Symbol | Variant Class | Variant Classification | dbSNP RS | HGVSc | HGVSp | HGVSp Short | SWISSPROT | BIOTYPE | SIFT | PolyPhen | Tumor Sample Barcode | Tissue | Histology | Sex | Age | Stage | Therapy Types | Drugs | Outcome |
| BLOC1S4 | insertion | In_Frame_Ins | novel | c.517_518insATG | p.Leu173delinsHisVal | p.L173delinsHV | Q9NUP1 | protein_coding | TCGA-DS-A1OC-01 | Cervix | cervical & endocervical cancer | Female | <65 | I/II | Chemotherapy | gemcitabine | SD | ||
| BLOC1S4 | SNV | Missense_Mutation | novel | c.521T>A | p.Leu174Gln | p.L174Q | Q9NUP1 | protein_coding | deleterious(0) | probably_damaging(0.988) | TCGA-A5-A0GG-01 | Endometrium | uterine corpus endometrioid carcinoma | Female | >=65 | I/II | Unknown | Unknown | SD |
| BLOC1S4 | insertion | Frame_Shift_Ins | novel | c.305_306insG | p.Leu103AlafsTer82 | p.L103Afs*82 | Q9NUP1 | protein_coding | TCGA-AP-A0LH-01 | Endometrium | uterine corpus endometrioid carcinoma | Female | <65 | I/II | Chemotherapy | paclitaxel | PD | ||
| BLOC1S4 | SNV | Missense_Mutation | c.306N>T | p.Met102Ile | p.M102I | Q9NUP1 | protein_coding | deleterious(0.04) | possibly_damaging(0.731) | TCGA-BC-A10R-01 | Liver | liver hepatocellular carcinoma | Female | >=65 | III/IV | Other, specify in noteschemoembolization | unknown | PD | |
| BLOC1S4 | SNV | Missense_Mutation | c.506N>T | p.Ala169Val | p.A169V | Q9NUP1 | protein_coding | deleterious(0.05) | benign(0.371) | TCGA-44-2656-01 | Lung | lung adenocarcinoma | Male | <65 | I/II | Unknown | Unknown | PD | |
| BLOC1S4 | SNV | Missense_Mutation | c.388N>T | p.Arg130Cys | p.R130C | Q9NUP1 | protein_coding | deleterious(0.02) | possibly_damaging(0.533) | TCGA-50-5936-01 | Lung | lung adenocarcinoma | Male | <65 | III/IV | Chemotherapy | taxol | PD | |
| BLOC1S4 | SNV | Missense_Mutation | novel | c.575N>C | p.Gln192Pro | p.Q192P | Q9NUP1 | protein_coding | tolerated(0.3) | benign(0.006) | TCGA-55-8506-01 | Lung | lung adenocarcinoma | Female | <65 | I/II | Unknown | Unknown | SD |
| BLOC1S4 | SNV | Missense_Mutation | novel | c.379N>A | p.Glu127Lys | p.E127K | Q9NUP1 | protein_coding | deleterious(0.02) | benign(0.042) | TCGA-83-5908-01 | Lung | lung adenocarcinoma | Female | <65 | I/II | Unknown | Unknown | SD |
| BLOC1S4 | SNV | Missense_Mutation | novel | c.381G>C | p.Glu127Asp | p.E127D | Q9NUP1 | protein_coding | deleterious(0.02) | possibly_damaging(0.616) | TCGA-UF-A7JT-01 | Oral cavity | head & neck squamous cell carcinoma | Female | >=65 | I/II | Chemotherapy | cisplatin | PD |
| BLOC1S4 | SNV | Missense_Mutation | c.631T>C | p.Cys211Arg | p.C211R | Q9NUP1 | protein_coding | tolerated(0.51) | benign(0.053) | TCGA-HU-A4GX-01 | Stomach | stomach adenocarcinoma | Female | >=65 | III/IV | Chemotherapy | taxol | SD |
| Page: 1 |
Top |
Related drugs of malignant transformation related genes |
| Identification of chemicals and drugs interact with genes involved in malignant transfromation |
| (DGIdb 4.0) |
| Entrez ID | Symbol | Category | Interaction Types | Drug Claim Name | Drug Name | PMIDs |
| Page: 1 |

Copyright 2023-Present -The University of Texas Health Science Center at Houston |